

Paper Menu >>
Journal Menu >>
 Natural Resources, 2011, 2, 102-106 doi: 10.4236/nr.2011.22014 Published Online June 2011 (http://www.scirp.org/journal/nr) Copyright © 2011 SciRes. NR Leading Indicators of Heating Coal Pricing in Turkey: A Coal Pricing Model (2003-2009) Mehmet Mithat Uner1, Nezir Kose2, Soner Gokten3 1Department of Business Administration, Gazi University, Ankara, Turkey; 2Department of Econometrics, Gazi University, Ankara, Turkey; 3(Corresponding Author) Department of Accounting and Finance, Gazi University, Ankara, Turkey. E-mail: [email protected] Received January 11th, 2011; revised March 22nd, 2011; April, 1st, 2011. ABSTRACT In this study, a coal pricing model for Turkey is developed employing Granger causality and cointegration analysis by using monthly data between January 2003 and April 2009. Empirical results based on Granger causality tests indicate that foreign coal futures prices and domestic consumer price index for energy sector can be used as the leading indica- tors for domestic coal prices for Turkey. An error correction model for Turkish coal pricing is specified by taking into account the results of Granger causality. The forecast of the coal prices based on error correction model is giving very successful results. It is observed that the coal prices and forecasted coal prices values are almost moving together or very close to each other. Keywords: Pricing, Granger Causality, Heating Coal 1. Introduction Leading indicators of Turkish coal prices can be con- sidered as foreign energy prices, domestic inflation, cost factors, and economic growth of Turkey. The list of leading indicators [1] used in this study is given in Table 1. Our analysis is based on monthly data over the pe- riod January 2003-April 2009. Turkish coal prices (TL per tone) were taken from the Turkish Statistics Insti- tution. The code for this data is 0454001 according to Classification of Individual Consumption by Purpose (COICOP). We use US West Texas Intermediate (WTI) for foreign crude oil spot prices and Cushing, Okla- homa Crude Oil Future Contract 1 for foreign crude oil futures prices. Henry Hub Natural Gas Spot Prices and Natural Gas Futures Contract 1 are considered for spot and futures prices of foreign natural gas. Spot and fu- tures prices for foreign coal are Coal Commodity Spot Prices Central Appalachia (CAPP) 12,500 Btu, 1.2 SO2, and CAPP Coal Futures, respectively. The source for the spot prices is the Energy Informa- tion Administration (EIA), while futures prices were taken from the New York Mercantile Exchange (NY- MEX). Foreign energy prices are converted to Turkish Lira from US Dollar to consider the effect of exchange rate on Turkish coal prices. Table 1. The indicators for Turkish coal prices. Foreign Energy Prices Crude Oil Spot Prices Crude Oil Futures Prices Natural Gas Spot Prices Natural Gas Futures Prices Coal Spot Prices Coal Futures Prices Domestic Inflation Producer Price Index Producer Price Index for Mining Sector Consumer Price Index Consumer Price Index for Energy Sector Cost Factors Unit Labour Cost Other Inputs Cost Real Sector Industrial Production Four indicators are used for domestic inflation; 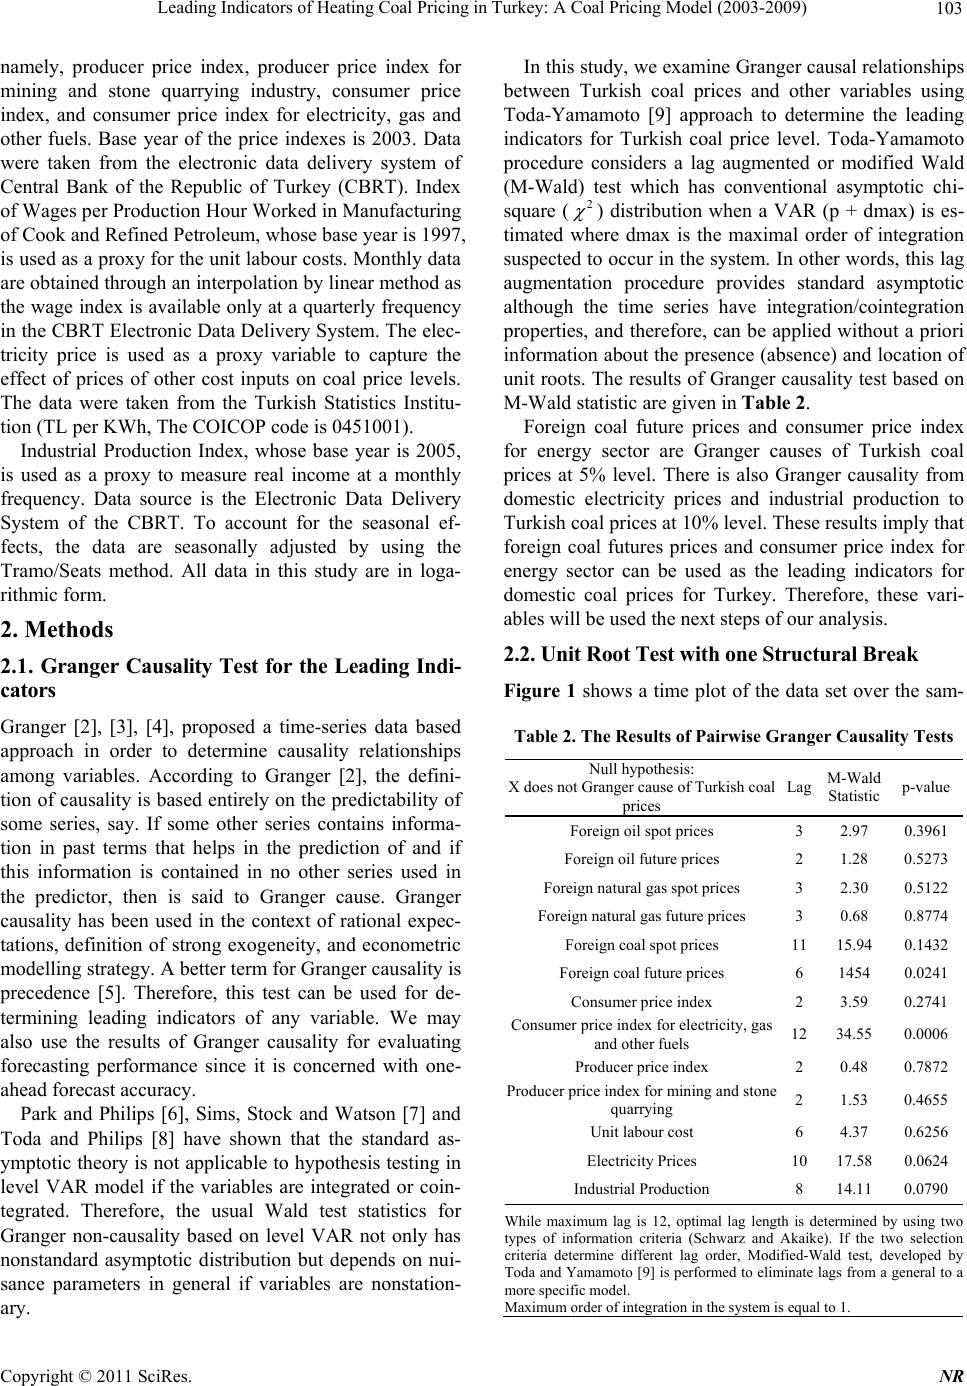 103 Leading Indicators of Heating Coal Pricing in Turkey: A Coal Pricing Model (2003-2009) namely, producer price index, producer price index for mining and stone quarrying industry, consumer price index, and consumer price index for electricity, gas and other fuels. Base year of the price indexes is 2003. Data were taken from the electronic data delivery system of Central Bank of the Republic of Turkey (CBRT). Index of Wages per Production Hour Worked in Manufacturing of Cook and Refined Petroleum, whose base year is 1997, is used as a proxy for the unit labour costs. Monthly data are obtained through an interpolation by linear method as the wage index is available only at a quarterly frequency in the CBRT Electronic Data Delivery System. The elec- tricity price is used as a proxy variable to capture the effect of prices of other cost inputs on coal price levels. The data were taken from the Turkish Statistics Institu- tion (TL per KWh, The COICOP code is 0451001). Industrial Production Index, whose base year is 2005, is used as a proxy to measure real income at a monthly frequency. Data source is the Electronic Data Delivery System of the CBRT. To account for the seasonal ef- fects, the data are seasonally adjusted by using the Tramo/Seats method. All data in this study are in loga- rithmic form. 2. Methods 2.1. Granger Causality Test for the Leading Indi- cators Granger [2], [3], [4], proposed a time-series data based approach in order to determine causality relationships among variables. According to Granger [2], the defini- tion of causality is based entirely on the predictability of some series, say. If some other series contains informa- tion in past terms that helps in the prediction of and if this information is contained in no other series used in the predictor, then is said to Granger cause. Granger causality has been used in the context of rational expec- tations, definition of strong exogeneity, and econometric modelling strategy. A better term for Granger causality is precedence [5]. Therefore, this test can be used for de- termining leading indicators of any variable. We may also use the results of Granger causality for evaluating forecasting performance since it is concerned with one- ahead forecast accuracy. Park and Philips [6], Sims, Stock and Watson [7] and Toda and Philips [8] have shown that the standard as- ymptotic theory is not applicable to hypothesis testing in level VAR model if the variables are integrated or coin- tegrated. Therefore, the usual Wald test statistics for Granger non-causality based on level VAR not only has nonstandard asymptotic distribution but depends on nui- sance parameters in general if variables are nonstation- ary. In this study, we examine Granger causal relationships between Turkish coal prices and other variables using Toda-Yamamoto [9] approach to determine the leading indicators for Turkish coal price level. Toda-Yamamoto procedure considers a lag augmented or modified Wald (M-Wald) test which has conventional asymptotic chi- square (2 ) distribution when a VAR (p + dmax) is es- timated where dmax is the maximal order of integration suspected to occur in the system. In other words, this lag augmentation procedure provides standard asymptotic although the time series have integration/cointegration properties, and therefore, can be applied without a priori information about the presence (absence) and location of unit roots. The results of Granger causality test based on M-Wald statistic are given in Table 2. Foreign coal future prices and consumer price index for energy sector are Granger causes of Turkish coal prices at 5% level. There is also Granger causality from domestic electricity prices and industrial production to Turkish coal prices at 10% level. These results imply that foreign coal futures prices and consumer price index for energy sector can be used as the leading indicators for domestic coal prices for Turkey. Therefore, these vari- ables will be used the next steps of our analysis. 2.2. Unit Root Test with one Structural Break Figure 1 shows a time plot of the data set over the sam- Table 2. The Results of Pairwise Granger Causality Tests Null hypothesis: X does not Granger cause of Turkish coal prices Lag M-Wald Statistic p-value Foreign oil spot prices 3 2.97 0.3961 Foreign oil future prices 2 1.28 0.5273 Foreign natural gas spot prices 3 2.30 0.5122 Foreign natural gas future prices 3 0.68 0.8774 Foreign coal spot prices 11 15.94 0.1432 Foreign coal future prices 6 1454 0.0241 Consumer price index 2 3.59 0.2741 Consumer price index for electricity, gas and other fuels 12 34.55 0.0006 Producer price index 2 0.48 0.7872 Producer price index for mining and stone quarrying 2 1.53 0.4655 Unit labour cost 6 4.37 0.6256 Electricity Prices 10 17.58 0.0624 Industrial Production 8 14.11 0.0790 While maximum lag is 12, optimal lag length is determined by using two types of information criteria (Schwarz and Akaike). If the two selection criteria determine different lag order, Modified-Wald test, developed by Toda and Yamamoto [9] is performed to eliminate lags from a general to a more specific model. Maximum order of integration in the system is equal to 1. Copyright © 2011 SciRes. NR 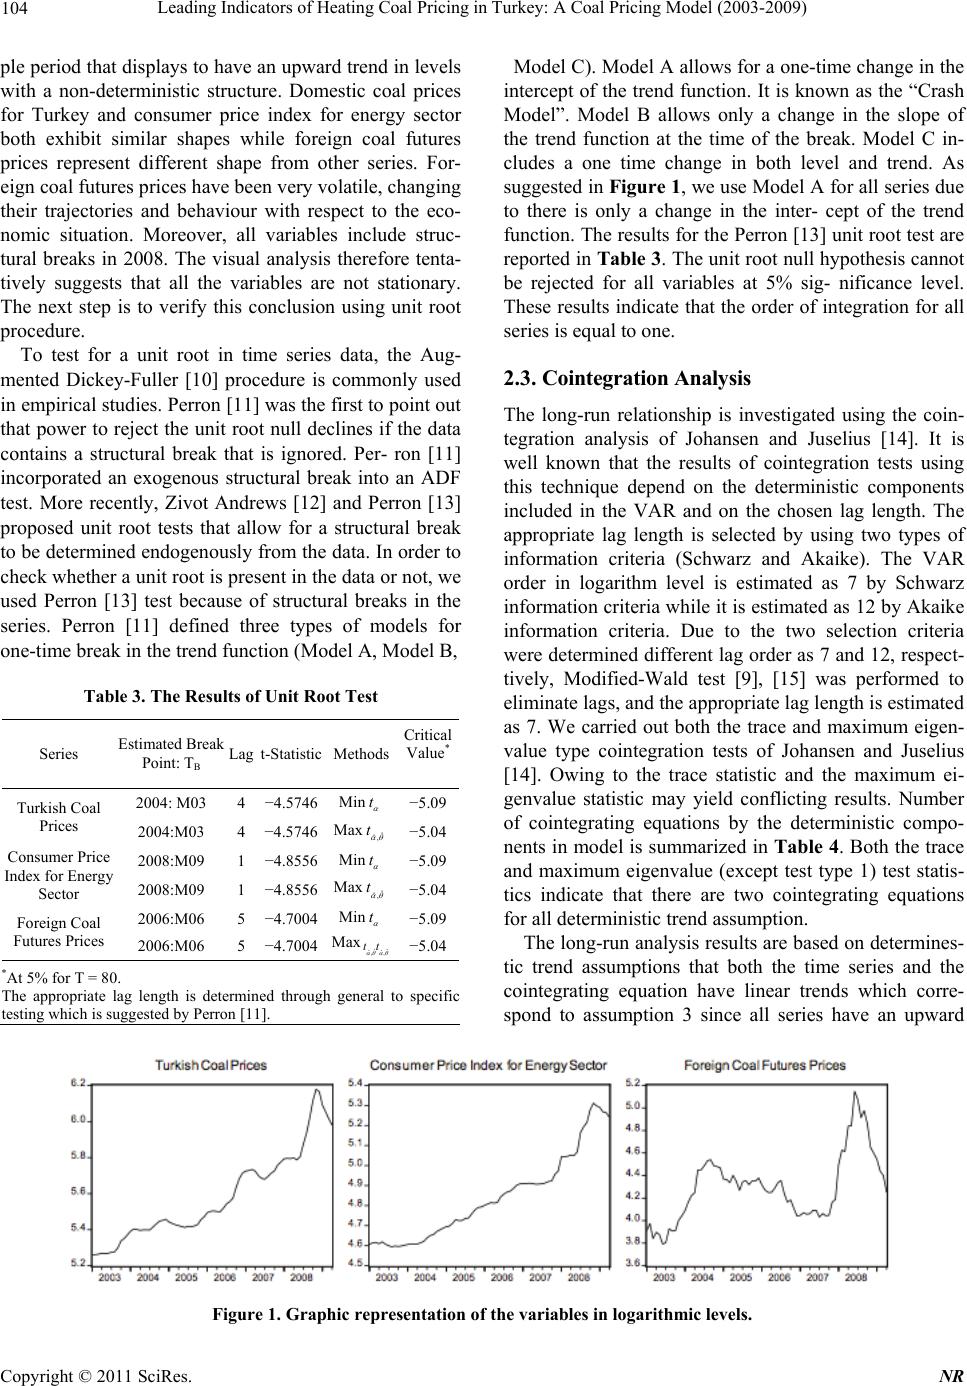 Leading Indicators of Heating Coal Pricing in Turkey: A Coal Pricing Model (2003-2009) Copyright © 2011 SciRes. NR 104 ple period that displays to have an upward trend in levels with a non-deterministic structure. Domestic coal prices for Turkey and consumer price index for energy sector both exhibit similar shapes while foreign coal futures prices represent different shape from other series. For- eign coal futures prices have been very volatile, changing their trajectories and behaviour with respect to the eco- nomic situation. Moreover, all variables include struc- tural breaks in 2008. The visual analysis therefore tenta- tively suggests that all the variables are not stationary. The next step is to verify this conclusion using unit root procedure. Model C). Model A allows for a one-time change in the intercept of the trend function. It is known as the “Crash Model”. Model B allows only a change in the slope of the trend function at the time of the break. Model C in- cludes a one time change in both level and trend. As suggested in Figure 1, we use Model A for all series due to there is only a change in the inter- cept of the trend function. The results for the Perron [13] unit root test are reported in Table 3. The unit root null hypothesis cannot be rejected for all variables at 5% sig- nificance level. These results indicate that the order of integration for all series is equal to one. To test for a unit root in time series data, the Aug- mented Dickey-Fuller [10] procedure is commonly used in empirical studies. Perron [11] was the first to point out that power to reject the unit root null declines if the data contains a structural break that is ignored. Per- ron [11] incorporated an exogenous structural break into an ADF test. More recently, Zivot Andrews [12] and Perron [13] proposed unit root tests that allow for a structural break to be determined endogenously from the data. In order to check whether a unit root is present in the data or not, we used Perron [13] test because of structural breaks in the series. Perron [11] defined three types of models for one-time break in the trend function (Model A, Model B, 2.3. Cointegration Analysis The long-run relationship is investigated using the coin- tegration analysis of Johansen and Juselius [14]. It is well known that the results of cointegration tests using this technique depend on the deterministic components included in the VAR and on the chosen lag length. The appropriate lag length is selected by using two types of information criteria (Schwarz and Akaike). The VAR order in logarithm level is estimated as 7 by Schwarz information criteria while it is estimated as 12 by Akaike information criteria. Due to the two selection criteria were determined different lag order as 7 and 12, respect- tively, Modified-Wald test [9], [15] was performed to eliminate lags, and the appropriate lag length is estimated as 7. We carried out both the trace and maximum eigen- value type cointegration tests of Johansen and Juselius [14]. Owing to the trace statistic and the maximum ei- genvalue statistic may yield conflicting results. Number of cointegrating equations by the deterministic compo- nents in model is summarized in Table 4. Both the trace and maximum eigenvalue (except test type 1) test statis- tics indicate that there are two cointegrating equations for all deterministic trend assumption. Table 3. The Results of Unit Root Test Series Estimated Break Point: TB Lagt-Statistic Methods Critical Value* 2004: M03 4−4.5746 Mint −5.09 Turkish Coal Prices 2004:M03 4−4.5746 Max ˆ ˆ, t −5.04 2008:M09 1−4.8556 Min t −5.09 Consumer Price Index for Energy Sector 2008:M09 1−4.8556 Max ˆ ˆ, t −5.04 2006:M06 5−4.7004 Min t −5.09 Foreign Coal Futures Prices 2006:M06 5−4.7004 Max ˆˆ ˆˆ ,, tt −5.04 *At 5% for T = 80. The appropriate lag length is determined through general to specific testing which is suggested by Perron [11]. The long-run analysis results are based on determines- tic trend assumptions that both the time series and the cointegrating equation have linear trends which corre- spond to assumption 3 since all series have an upward Figure 1. Graphic representation of the variables in logarithmic levels. 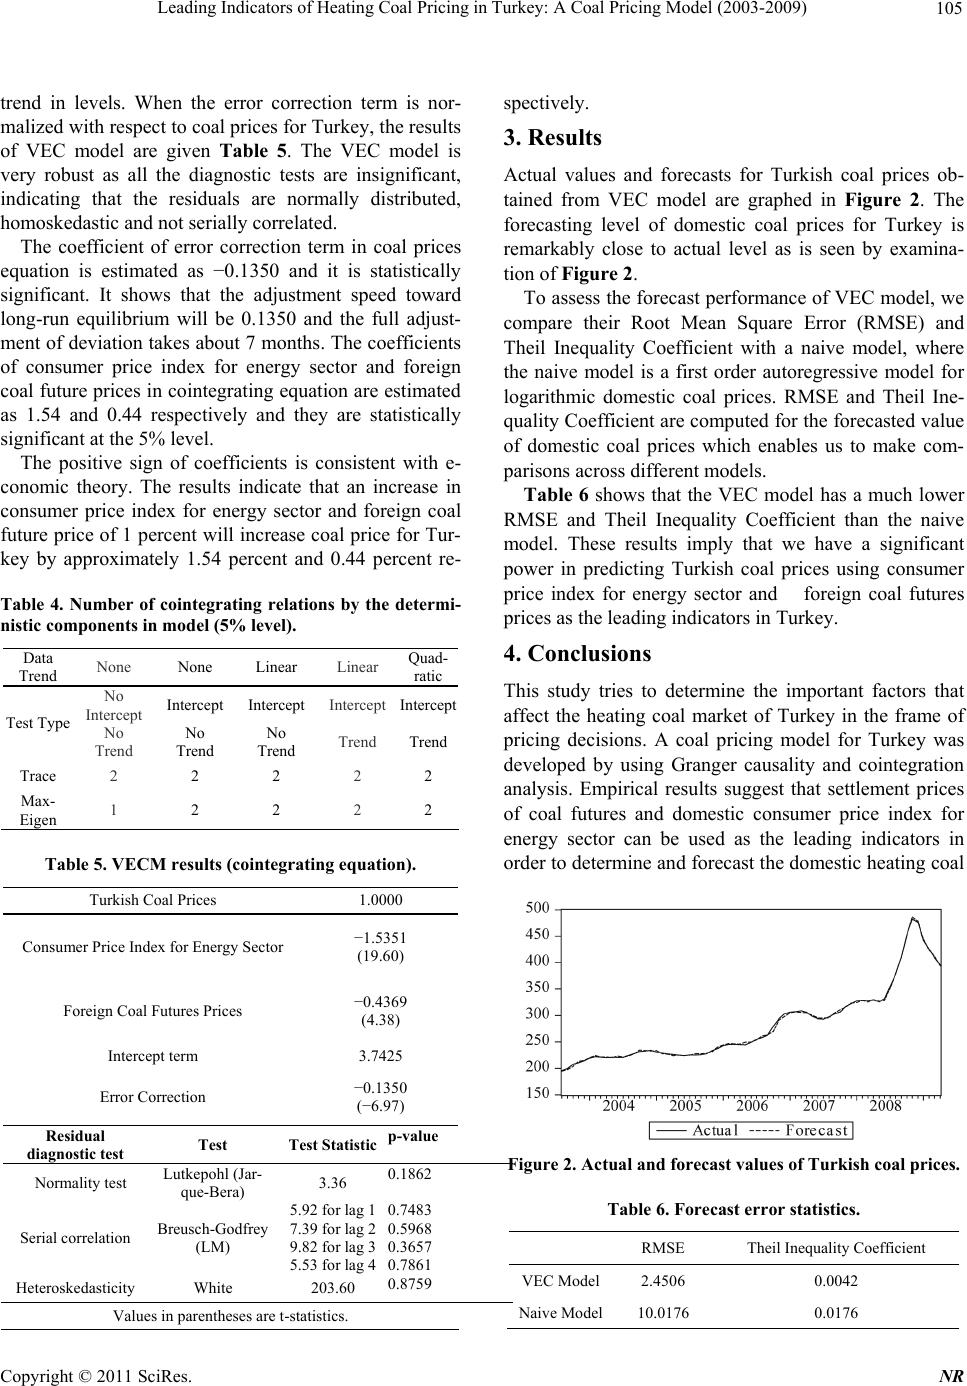 105 Leading Indicators of Heating Coal Pricing in Turkey: A Coal Pricing Model (2003-2009) trend in levels. When the error correction term is nor- malized with respect to coal prices for Turkey, the results of VEC model are given Table 5. The VEC model is very robust as all the diagnostic tests are insignificant, indicating that the residuals are normally distributed, homoskedastic and not serially correlated. The coefficient of error correction term in coal prices equation is estimated as −0.1350 and it is statistically significant. It shows that the adjustment speed toward long-run equilibrium will be 0.1350 and the full adjust- ment of deviation takes about 7 months. The coefficients of consumer price index for energy sector and foreign coal future prices in cointegrating equation are estimated as 1.54 and 0.44 respectively and they are statistically significant at the 5% level. The positive sign of coefficients is consistent with e- conomic theory. The results indicate that an increase in consumer price index for energy sector and foreign coal future price of 1 percent will increase coal price for Tur- key by approximately 1.54 percent and 0.44 percent re- Table 4. Number of cointegrating relations by the determi- nistic components in model (5% level). Data Trend None None Linear Linear Quad- ratic No Intercept Intercept Intercept Intercept Intercept Test Type No Trend No Trend No Trend Trend Trend Trace 2 2 2 2 2 Max- Eigen 1 2 2 2 2 Table 5. VECM results (cointegrating equation). Turkish Coal Prices 1.0000 Consumer Price Index for Energy Sector −1.5351 (19.60) Foreign Coal Futures Prices −0.4369 (4.38) Intercept term 3.7425 Error Correction −0.1350 (−6.97) Residual diagnostic test Test Test Statistic p-value Normality test Lutkepohl (Jar- que-Bera) 3.36 0.1862 Serial correlation Breusch-Godfrey (LM) 5.92 for lag 1 7.39 for lag 2 9.82 for lag 3 5.53 for lag 4 0.7483 0.5968 0.3657 0.7861 Heteroskedasticity White 203.60 0.8759 Values in parentheses are t-statistics. spectively. 3. Results Actual values and forecasts for Turkish coal prices ob- tained from VEC model are graphed in Figure 2. The forecasting level of domestic coal prices for Turkey is remarkably close to actual level as is seen by examina- tion of Figure 2. To assess the forecast performance of VEC model, we compare their Root Mean Square Error (RMSE) and Theil Inequality Coefficient with a naive model, where the naive model is a first order autoregressive model for logarithmic domestic coal prices. RMSE and Theil Ine- quality Coefficient are computed for the forecasted value of domestic coal prices which enables us to make com- parisons across different models. Table 6 shows that the VEC model has a much lower RMSE and Theil Inequality Coefficient than the naive model. These results imply that we have a significant power in predicting Turkish coal prices using consumer price index for energy sector and foreign coal futures prices as the leading indicators in Turkey. 4. Conclusions This study tries to determine the important factors that affect the heating coal market of Turkey in the frame of pricing decisions. A coal pricing model for Turkey was developed by using Granger causality and cointegration analysis. Empirical results suggest that settlement prices of coal futures and domestic consumer price index for energy sector can be used as the leading indicators in order to determine and forecast the domestic heating coal Figure 2. Actual and forecast values of Turkish coal prices. Table 6. Forecast error statistics. RMSE Theil Inequality Coefficient VEC Model2.4506 0.0042 Naive Model10.0176 0.0176 Copyright © 2011 SciRes. NR  106 Leading Indicators of Heating Coal Pricing in Turkey: A Coal Pricing Model (2003-2009) prices for Turkey. An error correction model for Turkish coal pricing is specified by taking into account the results of Granger causality. The forecast of the coal prices based on error correction model is giving very successful results. It is observed that the coal prices and forecasted coal prices values are almost moving together or very close to each other. REFERENCES [1] M. M. Uner, N. Kose, S. Gokten, and P. Okan, “Financial and Economic Factors Affecting the Lignite Prices in Turkey: An Analysis of Soma and Can Lignites,” Re- sources Policy, Vol. 33, No. 4, 2008, pp. 230-239. doi:10.1016/j.resourpol.2008.08.007 [2] C. W. J. Granger, “Investigating Causal Relations by Econometric Models: Cross Spectral Methods,” Econo- metrica, Vol. 37, No. 3, 1969, pp. 424–438. doi:10.2307/1912791 [3] J. R. McCrorie and M. J. Chambers, “Granger Causality and the Sampling of Economic Processes,” Journal of Econometrics, Vol. 132, No. 2, 2006, pp. 311-336. doi:10.1016/j.jeconom.2005.02.002 [4] D. TjØstheim, “Granger-causality in multiple time se- ries,” Journal of Econometrics, Vol. 17, No. 2, 1981, pp. 157-176. doi:10.1016/0304-4076(81)90024-5 [5] G. S. Maddala and M. Kim, “Unit Roots, Cointegration and Structural Change,” Cambridge University Press, 2002. [6] J. Y. Park and P. C. B. Philips, “Statistical Inference in Regressions with Integrated Process: Part 2,” Economet- ric Theory, Vol. 5, 1989, pp. 95-132. doi:10.1017/S0266466600012287 [7] C. A. Sims, J. H. Stock and M. W. Watson, “Inference in Linear Time Series Models With Some Unit Roots,” Econometrica, Vol. 58, 1990, pp. 113-144. doi:10.2307/2938337 [8] H. Y. Toda and P. C. B. Phillips, “Vector Autoregression and Causality,” Econometrica, Vol. 59, 1993, pp. 229-255. doi:10.1016/0304-4076(93)90024-Y [9] H. Toda and T. Yamamato, “Statistical Inference in Vec- tor Autoregressions with Possibly Integrated Processes,” Journal of Econometrics, Vol. 66, 1995, pp. 225-250. doi:10.1016/0304-4076(94)01616-8 [10] D. A. Dickey and W. A. Fuller, “Likelihood Ratio Statis- tics for Autoregressive Time Series with a Unit Root,” Econometrica, Vol. 49, 1981, pp. 1057-1072. doi:10.2307/1912517 [11] P. Perron, “The Great Crash, the Oil Price Shock, and the Unit Root Hypothesis,” Econometrica, Vol. 57, 1989, pp. 1361-1401. doi:10.2307/1913712 [12] E. Zivot and D. Andrews, “Further Evidence on the Great Crash, the Oil-Price Shocks, and the Unit Root hy- pothesis,” Journal of Business and Economic Statistics, Vol. 10, 1992, pp. 251-272. doi:10.2307/1391541 [13] P. Perron, “Further Evidence on Breaking Trend Func- tions in Macroeconomic Variables,” Journal of Econo- metrics, Vol. 80, 1997, pp. 355-385. doi:10.1016/S0304-4076(97)00049-3 [14] S. Johansen and K. Juselius, “Maximum Likelihood Es- timation and Inference on Cointegration with Applica- tions to the Demand for Money,” Oxford Bulletin of Economics and Statistics, Vol. 52, 1990, pp. 169-210. doi:10.1111/j.1468-0084.1990.mp52002003.x [15] H. Lütkepohl and M. M. Burda, “Modified Wald Tests under Nonregular Conditions,” Journal of Econometrics, Vol. 78, No. 1, 1997, pp. 315-332. doi:10.1016 /S0304-407 6(97)80015 -2 C opyright © 2011 SciRes. NR |