

Paper Menu >>
Journal Menu >>
 Journal of Service Science and Management, 2011, 4, 184-190 doi:10.4236/jssm.2011.42022 Published Online June 2011 (http://www.SciRP.org/journal/jssm) Copyright © 2011 SciRes. JSSM A Comparative Appraisal of Timings for Program Evaluation Survey and Related Institutional Results in Saudi Arabia: Quality Management in Higher Education Abdullah Al Rubaish Office of the Presid e n t , Uni v ersity of Dammam, Damma m, Saudi Arabia. Email: [email protected] Received January 29th, 2011; revised April 7th, 2011; accepted May 9th, 2011. ABSTRACT The periodic evaluation of academic programs is mandatory for quality management in higher education world-wide. This paper reports a unique setting in which each student performed two such evaluations using structured question- naires, viz.: (a) “Student Experience Survey” (SES) for their learning experience halfway through their academic pro- gram, and (b) “Program Evaluation Survey” (PES) at end of the program. A comparative appraisal of these two sets of data from students doing the Bachelor of Dental Surgery, College of Dentistry, University of Dammam, Saudi Arabia, aims to see if it is valid to generalize the observed related differentials in Saudi Arabia. The percentage of students’ participation was 100% in both SES and PES. In the students’ perceived cumulative experience, none of the total 20 items in SES was reported to be of either “high” or “acceptable” quality. By contrast, in the PES, one of the 13 items common to both questionna ires was reported to be of “high qu ality” (“What I have learnt in this prog ram will be valu- able for future”). Again, one of nine additional items in PES (“Developed knowledge & skill for my chosen career”) emerged to be of acceptable quality. In summary, irrespective of timing for PES, the results suggest the need of im- provements in relation to almost every item confirming ongoing developmental phase. Keywords: Student Experience Survey, Program Evaluation Survey, Academic Program, Higher Education, High Quality, Acceptable and Improvement Required Perception 1. Introduction 1.1. Background The evidence generated from students’ evaluation sur- veys on specific aspects of the function of Colleges and universities (e.g. course, faculty, program, support ser- vices, and the institution in general) remains valuable input in guiding the management of the quality in higher education [1,2]. This has led to the continuation of insti- tutional stud ies involv ing such evalu ations , with resultant increased the flow of literature on these topics. To maximize utility of such evidence, in time knowledge about concerned users and organization of relevant ori- entation for them are equally important [1 ,2]. In this era of quality in in stitutions of higher edu cation, especially the race aiming at enhancing the quality, stu- dents’ evaluations become unavoidable [3-16]. Instead of reported limitations of such surveys, activities related to quality developments and their sustainability heav ily rely on them [1,17]. It demands better understanding of the use of evaluation results [2,18]. For this, the require- ments of different g roups of users also need to be stud ied [2,19]. As reported recently by Rubaish [2], the University of Dammam (UoD) is currently involved in a range of evaluations by students. These are required for academic accreditation by the National Commission for Academic Accreditation & Assessment (NCAAA). A unique settin g was described in which two students’ evaluations deal with the program– viz.: Student Experience Survey (SES) and Program Evaluation Survey (PES). Whereas the SES assesses the experience of students midway through a given academic program, PES does so at the program’s end. These two terminologies are rare in the literature 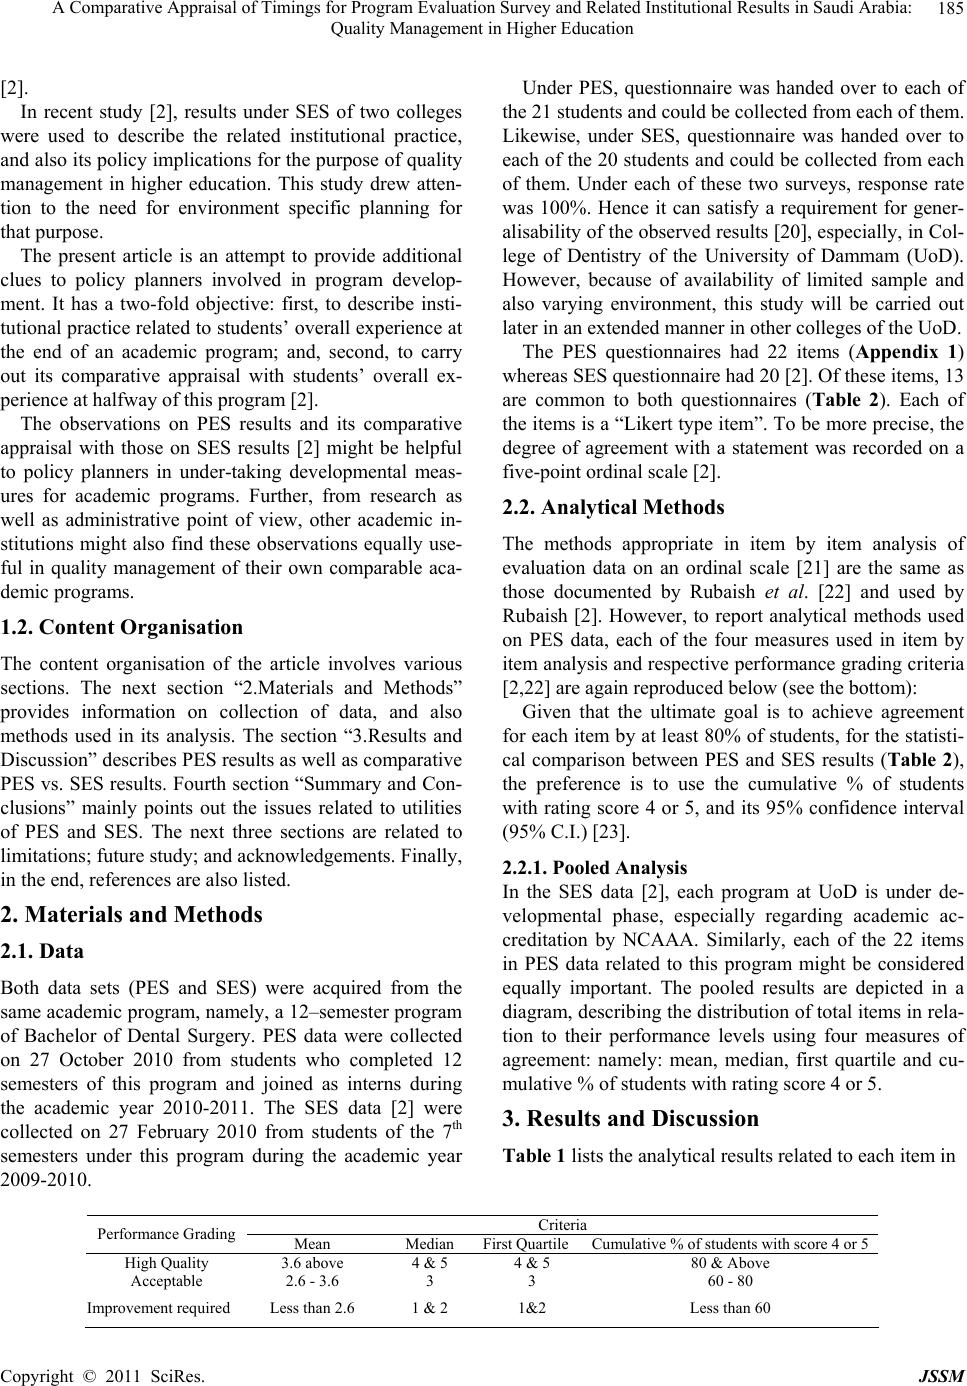 A Comparative Appraisal of Timings for Program Evaluation Survey and Related Institutional Results in Saudi Arabia: Quality Management in Higher Education Copyright © 2011 SciRes. JSSM 185 [2]. In recent study [2], results under SES of two colleges were used to describe the related institutional practice, and also its policy i mplications for the purpose of quality management in higher education. This study drew atten- tion to the need for environment specific planning for that purpose. The present article is an attempt to provide additional clues to policy planners involved in program develop- ment. It has a two-fold objective: first, to describe insti- tutional practice related to stud ents’ overall experience at the end of an academic program; and, second, to carry out its comparative appraisal with students’ overall ex- perience at halfway of this program [2]. The observations on PES results and its comparative appraisal with those on SES results [2] might be helpful to policy planners in under-taking developmental meas- ures for academic programs. Further, from research as well as administrative point of view, other academic in- stitutions might also find these observations equally use- ful in quality management of their own comparable aca- demic programs. 1.2. Content Organisation The content organisation of the article involves various sections. The next section “2.Materials and Methods” provides information on collection of data, and also methods used in its analysis. The section “3.Results and Discussion” describes PES results as well as comparative PES vs. SES results. Fourth section “Summary and Con- clusions” mainly points out the issues related to utilities of PES and SES. The next three sections are related to limitations; futu re study; and acknowledg emen ts. Finally, in the end, references are also listed. 2. Materials and Methods 2.1. Data Both data sets (PES and SES) were acquired from the same academic program, namely, a 12–semester program of Bachelor of Dental Surgery. PES data were collected on 27 October 2010 from students who completed 12 semesters of this program and joined as interns during the academic year 2010-2011. The SES data [2] were collected on 27 February 2010 from students of the 7th semesters under this program during the academic year 2009-2010. Under PES, questionnaire was handed over to each of the 21 students and could be collected from each of them. Likewise, under SES, questionnaire was handed over to each of the 20 students and could be collected from each of them. Under each of these two surveys, response rate was 100%. Hence it can satisfy a requirement for gener- alisability of the observ ed results [20], especially, in Col- lege of Dentistry of the University of Dammam (UoD). However, because of availability of limited sample and also varying environment, this study will be carried out later in an extended manner in other colleges of the UoD. The PES questionnaires had 22 items (Appendix 1) whereas SES questionnaire had 20 [2]. Of these items, 13 are common to both questionnaires (Table 2). Each of the items is a “Likert type item”. To b e more precise, the degree of agreement with a statement was recorded on a five-point ordinal scale [2]. 2.2. Analytical Methods The methods appropriate in item by item analysis of evaluation data on an ordinal scale [21] are the same as those documented by Rubaish et al. [22] and used by Rubaish [2]. However, to report analytical methods used on PES data, each of the four measures used in item by item analysis and respective performance grading criteria [2,22] are again reproduced below (see the bottom): Given that the ultimate goal is to achieve agreement for each item by at least 80% of students, for the statisti- cal comparison between PES and SES results (Table 2), the preference is to use the cumulative % of students with rating score 4 or 5, and its 95% confidence interval (95% C.I.) [23]. 2.2.1. Pooled Analysis In the SES data [2], each program at UoD is under de- velopmental phase, especially regarding academic ac- creditation by NCAAA. Similarly, each of the 22 items in PES data related to this program might be considered equally important. The pooled results are depicted in a diagram, describing the distribution of total items in rela- tion to their performance levels using four measures of agreement: namely: mean, median, first quartile and cu- mulative % of students with rating score 4 or 5. 3. Results and Discussion Table 1 lists the analytical results related to each item in Criteria Performance Grading Mean Median First QuartileCumulative % of students with score 4 or 5 High Quality 3.6 above 4 & 5 4 & 5 80 & Above Acceptable 2.6 - 3.6 3 3 60 - 80 Improvement required Less than 2.6 1 & 2 1&2 Less than 60  A Comparative Appraisal of Timings for Program Evaluation Survey and Related Institutional Results in Saudi Arabia: Quality Management in Higher Education Copyright © 2011 SciRes. JSSM 186 Table 1. Program evaluation survey results. Item # Similar SES Item Number Mean Median 1st Quartile Cum. % of 4 or 5 1 3.0 3 2 43 2 03 3.3 4 3 52 3 2.7 3 2 29 4 2.5 2 2 19 5 3.1 3 3 33 6 2.8 3 2 33 7 12 2.4 2 2 19 8 18 4.0 4 4 81 9 3.1 3 3 48 10 08 2.1 2 1 14 11 05 3.5 3 3 48 12 06 2.1 2 1 14 13 10 1.6 1 1 05 14 11 2.6 2 2 24 15 3.2 3 3 48 16 17 3.2 3 2 48 17 15 3.2 3 2 43 18 19 3.4 4 3 52 19 16 3.1 3 2 33 20 14 2.8 3 2 33 21 3.6 4 3 62 22 3.2 3 2 48 Table 2. Comparison of PES (n = 21) & SES (n = 20) Results. Item No. Cum. % 4 or 5 (95% C.I.) # Items Under PES SESPES SES Both PES & SES 1 Consultation & advise opportunity by instructors 02 03 52 (31, 74) 00 (00, 00) 2 Faculty interest in students' progress 07 12 19 (02, 36) 15 (00, 31) 3 Valuable knowledge & skill for future career 08 18 81 (64, 98) 25 (06, 44) 4 Sufficient library resources 10 08 14 (–1, 29) 10 (–3, 23) 5 Adequate classroom facilities 11 05 48 (26, 69) 45 (23, 67) 6 Sufficient computing facilities 12 06 14 (–1, 29) 00 (00, 00) 7 Adequate facilities for extracurricular activities 13 10 05 (–4, 14) 00 (00, 00) 8 Adequate facilities for religious observances 14 11 24 (06, 42) 17 (00, 34) 9 Stimulating interest in further learning 16 17 48 (26, 69) 05 (–4, 15) 10 Increased ability to investigate and solve new problems 17 15 43 (22, 64) 30 (10, 50) 11 Improved ability to work in groups 18 19 52 (31, 74) 40 (19, 61) 12 Improved communication skill 19 16 33 (13, 53) 20 (02, 38) 13 Developed skills to investigate issues & communicate results20 14 33 (13, 53) 10 (00, 23) PES Only 14 Adequate academic & career counseling 01 43 (22, 64) 15 Inspiration to do best by instructor 03 29 (09, 48) 16 Helpful feedback from instructors 04 19 (02, 36) 17 Thorough knowledgeable instructors 05 33 (13, 53) 18 Enthusiastic instructors 06 33 (13, 53) 19 Up-to-date & useful study material 09 48 (26, 69) 20 Effective field experience programs 15 48 (26, 69) 21 Developed knowledge & skill for chosen career 21 62 (41, 83) 22 Overall Satisfaction as a student at university 22 48 (26, 69) SES Only 23 Easy to find information about University 01 05 (–4, 15) 24 Helpful orientation week 02 25 (06, 44) 25 Simple & efficient procedure for enrolling in courses 04 05 (–4, 15) 26 Helpful library staff 07 25 (06, 44) 27 Convenient opening timings of for library 09 00 (00, 00) 28 Faculty are fair in their treatment of students 13 00 (00, 00) 29 Overall Satisfaction as a student at university 20 00 (00, 00)  A Comparative Appraisal of Timings for Program Evaluation Survey and Related Institutional Results in Saudi Arabia: Quality Management in Higher Education Copyright © 2011 SciRes. JSSM 187 PES. The similarity of PES items with SES items [2] has also been recorded in second column of this table. In addition, pooled PES results at program level are em- bodied in Figure 1. For comparison with the SES results, although not listed here, those already reported by Rubaish [2] were used. The successive sections describe the planned observations. 3.1. PES Results When the mean grading criterion was used, it was found that “high quality” perception of students was only 2/22 (9%) items (Table 1). The two items were “valuable knowledge & skill for the future career”; and “I devel- oped knowledge and skills for my career.” The “accept- able” rating was observed in 15/22 (68%) items. They were “adequate academic & career counseling; consulta- tion & advise opportunity by instructors; inspiration to do best by instructor; thorough knowledgeable instruc- tors; enthusiastic instructors; up-to-date and useful study materials; adequate facilities for religious observances; effective field experience programs; stimulating interest in further learning; increased ability to investigate/solve problems; improved ability to work in groups; improved communication skills; developed skills in using technol- ogy to investigate issues & communicate results; and overall satisfied with the quality of learning experi- ences.” The remaining 5/22 (23%) items had students’ rating as “improvement required”. They were “helpful feedback from instructors; faculty interest in students’ progress; sufficient library resources and its availability; sufficient computing facility; and adequate facilities for extracurricular activities.” The consideration of the median rating of an item im- plies that at least 50% of the stud ents assigned that rating to the item. Its use yields more clarity in observations and their implications [2,22]. Under the related perform- ance grading criterion, apart from 3/22 (14%) items, the earlier observations remain unchanged. The students’ ratings now improved from “acceptable” to “high qual- ity” in relation to two items, first- consultation & advice opportunity by instructors; and second- improved ability to work in groups.” In contrast, in relation to third item, students’ perception of adequate facilities for religious observances, declined from “acceptable” to “improve- ment required”. Out of 22 items, “high quality”, “ac- ceptable” and “improvement required” items converged in 4 (18%), 12 (55%) and 6 (27%) items respectively (Figure 1). Instead of earlier target of achieving satisfaction among at least 50% students, an increase in satisfaction level to at least 75% (first quartile), its related grading criterion lowered proportion of items with “high quality” Figure 1. Pooled PES results. to 5 % (1/22) and “acceptable” to 32% (7/22). As a result, as evident from Figure 1, it increased those with “im- provement requir ed” to 63% (14 /22). The on ly ite m rated with “high quality” was “valuable knowledge & skill for future career.” The performance grading criterion based on further increase in satisfaction level to at least 80% failed to alter earlier ratings of item with “high quality”. However, it pushed down the satisfaction level in majority (6/7) of the items with “acceptable” rating earlier. As a result, apart from one item (5%) with “high quality” and another one (5%) with “acceptable” ratings, 90% of the remain- ing items (20/22) need further improvements (Figure 1). 3.2. Comparative PES vs. SES Results The comparative observations between PES results just described in the previous section and SES results re- cently reported by Rubaish [2] are presented next. To do this, use of 95% C.I. (Table 2) of the cumulative % of students with their reported ratings 4 or 5 was made. For this, comparison between PES and SES questionnaires revealed that PES has 60% (13/22) common questions with those in SES (Table 2). Among them, results of 70% (10/13) of the items were in comparable range. These items were: adequate classroom facilities; suffi- cient computing facilities; sufficient library resources; adequate facilities for extracurricular activities; adequate facilities for religious observances; faculty interest in students’ progress; developed skills to investigate issues & communicate results; increased ability to investigate and solve new prob lems; improved communicatio n skills; and improved ability to work in groups. In relation to remaining three items, the observed proportions of satis- fied students were significantly higher under PES in comparison to those under SES. These items were: con- sultation and advise opportunity by instructors; stimulat-  A Comparative Appraisal of Timings for Program Evaluation Survey and Related Institutional Results in Saudi Arabia: Quality Management in Higher Education Copyright © 2011 SciRes. JSSM 188 ing interest in fu rther learning; an d knowledg e & skill for future career. There were nine additional items (Table 2) in PES. Students had agreement with each of them. It ranged from 19% to 62%. These items were: adequate academic & career counseling; inspiration to do best by instructor; helpful feedback from instructors; instructors’ thorough knowledgeable of subject areas; enthusiastic instructors; up-to-date and useful study material; effective field ex- perience programs; developed knowledge and skill for chosen career; and also the overall satisfaction with the quality of learning experiences at the University of Dammam. Out of the additional seven items under SES (Table 2), apart from two items (namely helpful orientation week; and helpful library staff), students failed to agree on the remaining items. These items were: easy to find informa- tion about University; simple and efficient procedure for enrolling in courses; convenient opening timing of li- brary; faculty are fair in their treatment of students; and, also the overall satisfaction as a student at the Univ ersity of Dammam. 4. Summary and Conclusions PES & SES are both program evaluation surveys. On one hand, once the students complete an academic program, PES tries to capture their experiences on specific items related to that program. On the other hand, SES tries to capture experiences of students on specific items related to an academic program, immediately after they com- plete half-period of that program [2]. Apart from varying timings of surveys and number of involved items, they were both, essentially, program evaluations. But, for the sake of easier differentiation and clarity in management, they have been named differently. As described earlier, this university has a unique set- ting of presently using both program evaluations. The two pertinent questionnaires have 13 items in common. Further, PES has nine additional items whereas SES has seven. The additional PES items (Table 2) mainly relate to various academic attributes in faculty; field experience (internship, practicum, cooperative training); knowledge and skills for chosen career; and also overall satisfaction with the quality of learning experiences at the UoD. On the other hand, the ad ditional SES items (Table 2) relate to mainly initial stage of program development. Th ey are related to admission, orientation, course enrollment; li- brary staff an d its opening time; treat ment of studen ts by faculty; and also overall satisfaction as a student at the UoD. Although it may be useful to have more information, especially during developing phase of a program, keep- ing in view of the almost comparable results related to 13 common items in PES & SES, one may argue against repeated use of both program evaluation tools. This view is more applicable to programs which become fully es- tablished. To support it further, the results on additional SES items clearly relate to initial stages of the program development. There may not be much utility in repeated surveys to capture data on these aspects. Most of these items need to be managed at the level of academic pro- gram developers. But, most of the additional PES items need occasional follows up so that related process can be meaningfully monitored, especially among faculty for further improvements. The observations made in the present study might also be useful to other institutions having similar environ- ments, especially those wo rking for quality and academic accreditation in higher education. 5. Limitations This study is limited to only one college of this univer- sity with its specific environment. Also, the considered academic program involves comparatively a small num- ber of students. To ensure appropriate generalizability of the results even in similar environment, a program in- volving larger number of students would be a better choice. Hence, one needs to be careful while generalizing these results. 6. Future Research Each college as well as program involves varying envi- ronment [2]. Thus, each college requires such evaluations in relation to each of its academic programs. The feed- back from students regarding an academic program is unavoidable especially when it is early phase of devel- opments. The meaningful clues derived from such evaluations may be helpful to the policy planners in managing sustainab le high quality in higher education. 7. Acknowledgements The author is thankful to Professor Lade Wosornu and Dr Sada Nand Dwivedi, Deanship of Quality & Academic Accreditation (DQAA), University of Dammam [UoD], for their help in completion of this article. He is equally thankful to Dr Fahad A. Al-Harbi, Dean, College of Den- tistry; and Dr Sarfaraj Akhtar, Quality Management Of- ficer, Q & P Unit, College of Dentistry, for their help and cooperation in data collection. Also, helps from Mr. R. Somasundaram, Mr Arun Vijay, & Mr C. C. L. Raymond, DQAA, UoD, in this regard are duly acknowledged. He is equally thankful to Mr Royes Joseph, DQAA, UoD, for his help in analysis. Finally, he also thanks to all stu- dents for their mature, balan ced and objective response.  A Comparative Appraisal of Timings for Program Evaluation Survey and Related Institutional Results in Saudi Arabia: Quality Management in Higher Education Copyright © 2011 SciRes. JSSM 189 REFERENCES [1] P. Gravestock and E. Gregor-Greenleaf, “Student Course Evaluations: Research, Models and Trends,” Higher Edu- cation Quality Council of Ontario, Toronto, 2008. [2] A. Al Rubaish, “On the Contribution of Student Experi- ence Survey Regarding Quality Management in Higher Education: An Institutional Study in Saudi Arabia,” Journal of Service Science and Management, Vol. 3, No. 4, 2010, pp. 464-469. [3] L. P. Aultman, “An Expected Benefit of Formative Stu- dent Evaluations ,” Co llege Teaching , V ol . 5 4, No . 3 , 2006, p. 251. doi:10.3200/CTCH.54.3.251-285 [4] T. Beran, C. Violato and D. Kline, “What’s the ‘Use’ of Student Ratings of Instruction for Administrators? One University’s Experience,” Canadian Journal of Higher Educatuon, Vol. 35, No.2, 2007, pp. 48-70. [5] L. A. Braskamp and J. C. Ory , “Assessing Faculty Work: Enhancing Individual and Institutional Performance,” Jossey-Ba ss, San Francisco, 1994. [6] J. P. Campbell and W. C. Bozeman, “The Value of Stu- dent Ratings: Perceptions of Students, Teachers and Ad- ministrators,” Community College Journal of Research and Practice, Vol. 32, No. 1, 2008, pp. 13-24. doi:10.1080/10668920600864137 [7] W. E. Cashin and R. G. Downey, “Using Global Student Rating Items for Summative Evaluation,” Journal of Edu- cational Psychology, Vol. 84, No. 4, 1992, pp. 563-572. doi:10.1037/0022-0663.84.4.563 [8] M. R. Diamond, “The Usefulness of Structured Mid-Term Feedback as a Catalyst for Change in Higher Education Classes,” Active Learning in Higher Education, vol. 5, No. 3, 2004, pp. 217-231. doi:10.1177/1469787404046845 [9] L. C. Hodges and K. Stanton, “Translating Comments on Student Evaluations into Language of Learning,” Innova- tive Higher Education, Vol. 31, No. 5, 2007, 279-286. doi:10.1007/s10755-006-9027-3 [10] J. W. B. Lang and M. Kersting, “Regular Feedback from Student Ratings of Instruction: Do College Teachers Im- prove Their Ratings in the Long Run?” Instructional Sci- ence, Vol. 35, No. 3, 2007, 187-205. doi:10.1007/s11251-006-9006-1 [11] H. W. Marsh, “Do University Teachers become More Effective with Experience? A Multilevel Growth Model of Students’ Evaluations of Teaching over 13 Years,” Journal of Educational Psychology, Vol. 99, No. 4, 2007, pp. 775-790. doi:10.1037/0022-0663.99.4.775 [12] R. J. Menges, “Shortcomings of Research on Evaluating and Improving Teaching in Higher Education,” In: K. E. Ryan Ed., Evaluating Teaching in Higher Education: A Vision for the Future, New Directions for Teaching and Learning, Vol. 83, 2000, pp. 5-11. [13] A. R. Penny and R. Coe, “Effectiveness of Consultations on Student Ratings Feedback: A meta-analysis,” Review of Educational Research, Vol. 74, No. 2, 2004, pp. 215-253.doi:10.3102/00346543074002215 [14] R. E. Wright, “Student Evaluations of Faculty: Concerns Raised in the Literature, and Possible Solutions,” College Student Journal, Vol. 40, No. 2, 2008, pp. 417-422. [15] F. Zabaleta, “The Use and Misuse of Student Evaluation of Teaching,” Teaching in Higher Education, Vol. 12, No. 1, 2007, pp. 55-76.doi:10.1080/13562510601102131 [16] A. S. Aldosary, “Students’ Academic Satisfaction: The Case of CES at KFUPM,” JKAU: Engeering Science, Vol. 11, No. 1, 1999, pp. 99-107. [17] Mantz Yorke, “’Student Experience’ Surveys: Some Methodological Considerations and an Empirical Investi- gation,” Assessment & Evaluation in Higher Education, Vol. 34, No. 6, 2009, pp. 721-739. doi:10.1080/02602930802474219 [18] W. J. McKeachie, “Students Ratings: The Validity of Use,” American Psychologist, Vol. 51, No. 11, 1997, pp. 1218-1225.doi:10.1037/0003-066X.52.11.1218 [19] M. Theall and J. Franklin, “Looking For Bias in All the Wrong Places: A Search for Truth or a Witch Hunt In Student Ratings Of Instruction? In: M. Theall, P. C. Abrami and L. A. Mets, Eds., The Student Ratings Debate: Are They Valid? How Can We Best Use Them? New Di- rections for Institutional Research, Vol. 109, 2001, pp. 45-46. [20] W. E. Cashin, “Students Do Rate Different Academic Fields Differently. In M. Theall and J. Franklin, Eds., Student Ratings of Instruction: Issues for Improving Practice, New Directions for Teaching and Learning, Vol. 43, 1990, pp. 113-121. [21] R. Gob, C. McCollin and M. F. Rmalhoto, “Ordinal Methodology in the Analysis of Likert Scales,” Qualilty & Quantity, Vol. 41, No. 5, 2007, pp. 601-626. doi:10.1007/s11135-007-9089-z [22] A. Al Rubaish, L. Wosornu and S. N. Dwivedi, “Using Deductions from Assessment Studies towards Further- ance of the Academic Program: An Empirical Appraisal of an Institutional Student Course Evaluations,” Journal of Service Science and Management, Vol. 3, No. 4, 2010, pp. 464-469. [23] K. R. Sundaram, S. N. Dwivedi and V. Sreenivas, “Medi- cal Statistics: Principles & Methods,” BI Publications Pvt. Ltd., New Delhi, 2009.  A Comparative Appraisal of Timings for Program Evaluation Survey and Related Institutional Results in Saudi Arabia: Quality Management in Higher Education Copyright © 2011 SciRes. JSSM 190 Appendix 1: Program Evaluation Survey Questionnaire Items: 1) Adequate academic and career coun selling was available for me throughout the program. 2) The instructors were available for consultatio n and advice when I needed to speak with them. 3) The instructors in the program insp ired me to do my best. 4) The instructors in the program gave me helpful feedback on my work. 5) The instructors in the program had thoroug h knowledge of the content of the courses they taught. 6) The instructors were enthusiastic about the program. 7) The instructors cared about the progress of their students. 8) What I have learned in this program will be valuable for my future. 9) Study materials in courses were up-to-date and useful. 10) Library resources were adequate and available when I needed them. 11) Classroom facilities (for lectures, laboratories, tutorials etc) were of good quality. 12) Student computing facilities were sufficient for my needs. 13) Adequate facilities were available for extracurricular activities (including sporting and recreational activities). 14) Adequate facilities were available for religious observances. 15) Field experience programs (internship, practicum, cooperative training) were effective in developing my skills. (Omit this item if not applicable to your pr ogram). 16) As a result of this program I have developed sufficient interest to want to continue to keep up to date with new developments in my field of study. 17) The program developed my ability to investigate and solve new problems. 18) The program improved my ability to work effectively in groups. 19) The program improved my sk ills in communication. 20) I have developed good basic skills in using technology to investigate issues and communicate results. 21) I am confident that I have developed the knowledge and skills required for my chosen career. 22) Overall, I was satisfied with the quality of my learning experiences at this institution. |