

Paper Menu >>
Journal Menu >>
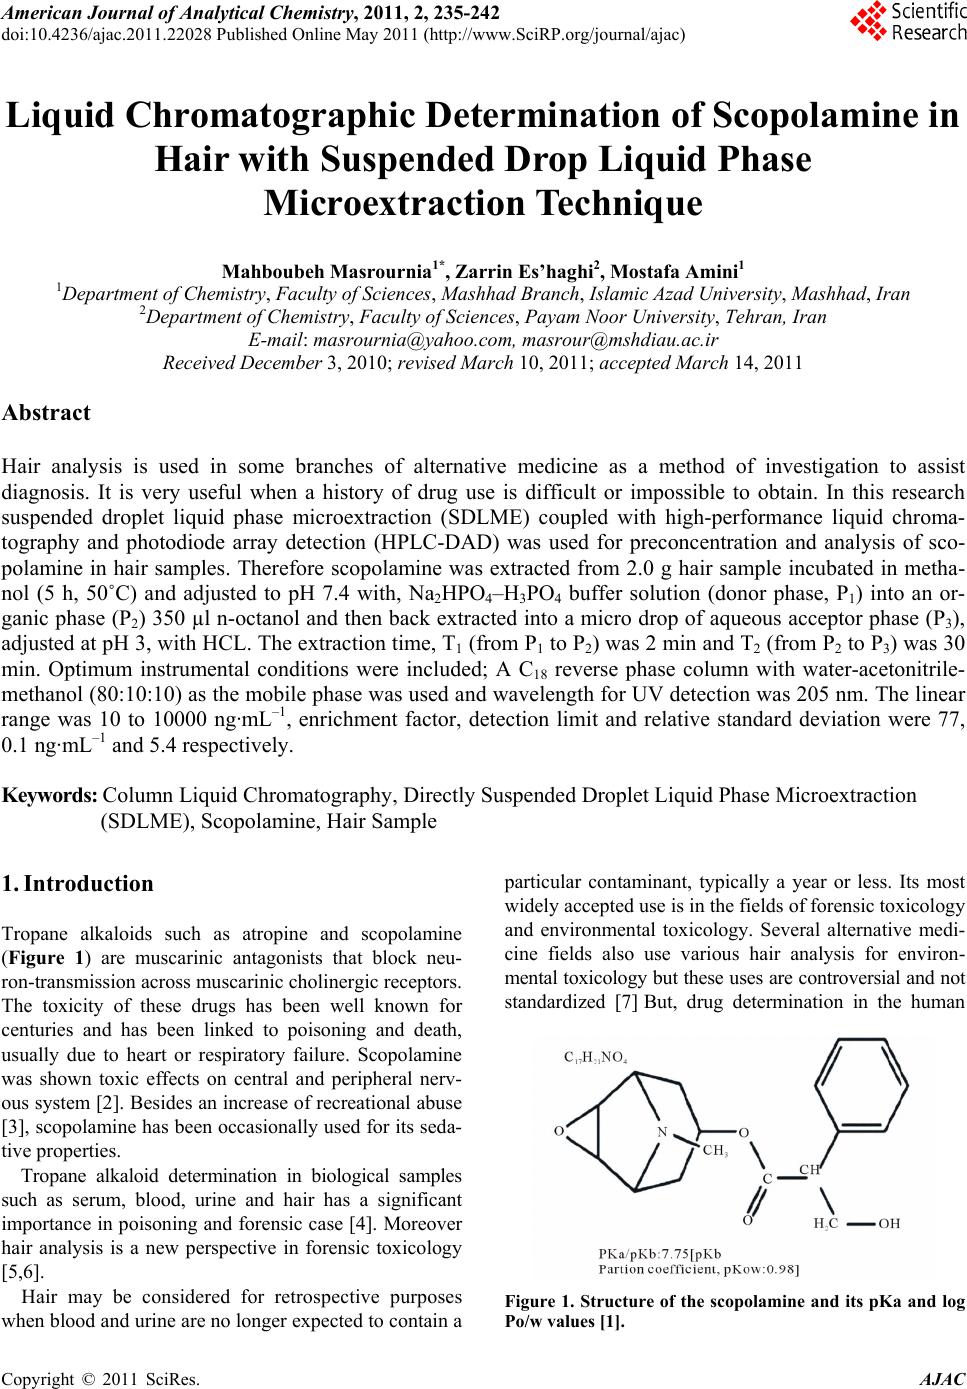 American Journal of Anal yt ical Chemistry, 2011, 2, 235-242 doi:10.4236/ajac.2011.22028 Published Online May 2011 (http://www.SciRP.org/journal/ajac) Copyright © 2011 SciRes. AJAC Liquid Chromatographic Determination of Scopolamine in Hair with Suspended Drop Liquid Phase Microextraction Technique Mahboubeh Masrournia1*, Zarrin Es’haghi2, Mostafa Amini1 1Department of Chemistry, Faculty of Sciences, Mashhad Branch, Islamic Azad University, Mashhad, Iran 2Department of Chemistry, Faculty of Sciences, Payam Noor University, Tehran, Iran E-mail: [email protected], [email protected] Received December 3, 2010; revised March 10, 2011; accepted March 14, 2011 Abstract Hair analysis is used in some branches of alternative medicine as a method of investigation to assist diagnosis. It is very useful when a history of drug use is difficult or impossible to obtain. In this research suspended droplet liquid phase microextraction (SDLME) coupled with high-performance liquid chroma- tography and photodiode array detection (HPLC-DAD) was used for preconcentration and analysis of sco- polamine in hair samples. Therefore scopolamine was extracted from 2.0 g hair sample incubated in metha- nol (5 h, 50˚C) and adjusted to pH 7.4 with, Na2HPO4–H3PO4 buffer solution (donor phase, P1) into an or- ganic phase (P2) 350 µl n-octanol and then back extracted into a micro drop of aqueous acceptor phase (P3), adjusted at pH 3, with HCL. The extraction time, T1 (from P1 to P2) was 2 min and T2 (from P2 to P3) was 30 min. Optimum instrumental conditions were included; A C18 reverse phase column with water-acetonitrile- methanol (80:10:10) as the mobile phase was used and wavelength for UV detection was 205 nm. The linear range was 10 to 10000 ng·mL–1, enrichment factor, detection limit and relative standard deviation were 77, 0.1 ng·mL–1 and 5.4 respectively. Keywords: Column Liquid Chromatography, Directly Suspended Droplet Liquid Phase Microextraction (SDLME), Scopolamine, Hair Sample 1. Introduction Tropane alkaloids such as atropine and scopolamine (Figure 1) are muscarinic antagonists that block neu- ron-transmission across muscarinic cholinergic receptors. The toxicity of these drugs has been well known for centuries and has been linked to poisoning and death, usually due to heart or respiratory failure. Scopolamine was shown toxic effects on central and peripheral nerv- ous system [2]. Besides an increase of recreational abuse [3], scopolamine has been occasionally used for its seda- tive properties. Tropane alkaloid determination in biological samples such as serum, blood, urine and hair has a significant importance in poisoning and forensic case [4]. Moreover hair analysis is a new perspective in forensic toxicology [5,6]. Hair may be considered for retrospective purposes when blood and urine are no longer expected to contain a particular contaminant, typically a year or less. Its most widely accepted use is in the fields of forensic toxicology and environmental toxicology. Several alternative medi- cine fields also use various hair analysis for environ- mental toxicology but these uses are controversial and not standardized [7] But, drug determination in the human Figure 1. Structure of the scopolamine and its pKa and log Po/w values [1]. 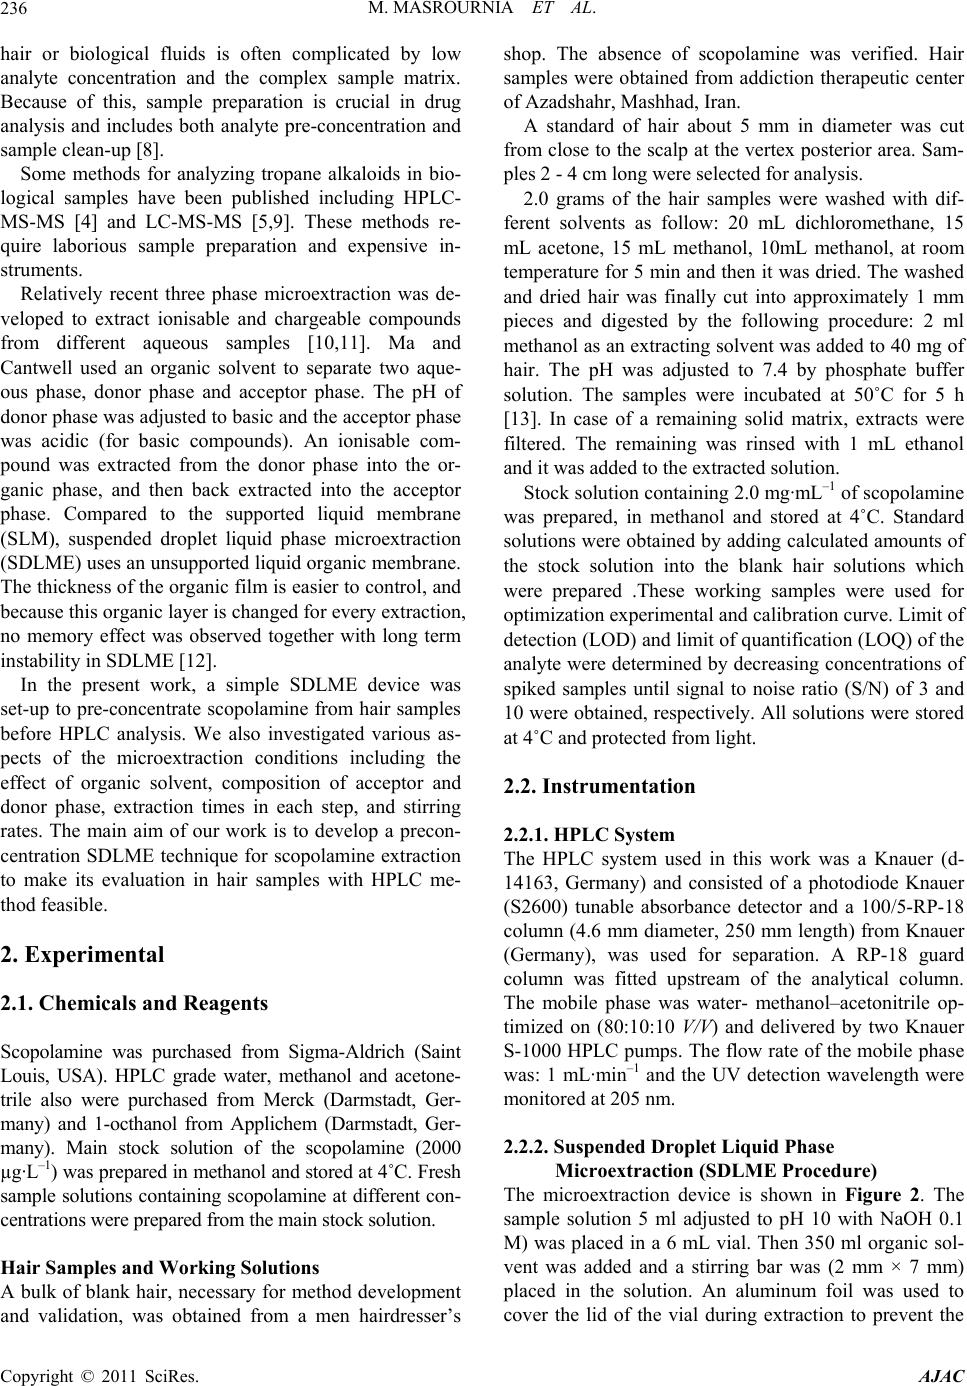 M. MASROURNIA ET AL. 236 hair or biological fluids is often complicated by low analyte concentration and the complex sample matrix. Because of this, sample preparation is crucial in drug analysis and includes both analyte pre-concentration and sample clean-up [8]. Some methods for analyzing tropane alkaloids in bio- logical samples have been published including HPLC- MS-MS [4] and LC-MS-MS [5,9]. These methods re- quire laborious sample preparation and expensive in- struments. Relatively recent three phase microextraction was de- veloped to extract ionisable and chargeable compounds from different aqueous samples [10,11]. Ma and Cantwell used an organic solvent to separate two aque- ous phase, donor phase and acceptor phase. The pH of donor phase was adjusted to basic and the acceptor phase was acidic (for basic compounds). An ionisable com- pound was extracted from the donor phase into the or- ganic phase, and then back extracted into the acceptor phase. Compared to the supported liquid membrane (SLM), suspended droplet liquid phase microextraction (SDLME) uses an unsupported liquid organic membrane. The thickness of the organic film is easier to control, and because this organic layer is changed for every extraction, no memory effect was observed together with long term instability in SDLME [12]. In the present work, a simple SDLME device was set-up to pre-concentrate scopolamine from hair samples before HPLC analysis. We also investigated various as- pects of the microextraction conditions including the effect of organic solvent, composition of acceptor and donor phase, extraction times in each step, and stirring rates. The main aim of our work is to develop a precon- centration SDLME technique for scopolamine extraction to make its evaluation in hair samples with HPLC me- thod feasible. 2. Experimental 2.1. Chemicals and Reagents Scopolamine was purchased from Sigma-Aldrich (Saint Louis, USA). HPLC grade water, methanol and acetone- trile also were purchased from Merck (Darmstadt, Ger- many) and 1-octhanol from Applichem (Darmstadt, Ger- many). Main stock solution of the scopolamine (2000 µg·L–1) was prepared in methanol and stored at 4˚C. Fresh sample solutions containing scopolamine at different con- centrations were prepared from the main stock solution. Hair Samples and Working Solutions A bulk of blank hair, necessary for method development and validation, was obtained from a men hairdresser’s shop. The absence of scopolamine was verified. Hair samples were obtained from addiction therapeutic center of Azadshahr, Mashhad, Iran. A standard of hair about 5 mm in diameter was cut from close to the scalp at the vertex posterior area. Sam- ples 2 - 4 cm long were selected for analysis. 2.0 grams of the hair samples were washed with dif- ferent solvents as follow: 20 mL dichloromethane, 15 mL acetone, 15 mL methanol, 10mL methanol, at room temperature for 5 min and then it was dried. The washed and dried hair was finally cut into approximately 1 mm pieces and digested by the following procedure: 2 ml methanol as an extracting solvent was added to 40 mg of hair. The pH was adjusted to 7.4 by phosphate buffer solution. The samples were incubated at 50˚C for 5 h [13]. In case of a remaining solid matrix, extracts were filtered. The remaining was rinsed with 1 mL ethanol and it was added to the extracted solution. Stock solution containing 2.0 mg·mL–1 of scopolamine was prepared, in methanol and stored at 4˚C. Standard solutions were obtained by adding calculated amounts of the stock solution into the blank hair solutions which were prepared .These working samples were used for optimization experimental and calibration curve. Limit of detection (LOD) and limit of quantification (LOQ) of the analyte were determined by decreasing concentrations of spiked samples until signal to noise ratio (S/N) of 3 and 10 were obtained, respectively. All solutions were stored at 4˚C and protected from light. 2.2. Instrumentation 2.2.1. HPLC System The HPLC system used in this work was a Knauer (d- 14163, Germany) and consisted of a photodiode Knauer (S2600) tunable absorbance detector and a 100/5-RP-18 column (4.6 mm diameter, 250 mm length) from Knauer (Germany), was used for separation. A RP-18 guard column was fitted upstream of the analytical column. The mobile phase was water- methanol–acetonitrile op- timized on (80:10:10 V/V) and delivered by two Knauer S-1000 HPLC pumps. The flow rate of the mobile phase was: 1 mL·min–1 and the UV detection wavelength were monitored at 205 nm. 2.2.2. Suspended Droplet Liquid Phase Microextraction (SDLME Procedure) The microextraction device is shown in Figure 2. The sample solution 5 ml adjusted to pH 10 with NaOH 0.1 M) was placed in a 6 mL vial. Then 350 ml organic sol- vent was added and a stirring bar was (2 mm × 7 mm) placed in the solution. An aluminum foil was used to cover the lid of the vial during extraction to prevent the Copyright © 2011 SciRes. AJAC 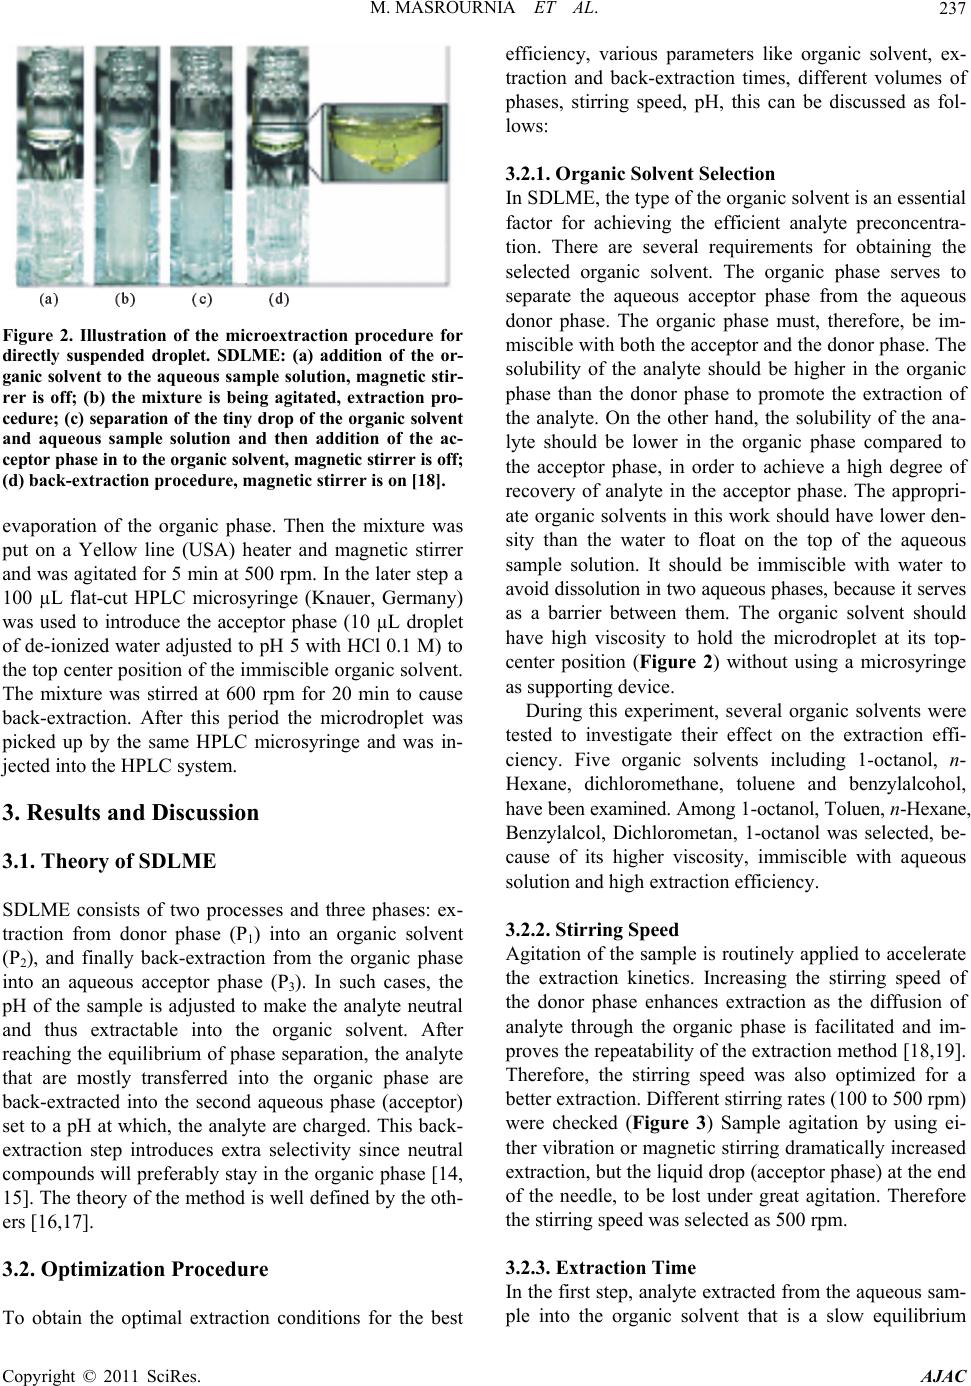 M. MASROURNIA ET AL.237 Figure 2. Illustration of the microextraction procedure for directly suspended droplet. SDLME: (a) addition of the or- ganic solvent to the aqueous sample solution, magnetic stir- rer is off; (b) the mixture is being agitated, extraction pro- cedure; (c) separation of the tiny drop of the organic solvent and aqueous sample solution and then addition of the ac- ceptor phase in to the organic solvent, magnetic stirrer is off; (d) back-extraction procedure, magnetic stirrer is on [18]. evaporation of the organic phase. Then the mixture was put on a Yellow line (USA) heater and magnetic stirrer and was agitated for 5 min at 500 rpm. In the later step a 100 µL flat-cut HPLC microsyringe (Knauer, Germany) was used to introduce the acceptor phase (10 µL droplet of de-ionized water adjusted to pH 5 with HCl 0.1 M) to the top center position of the immiscible organic solvent. The mixture was stirred at 600 rpm for 20 min to cause back-extraction. After this period the microdroplet was picked up by the same HPLC microsyringe and was in- jected into the HPLC system. 3. Results and Discussion 3.1. Theory of SDLME SDLME consists of two processes and three phases: ex- traction from donor phase (P1) into an organic solvent (P2), and finally back-extraction from the organic phase into an aqueous acceptor phase (P3). In such cases, the pH of the sample is adjusted to make the analyte neutral and thus extractable into the organic solvent. After reaching the equilibrium of phase separation, the analyte that are mostly transferred into the organic phase are back-extracted into the second aqueous phase (acceptor) set to a pH at which, the analyte are charged. This back- extraction step introduces extra selectivity since neutral compounds will preferably stay in the organic phase [14, 15]. The theory of the method is well defined by the oth- ers [16,17]. 3.2. Optimization Procedure To obtain the optimal extraction conditions for the best efficiency, various parameters like organic solvent, ex- traction and back-extraction times, different volumes of phases, stirring speed, pH, this can be discussed as fol- lows: 3.2.1. Organic Solvent Selection In SDLME, the type of the organic solvent is an essential factor for achieving the efficient analyte preconcentra- tion. There are several requirements for obtaining the selected organic solvent. The organic phase serves to separate the aqueous acceptor phase from the aqueous donor phase. The organic phase must, therefore, be im- miscible with both the acceptor and the donor phase. The solubility of the analyte should be higher in the organic phase than the donor phase to promote the extraction of the analyte. On the other hand, the solubility of the ana- lyte should be lower in the organic phase compared to the acceptor phase, in order to achieve a high degree of recovery of analyte in the acceptor phase. The appropri- ate organic solvents in this work should have lower den- sity than the water to float on the top of the aqueous sample solution. It should be immiscible with water to avoid dissolution in two aqueous phases, because it serves as a barrier between them. The organic solvent should have high viscosity to hold the microdroplet at its top- center position (Figure 2) without using a microsyringe as supporting device. During this experiment, several organic solvents were tested to investigate their effect on the extraction effi- ciency. Five organic solvents including 1-octanol, n- Hexane, dichloromethane, toluene and benzylalcohol, have been examined. Among 1-octanol, Toluen, n-Hexane, Benzylalcol, Dichlorometan, 1-octanol was selected, be- cause of its higher viscosity, immiscible with aqueous solution and high extraction efficiency. 3.2.2. Stirring Speed Agitation of the sample is routinely applied to accelerate the extraction kinetics. Increasing the stirring speed of the donor phase enhances extraction as the diffusion of analyte through the organic phase is facilitated and im- proves the repeatability of the extraction method [18,19]. Therefore, the stirring speed was also optimized for a better extraction. Different stirring rates (100 to 500 rpm) were checked (Figure 3) Sample agitation by using ei- ther vibration or magnetic stirring dramatically increased extraction, but the liquid drop (acceptor phase) at the end of the needle, to be lost under great agitation. Therefore the stirring speed was selected as 500 rpm. 3.2.3. Extraction Time In the first step, analyte extracted from the aqueous sam- ple into the organic solvent that is a slow equilibrium Copyright © 2011 SciRes. AJAC 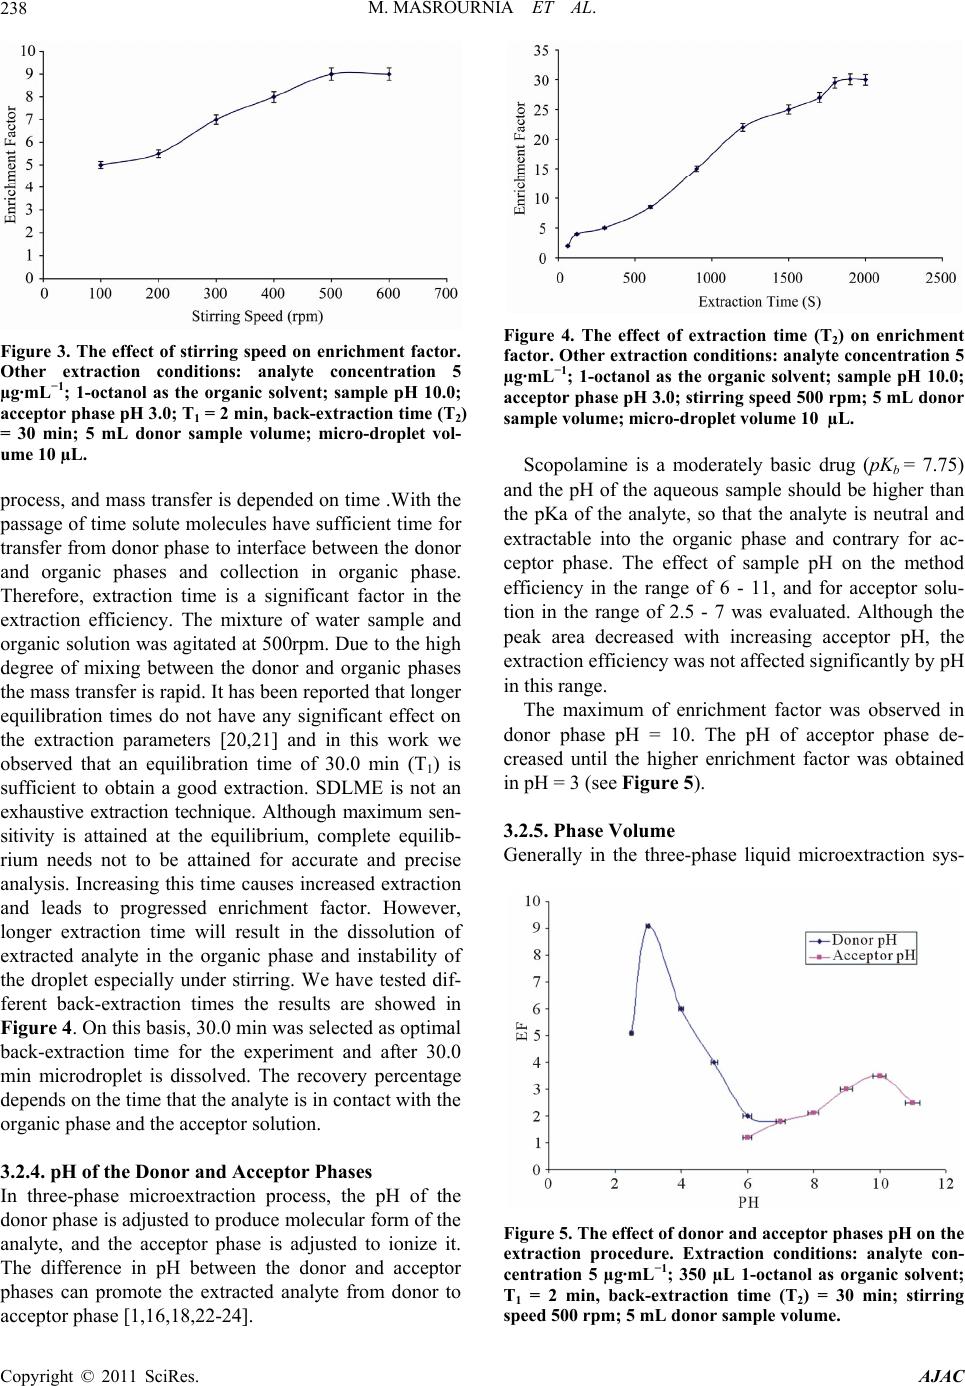 M. MASROURNIA ET AL. 238 Figure 3. The effect of stirring speed on enrichment factor. Other extraction conditions: analyte concentration 5 µg·mL−1; 1-octanol as the organic solvent; sample pH 10.0; acceptor phase pH 3.0; T1 = 2 min, back-extraction time (T2) = 30 min; 5 mL donor sample volume; micro-droplet vol- ume 10 µL. process, and mass transfer is depended on time .With the passage of time solute molecules have sufficient time for transfer from donor phase to interface between the donor and organic phases and collection in organic phase. Therefore, extraction time is a significant factor in the extraction efficiency. The mixture of water sample and organic solution was agitated at 500rpm. Due to the high degree of mixing between the donor and organic phases the mass transfer is rapid. It has been reported that longer equilibration times do not have any significant effect on the extraction parameters [20,21] and in this work we observed that an equilibration time of 30.0 min (T1) is sufficient to obtain a good extraction. SDLME is not an exhaustive extraction technique. Although maximum sen- sitivity is attained at the equilibrium, complete equilib- rium needs not to be attained for accurate and precise analysis. Increasing this time causes increased extraction and leads to progressed enrichment factor. However, longer extraction time will result in the dissolution of extracted analyte in the organic phase and instability of the droplet especially under stirring. We have tested dif- ferent back-extraction times the results are showed in Figure 4. On this basis, 30.0 min was selected as optimal back-extraction time for the experiment and after 30.0 min microdroplet is dissolved. The recovery percentage depends on the time that the analyte is in contact with the organic phase and the acceptor solution. 3.2.4. pH of the Donor and Acceptor Phases In three-phase microextraction process, the pH of the donor phase is adjusted to produce molecular form of the analyte, and the acceptor phase is adjusted to ionize it. The difference in pH between the donor and acceptor phases can promote the extracted analyte from donor to acceptor phase [1,16,18,22-24]. Figure 4. The effect of extraction time (T2) on enrichment factor. Other extraction conditions: analyte concentration 5 µg·mL−1; 1-octanol as the organic solvent; sample pH 10.0; acceptor phase pH 3.0; stirring speed 500 rpm; 5 mL donor sample volume; micro-droplet volume 10 µL. Scopolamine is a moderately basic drug (pKb = 7.75) and the pH of the aqueous sample should be higher than the pKa of the analyte, so that the analyte is neutral and extractable into the organic phase and contrary for ac- ceptor phase. The effect of sample pH on the method efficiency in the range of 6 - 11, and for acceptor solu- tion in the range of 2.5 - 7 was evaluated. Although the peak area decreased with increasing acceptor pH, the extraction efficiency was not affected significantly by pH in this range. The maximum of enrichment factor was observed in donor phase pH = 10. The pH of acceptor phase de- creased until the higher enrichment factor was obtained in pH = 3 (see Figure 5). 3.2.5. Phase Volume Generally in the three-phase liquid microextraction sys- Figure 5. The effect of donor and acceptor phases pH on the extraction procedure. Extraction conditions: analyte con- centration 5 µg·mL−1; 350 µL 1-octanol as organic solvent; T1 = 2 min, back-extraction time (T2) = 30 min; stirring speed 500 rpm; 5 mL donor sample volume. Copyright © 2011 SciRes. AJAC 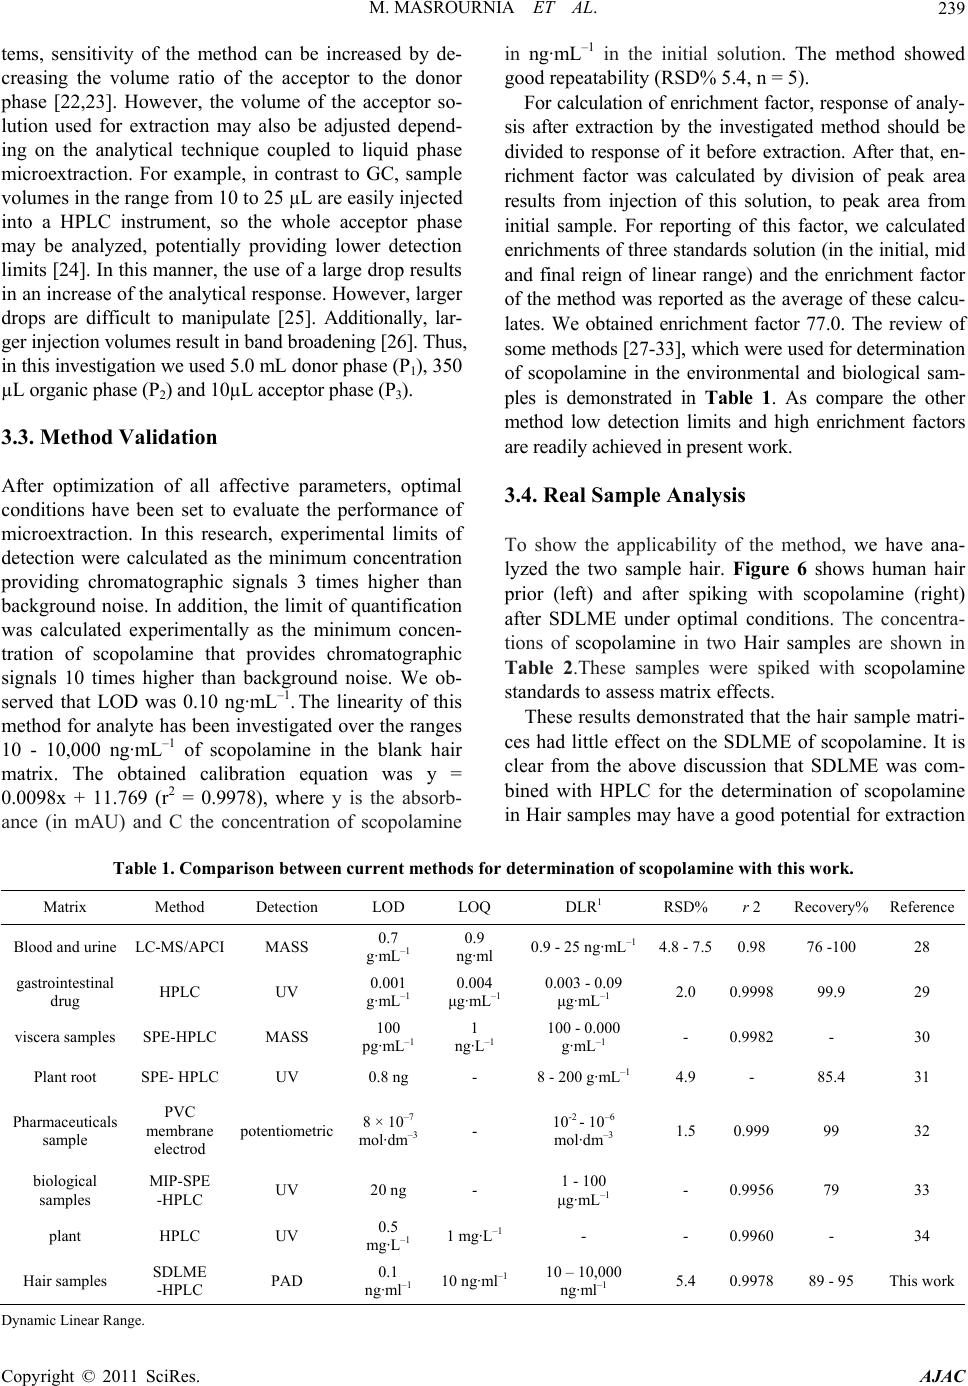 M. MASROURNIA ET AL. Copyright © 2011 SciRes. AJAC 239 tems, sensitivity of the method can be increased by de- creasing the volume ratio of the acceptor to the donor phase [22,23]. However, the volume of the acceptor so- lution used for extraction may also be adjusted depend- ing on the analytical technique coupled to liquid phase microextraction. For example, in contrast to GC, sample volumes in the range from 10 to 25 µL are easily injected into a HPLC instrument, so the whole acceptor phase may be analyzed, potentially providing lower detection limits [24]. In this manner, the use of a large drop results in an increase of the analytical response. However, larger drops are difficult to manipulate [25]. Additionally, lar- ger injection volumes result in band broadening [26]. Thus, in this investigation we used 5.0 mL donor phase (P1), 350 µL organic phase (P2) and 10µL acceptor phase (P3). 3.3. Method Validation After optimization of all affective parameters, optimal conditions have been set to evaluate the performance of microextraction. In this research, experimental limits of detection were calculated as the minimum concentration providing chromatographic signals 3 times higher than background noise. In addition, the limit of quantification was calculated experimentally as the minimum concen- tration of scopolamine that provides chromatographic signals 10 times higher than background noise. We ob- served that LOD was 0.10 ng·mL–1. The linearity of this method for analyte has been investigated over the ranges 10 - 10,000 ng·mL–1 of scopolamine in the blank hair matrix. The obtained calibration equation was y = 0.0098x + 11.769 (r2 = 0.9978), where y is the absorb- ance (in mAU) and C the concentration of scopolamine in ng·mL–1 in the initial solution. The method showed good repeatability (RSD% 5.4, n = 5). For calculation of enrichment factor, response of analy- sis after extraction by the investigated method should be divided to response of it before extraction. After that, en- richment factor was calculated by division of peak area results from injection of this solution, to peak area from initial sample. For reporting of this factor, we calculated enrichments of three standards solution (in the initial, mid and final reign of linear range) and the enrichment factor of the method was reported as the average of these calcu- lates. We obtained enrichment factor 77.0. The review of some methods [27-33], which were used for determination of scopolamine in the environmental and biological sam- ples is demonstrated in Table 1. As compare the other method low detection limits and high enrichment factors are readily achieved in present work. 3.4. Real Sample Analysis To show the applicability of the method, we have ana- lyzed the two sample hair. Figure 6 shows human hair prior (left) and after spiking with scopolamine (right) after SDLME under optimal conditions. The concentra- tions of scopolamine in two Hair samples are shown in Table 2.These samples were spiked with scopolamine standards to assess matrix effects. These results demonstrated that the hair sample matri- ces had little effect on the SDLME of scopolamine. It is clear from the above discussion that SDLME was com- bined with HPLC for the determination of scopolamine in Hair samples may have a good potential for extraction Table 1. Comparison between current methods for determination of scopolamine with this work. Matrix Method Detection LOD LOQ DLR1 RSD%r 2 Recovery% Reference Blood and urine LC-MS/APCI MASS 0.7 g·mL–1 0.9 ng·ml 0.9 - 25 ng·mL–1 4.8 - 7.50.98 76 -100 28 gastrointestinal drug HPLC UV 0.001 g·mL–1 0.004 μg·mL–1 0.003 - 0.09 μg·mL–1 2.0 0.9998 99.9 29 viscera samples SPE-HPLC MASS 100 pg·mL–1 1 ng·L–1 100 - 0.000 g·mL–1 - 0.9982 - 30 Plant root SPE- HPLC UV 0.8 ng - 8 - 200 g·mL–1 4.9 - 85.4 31 Pharmaceuticals sample PVC membrane electrod potentiometric 8 × 10⁻⁷ mol·dm–3 - 10-2 - 10–6 mol·dm–3 1.5 0.999 99 32 biological samples MIP-SPE -HPLC UV 20 ng - 1 - 100 μg·mL–1 - 0.9956 79 33 plant HPLC UV 0.5 mg·L–1 1 mg·L–1 - - 0.9960 - 34 Hair samples SDLME -HPLC PAD 0.1 ng·ml–1 10 ng·ml–1 10 – 10,000 ng·ml–1 5.4 0.9978 89 - 95 This work Dynamic Linear Range. 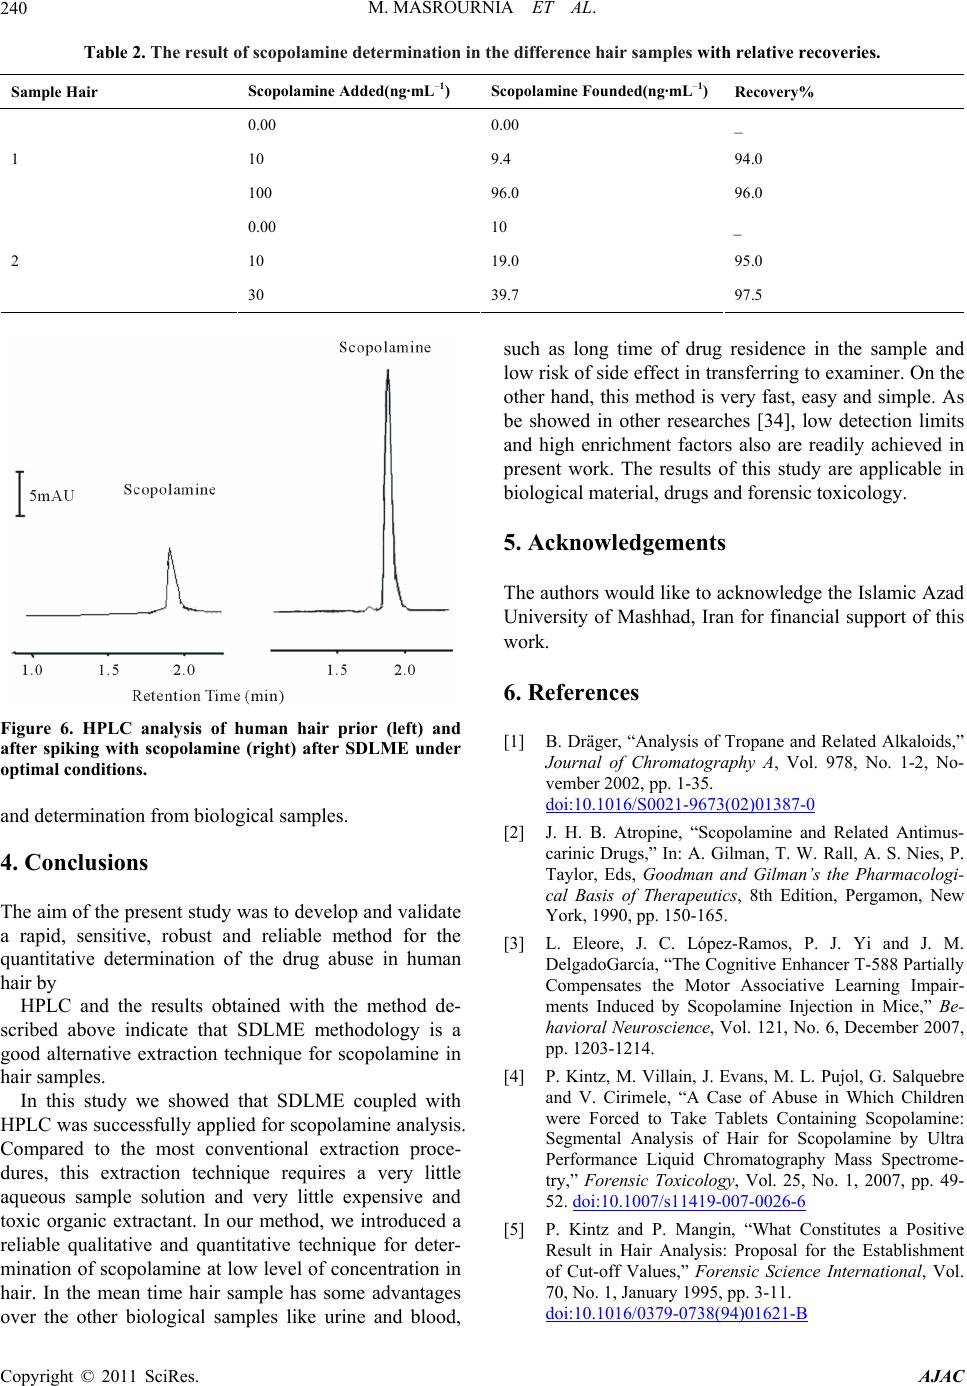 M. MASROURNIA ET AL. 240 Table 2. The result of scopolamine determination in the difference hair samples with relative recoveries. Recovery% Scopolamine Founded(ng·mL–1)Scopolamine Added(ng·mL–1) Sample Hair _ 0.00 0.00 94.0 9.4 10 96.0 96.0 100 1 _ 10 0.00 95.0 19.0 10 97.5 39.7 30 2 Figure 6. HPLC analysis of human hair prior (left) and after spiking with scopolamine (right) after SDLME under optimal conditions. and determination from biological samples. 4. Conclusions The aim of the present study was to develop and validate a rapid, sensitive, robust and reliable method for the quantitative determination of the drug abuse in human hair by HPLC and the results obtained with the method de- scribed above indicate that SDLME methodology is a good alternative extraction technique for scopolamine in hair samples. In this study we showed that SDLME coupled with HPLC was successfully applied for scopolamine analysis. Compared to the most conventional extraction proce- dures, this extraction technique requires a very little aqueous sample solution and very little expensive and toxic organic extractant. In our method, we introduced a reliable qualitative and quantitative technique for deter- mination of scopolamine at low level of concentration in hair. In the mean time hair sample has some advantages over the other biological samples like urine and blood, such as long time of drug residence in the sample and low risk of side effect in transferring to examiner. On the other hand, this method is very fast, easy and simple. As be showed in other researches [34], low detection limits and high enrichment factors also are readily achieved in present work. The results of this study are applicable in biological material, drugs and forensic toxicology. 5. Acknowledgements The authors would like to acknowledge the Islamic Azad University of Mashhad, Iran for financial support of this work. 6. References [1] B. Dräger, “Analysis of Tropane and Related Alkaloids,” Journal of Chromatography A, Vol. 978, No. 1-2, No- vember 2002, pp. 1-35. doi:10.1016/S0021-9673(02)01387-0 [2] J. H. B. Atropine, “Scopolamine and Related Antimus- carinic Drugs,” In: A. Gilman, T. W. Rall, A. S. Nies, P. Taylor, Eds, Goodman and Gilman’s the Pharmacologi- cal Basis of Therapeutics, 8th Edition, Pergamon, New York, 1990, pp. 150-165. [3] L. Eleore, J. C. López-Ramos, P. J. Yi and J. M. DelgadoGarcía, “The Cognitive Enhancer T-588 Partially Compensates the Motor Associative Learning Impair- ments Induced by Scopolamine Injection in Mice,” Be- havioral Neuroscience, Vol. 121, No. 6, December 2007, pp. 1203-1214. [4] P. Kintz, M. Villain, J. Evans, M. L. Pujol, G. Salquebre and V. Cirimele, “A Case of Abuse in Which Children were Forced to Take Tablets Containing Scopolamine: Segmental Analysis of Hair for Scopolamine by Ultra Performance Liquid Chromatography Mass Spectrome- try,” Forensic Toxicology, Vol. 25, No. 1, 2007, pp. 49- 52. doi:10.1007/s11419-007-0026-6 [5] P. Kintz and P. Mangin, “What Constitutes a Positive Result in Hair Analysis: Proposal for the Establishment of Cut-off Values,” Forensic Science International, Vol. 70, No. 1, January 1995, pp. 3-11. doi:10.1016/0379-0738(94)01621-B Copyright © 2011 SciRes. AJAC 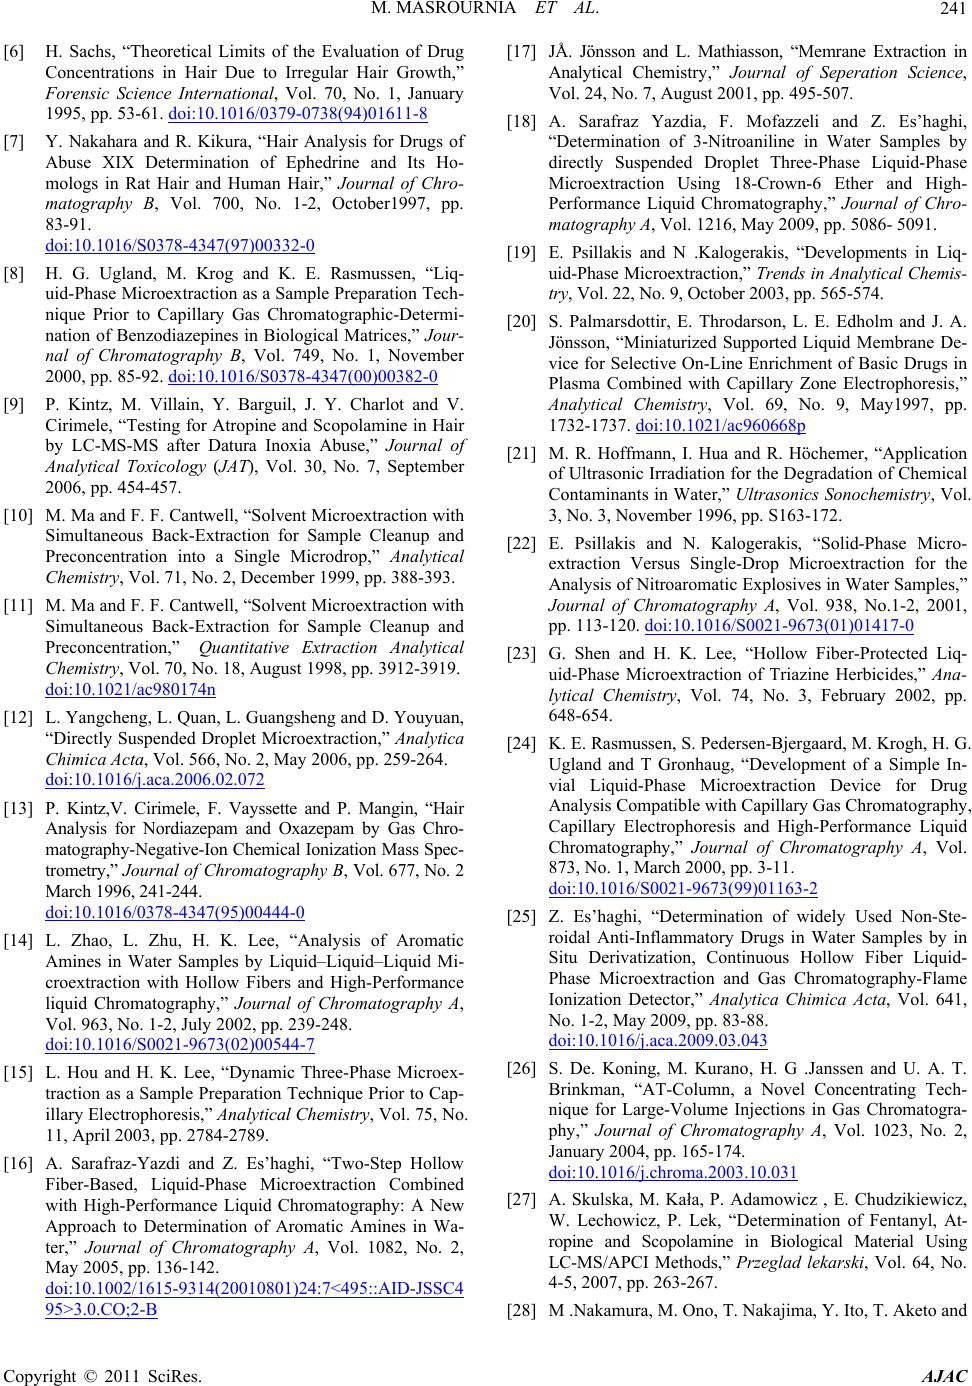 M. MASROURNIA ET AL.241 [6] H. Sachs, “Theoretical Limits of the Evaluation of Drug Concentrations in Hair Due to Irregular Hair Growth,” Forensic Science International, Vol. 70, No. 1, January 1995, pp. 53-61. doi:10.1016/0379-0738(94)01611-8 [7] Y. Nakahara and R. Kikura, “Hair Analysis for Drugs of Abuse XIX Determination of Ephedrine and Its Ho- mologs in Rat Hair and Human Hair,” Journal of Chro- matography B, Vol. 700, No. 1-2, October1997, pp. 83-91. doi:10.1016/S0378-4347(97)00332-0 [8] H. G. Ugland, M. Krog and K. E. Rasmussen, “Liq- uid-Phase Microextraction as a Sample Preparation Tech- nique Prior to Capillary Gas Chromatographic-Determi- nation of Benzodiazepines in Biological Matrices,” Jour- nal of Chromatography B, Vol. 749, No. 1, November 2000, pp. 85-92. doi:10.1016/S0378-4347(00)00382-0 [9] P. Kintz, M. Villain, Y. Barguil, J. Y. Charlot and V. Cirimele, “Testing for Atropine and Scopolamine in Hair by LC-MS-MS after Datura Inoxia Abuse,” Journal of Analytical Toxicology (JAT), Vol. 30, No. 7, September 2006, pp. 454-457. [10] M. Ma and F. F. Cantwell, “Solvent Microextraction with Simultaneous Back-Extraction for Sample Cleanup and Preconcentration into a Single Microdrop,” Analytical Chemistry, Vol. 71, No. 2, December 1999, pp. 388-393. [11] M. Ma and F. F. Cantwell, “Solvent Microextraction with Simultaneous Back-Extraction for Sample Cleanup and Preconcentration,” Quantitative Extraction Analytical Chemistry, Vol. 70, No. 18, August 1998, pp. 3912-3919. doi:10.1021/ac980174n [12] L. Yangcheng, L. Quan, L. Guangsheng and D. Youyuan, “Directly Suspended Droplet Microextraction,” Analytica Chimica Acta, Vol. 566, No. 2, May 2006, pp. 259-264. doi:10.1016/j.aca.2006.02.072 [13] P. Kintz,V. Cirimele, F. Vayssette and P. Mangin, “Hair Analysis for Nordiazepam and Oxazepam by Gas Chro- matography-Negative-Ion Chemical Ionization Mass Spec- trometry,” Journal of Chromatography B, Vol. 677, No. 2 March 1996, 241-244. doi:10.1016/0378-4347(95)00444-0 [14] L. Zhao, L. Zhu, H. K. Lee, “Analysis of Aromatic Amines in Water Samples by Liquid–Liquid–Liquid Mi- croextraction with Hollow Fibers and High-Performance liquid Chromatography,” Journal of Chromatography A, Vol. 963, No. 1-2, July 2002, pp. 239-248. doi:10.1016/S0021-9673(02)00544-7 [15] L. Hou and H. K. Lee, “Dynamic Three-Phase Microex- traction as a Sample Preparation Technique Prior to Cap- illary Electrophoresis,” Analytical Chemistry, Vol. 75, No. 11, April 2003, pp. 2784-2789. [16] A. Sarafraz-Yazdi and Z. Es’haghi, “Two-Step Hollow Fiber-Based, Liquid-Phase Microextraction Combined with High-Performance Liquid Chromatography: A New Approach to Determination of Aromatic Amines in Wa- ter,” Journal of Chromatography A, Vol. 1082, No. 2, May 2005, pp. 136-142. doi:10.1002/1615-9314(20010801)24:7<495::AID-JSSC4 95>3.0.CO;2-B [17] JÅ. Jِönsson and L. Mathiasson, “Memrane Extraction in Analytical Chemistry,” Journal of Seperation Science, Vol. 24, No. 7, August 2001, pp. 495-507. [18] A. Sarafraz Yazdia, F. Mofazzeli and Z. Es’haghi, “Determination of 3-Nitroaniline in Water Samples by directly Suspended Droplet Three-Phase Liquid-Phase Microextraction Using 18-Crown-6 Ether and High- Performance Liquid Chromatography,” Journal of Chro- matography A, Vol. 1216, May 2009, pp. 5086- 5091. [19] E. Psillakis and N .Kalogerakis, “Developments in Liq- uid-Phase Microextraction,” Trends in Analytical Chemis- try, Vol. 22, No. 9, October 2003, pp. 565-574. [20] S. Palmarsdottir, E. Throdarson, L. E. Edholm and J. A. Jönsson, “Miniaturized Supported Liquid Membrane De- vice for Selective On-Line Enrichment of Basic Drugs in Plasma Combined with Capillary Zone Electrophoresis,” Analytical Chemistry, Vol. 69, No. 9, May1997, pp. 1732-1737. doi:10.1021/ac960668p [21] M. R. Hoffmann, I. Hua and R. Höchemer, “Application of Ultrasonic Irradiation for the Degradation of Chemical Contaminants in Water,” Ultrasonics Sonochemistry, Vol. 3, No. 3, November 1996, pp. S163-172. [22] E. Psillakis and N. Kalogerakis, “Solid-Phase Micro- extraction Versus Single-Drop Microextraction for the Analysis of Nitroaromatic Explosives in Water Samples,” Journal of Chromatography A, Vol. 938, No.1-2, 2001, pp. 113-120. doi:10.1016/S0021-9673(01)01417-0 [23] G. Shen and H. K. Lee, “Hollow Fiber-Protected Liq- uid-Phase Microextraction of Triazine Herbicides,” Ana- lytical Chemistry, Vol. 74, No. 3, February 2002, pp. 648-654. [24] K. E. Rasmussen, S. Pedersen-Bjergaard, M. Krogh, H. G. Ugland and T Gronhaug, “Development of a Simple In- vial Liquid-Phase Microextraction Device for Drug Analysis Compatible with Capillary Gas Chromatography, Capillary Electrophoresis and High-Performance Liquid Chromatography,” Journal of Chromatography A, Vol. 873, No. 1, March 2000, pp. 3-11. doi:10.1016/S0021-9673(99)01163-2 [25] Z. Es’haghi, “Determination of widely Used Non-Ste- roidal Anti-Inflammatory Drugs in Water Samples by in Situ Derivatization, Continuous Hollow Fiber Liquid- Phase Microextraction and Gas Chromatography-Flame Ionization Detector,” Analytica Chimica Acta, Vol. 641, No. 1-2, May 2009, pp. 83-88. doi:10.1016/j.aca.2009.03.043 [26] S. De. Koning, M. Kurano, H. G .Janssen and U. A. T. Brinkman, “AT-Column, a Novel Concentrating Tech- nique for Large-Volume Injections in Gas Chromatogra- phy,” Journal of Chromatography A, Vol. 1023, No. 2, January 2004, pp. 165-174. doi:10.1016/j.chroma.2003.10.031 [27] A. Skulska, M. Kała, P. Adamowicz , E. Chudzikiewicz, W. Lechowicz, P. Lek, “Determination of Fentanyl, At- ropine and Scopolamine in Biological Material Using LC-MS/APCI Methods,” Przeglad lekarski, Vol. 64, No. 4-5, 2007, pp. 263-267. [28] M .Nakamura, M. Ono, T. Nakajima, Y. Ito, T. Aketo and Copyright © 2011 SciRes. AJAC  M. MASROURNIA ET AL. Copyright © 2011 SciRes. AJAC 242 J. Haginaka, “Uniformly Sized Molecularly Imprinted Polymer for Atropine and Its Application to the Determi- nation of Atropine and Scopolamine in Pharmaceutical Preparations Containing Scopolia Extract,” Journal of Pharmaceutical and Biomedical Analysis, Vol. 37, No. 2, February 2005, pp. 231-237. doi:10.1016/j.jpba.2004.10.017 [29] P. A. Steenkamp, N. M. Harding, F. R. van Heerden and B. E. Van Wyk, “Fatal Datura Poisoning: Identification of Atropine and Scopolamine by High Performance Liq- uid Chromatography/Photodiode Array/Mass Spectrome- try,” Forensic Science International, Vol. 145, No. 1, October 2004, pp. 31-39. [30] L. Kursinszki, H. Hank, I. László and É. Szőke, “Simul- taneous Analysis of Hyoscyamine, Scopolamine, 6β-hy- droxy-hyoscyamine and Apoatropine in Solanaceous Hairy Roots by Reversed-Phase High-Performance Liq- uid Chromatography,” Journal of Chromatography A, Vol. 1091, No. 1-2, October 2005, pp. 32-35. doi:10.1016/j.chroma.2005.07.016 [31] G. A. H. Mostafa, “Potentiometric PVC Membrane Sen- sor for the Determination of Scopolamine in Some Phar- maceutical Formulations,” Analytical Science, Vol. 18, No. 12, September 2002, pp. 1335-1338. doi:10.2116/analsci.18.1335 [32] G. Theodoridis, A. Kantifes, P. Manesiotis, N. Raikos, H. Tsoukali-Papadopoulou, “Preparation of a Molecularly Imprinted Polymer for the Solid-Phase Extraction of Sco- polamine with Hyoscyamine as a Dummy Template Molecule,” Journal of Chromatography A, Vol. 987, No. 1-2, February 2003, pp. 103-109. doi:10.1016/S0021-9673(02)02048-4 [33] A. S. Bahmanzadegana and F. Sonboli, “Determina- tion of Hyoscyamine and Scopolamine in Four Hyoscyamus Species from Iran A,” Iranian Journal of Pharmaceutical Research, Vol. 8, No. 1, 2009, pp. 65-70. [34] A. Sarafraz Yazdi and Z. Es’haghi, “Liquid–Liquid–Liquid Phase Microextraction of Aromatic Amines in Water Us- ing Crown Ethers by High-Performance Liquid Chroma- tography with Monolithic Column,” Talanta, Vol. 66, No. 3, January 2005, pp. 664-669. doi:10.1016/j.talanta.2004.12.026 |