

Paper Menu >>
Journal Menu >>
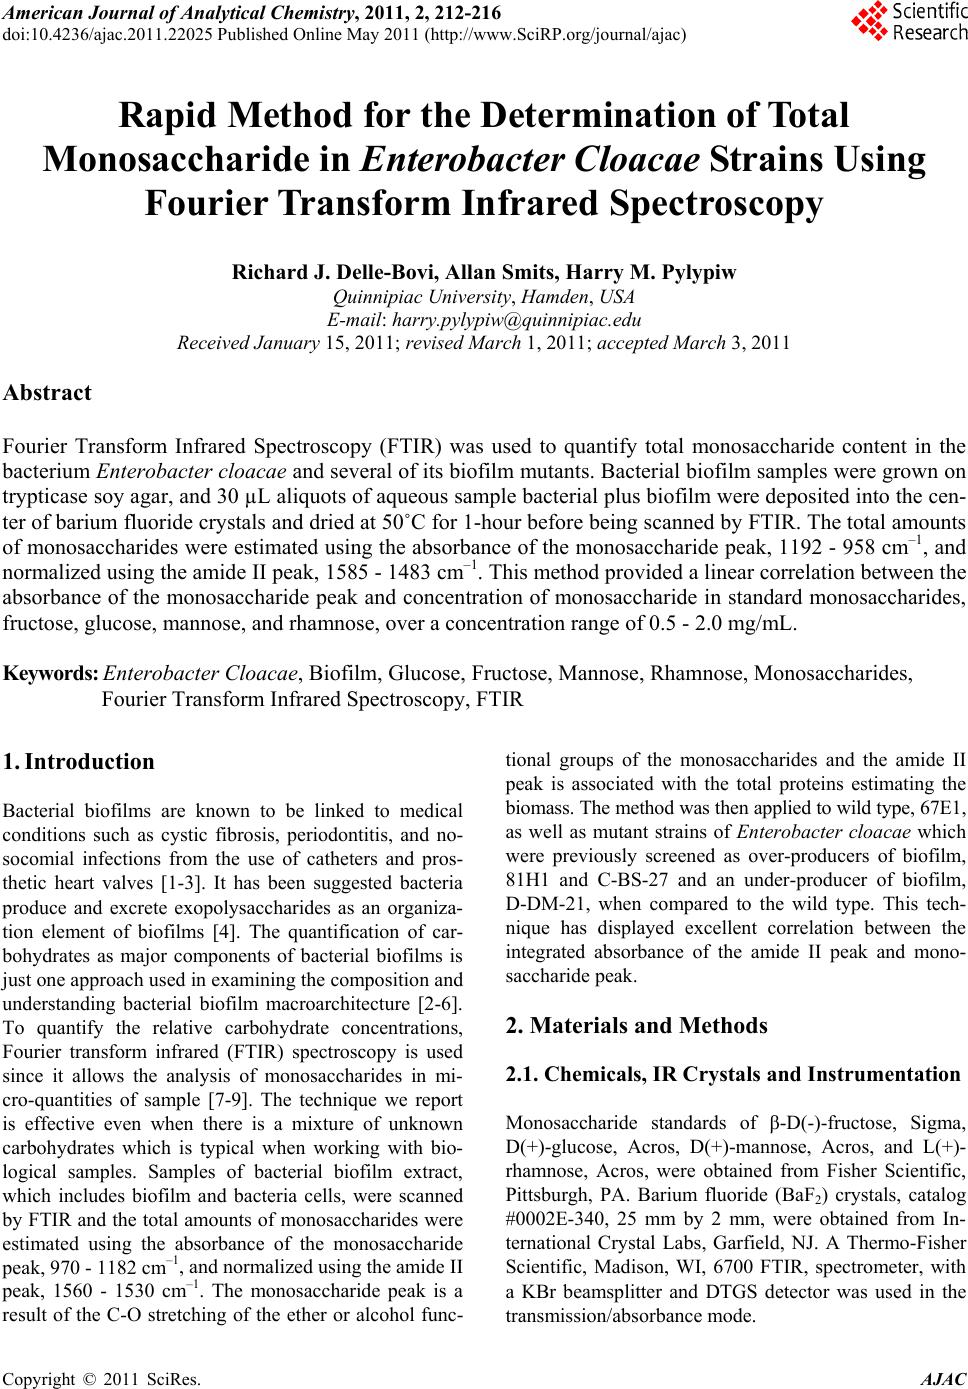 American Journal of Anal yt ical Chemistry, 2011, 2, 212-216 doi:10.4236/ajac.2011.22025 Published Online May 2011 (http://www.SciRP.org/journal/ajac) Copyright © 2011 SciRes. AJAC Rapid Method for the Determination of Total Monosaccharide in Enterobacter Cloacae St rains Using Fourier Transform Infrared Spectroscopy Richard J. Delle-Bovi, Allan Smits, Harry M. Pylypiw Quinnipiac U niversity, Hamden, USA E-mail: [email protected] Received January 15, 2011; revised March 1, 2011; accepted March 3, 2011 Abstract Fourier Transform Infrared Spectroscopy (FTIR) was used to quantify total monosaccharide content in the bacterium Enterobacter cloacae and several of its biofilm mutants. Bacterial biofilm samples were grown on trypticase soy agar, and 30 µL aliquots of aqueous sample bacterial plus biofilm were deposited into the cen- ter of barium fluoride crystals and dried at 50˚C for 1-hour before being scanned by FTIR. The total amounts of monosaccharides were estimated using the absorbance of the monosaccharide peak, 1192 - 958 cm–1, and normalized using the amide II peak, 1585 - 1483 cm–1. This method provided a linear correlation between the absorbance of the monosaccharide peak and concentration of monosaccharide in standard monosaccharides, fructose, glucose, mannose, and rhamnose, over a concentration range of 0.5 - 2.0 mg/mL. Keywords: Enterobacter Cloacae, Biofilm, Glucose, Fructose, Mannose, Rhamnose, Monosaccharides, Fourier Transform Infrared Spectroscopy, FTIR 1. Introduction Bacterial biofilms are known to be linked to medical conditions such as cystic fibrosis, periodontitis, and no- socomial infections from the use of catheters and pros- thetic heart valves [1-3]. It has been suggested bacteria produce and excrete exopolysaccharides as an organiza- tion element of biofilms [4]. The quantification of car- bohydrates as major components of bacterial biofilms is just one approach used in examining the composition and understanding bacterial biofilm macroarchitecture [2-6]. To quantify the relative carbohydrate concentrations, Fourier transform infrared (FTIR) spectroscopy is used since it allows the analysis of monosaccharides in mi- cro-quantities of sample [7-9]. The technique we report is effective even when there is a mixture of unknown carbohydrates which is typical when working with bio- logical samples. Samples of bacterial biofilm extract, which includes biofilm and bacteria cells, were scanned by FTIR and the total amounts of monosaccharides were estimated using the absorbance of the monosaccharide peak, 970 - 1182 cm–1, and normalized using the amide II peak, 1560 - 1530 cm–1. The monosaccharide peak is a result of the C-O stretching of the ether or alcohol func- tional groups of the monosaccharides and the amide II peak is associated with the total proteins estimating the biomass. The method was then applied to wild type, 67E1, as well as mutant strains of Enterobacter cloacae which were previously screened as over-producers of biofilm, 81H1 and C-BS-27 and an under-producer of biofilm, D-DM-21, when compared to the wild type. This tech- nique has displayed excellent correlation between the integrated absorbance of the amide II peak and mono- saccharide peak. 2. Materials and Methods 2.1. Chemicals, IR Crystals and Instrumentation Monosaccharide standards of β-D(-)-fructose, Sigma, D(+)-glucose, Acros, D(+)-mannose, Acros, and L(+)- rhamnose, Acros, were obtained from Fisher Scientific, Pittsburgh, PA. Barium fluoride (BaF2) crystals, catalog #0002E-340, 25 mm by 2 mm, were obtained from In- ternational Crystal Labs, Garfield, NJ. A Thermo-Fisher Scientific, Madison, WI, 6700 FTIR, spectrometer, with a KBr beamsplitter and DTGS detector was used in the transmission/absorbance mode. 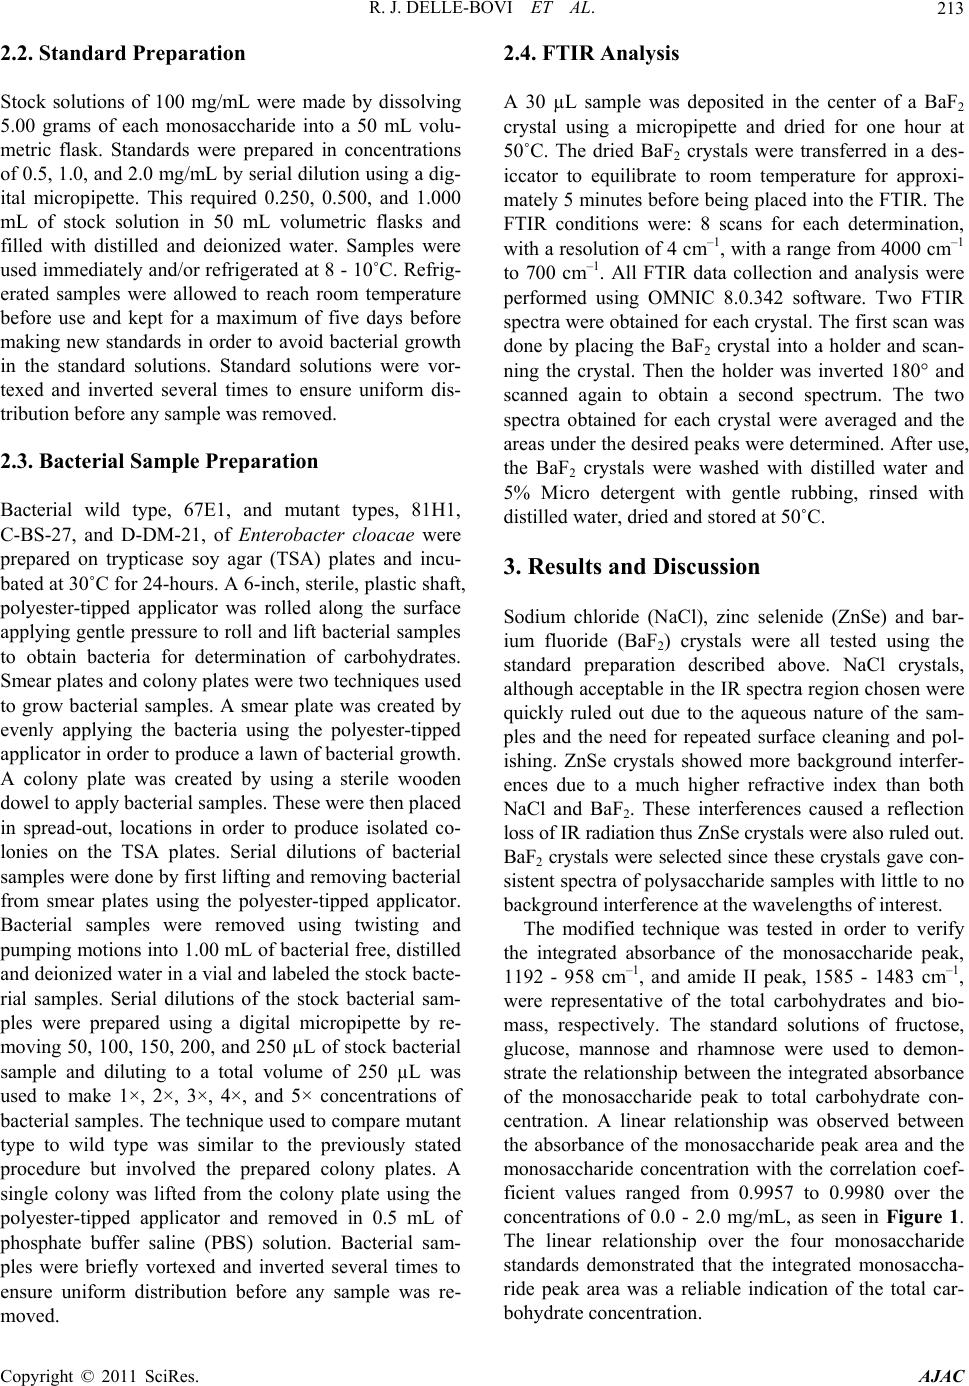 R. J. DELLE-BOVI ET AL.213 2.2. Standard Preparation Stock solutions of 100 mg/mL were made by dissolving 5.00 grams of each monosaccharide into a 50 mL volu- metric flask. Standards were prepared in concentrations of 0.5, 1.0, and 2.0 mg/mL by serial dilution using a dig- ital micropipette. This required 0.250, 0.500, and 1.000 mL of stock solution in 50 mL volumetric flasks and filled with distilled and deionized water. Samples were used immediately and/or refrigerated at 8 - 10˚C. Refrig- erated samples were allowed to reach room temperature before use and kept for a maximum of five days before making new standards in order to avoid bacterial growth in the standard solutions. Standard solutions were vor- texed and inverted several times to ensure uniform dis- tribution before any sample was removed. 2.3. Bacterial Sample Preparation Bacterial wild type, 67E1, and mutant types, 81H1, C-BS-27, and D-DM-21, of Enterobacter cloacae were prepared on trypticase soy agar (TSA) plates and incu- bated at 30˚C for 24-hours. A 6-inch, sterile, plastic shaft, polyester-tipped applicator was rolled along the surface applying gentle pressure to roll and lift bacterial samples to obtain bacteria for determination of carbohydrates. Smear plates and colony plates were two techniques used to grow bacterial samples. A smear plate was created by evenly applying the bacteria using the polyester-tipped applicator in order to produce a lawn of bacterial growth. A colony plate was created by using a sterile wooden dowel to apply bacterial samples. These were then placed in spread-out, locations in order to produce isolated co- lonies on the TSA plates. Serial dilutions of bacterial samples were done by first lifting and removing bacterial from smear plates using the polyester-tipped applicator. Bacterial samples were removed using twisting and pumping motions into 1.00 mL of bacterial free, distilled and deionized water in a vial and labeled the stock bacte- rial samples. Serial dilutions of the stock bacterial sam- ples were prepared using a digital micropipette by re- moving 50, 100, 150, 200, and 250 µL of stock bacterial sample and diluting to a total volume of 250 µL was used to make 1×, 2×, 3×, 4×, and 5× concentrations of bacterial samples. The technique used to compare mutant type to wild type was similar to the previously stated procedure but involved the prepared colony plates. A single colony was lifted from the colony plate using the polyester-tipped applicator and removed in 0.5 mL of phosphate buffer saline (PBS) solution. Bacterial sam- ples were briefly vortexed and inverted several times to ensure uniform distribution before any sample was re- moved. 2.4. FTIR Analysis A 30 µL sample was deposited in the center of a BaF2 crystal using a micropipette and dried for one hour at 50˚C. The dried BaF2 crystals were transferred in a des- iccator to equilibrate to room temperature for approxi- mately 5 minutes before being placed into the FTIR. The FTIR conditions were: 8 scans for each determination, with a resolution of 4 cm–1, with a range from 4000 cm–1 to 700 cm–1. All FTIR data collection and analysis were performed using OMNIC 8.0.342 software. Two FTIR spectra were obtained for each crystal. The first scan was done by placing the BaF2 crystal into a holder and scan- ning the crystal. Then the holder was inverted 180° and scanned again to obtain a second spectrum. The two spectra obtained for each crystal were averaged and the areas under the desired peaks were determined. After use, the BaF2 crystals were washed with distilled water and 5% Micro detergent with gentle rubbing, rinsed with distilled water, dried and stored at 50˚C. 3. Results and Discussion Sodium chloride (NaCl), zinc selenide (ZnSe) and bar- ium fluoride (BaF2) crystals were all tested using the standard preparation described above. NaCl crystals, although acceptable in the IR spectra region chosen were quickly ruled out due to the aqueous nature of the sam- ples and the need for repeated surface cleaning and pol- ishing. ZnSe crystals showed more background interfer- ences due to a much higher refractive index than both NaCl and BaF2. These interferences caused a reflection loss of IR radiation thus ZnSe crystals were also ruled out. BaF2 crystals were selected since these crystals gave con- sistent spectra of polysaccharide samples with little to no background interference at the wavelengths of interest. The modified technique was tested in order to verify the integrated absorbance of the monosaccharide peak, 1192 - 958 cm–1, and amide II peak, 1585 - 1483 cm–1, were representative of the total carbohydrates and bio- mass, respectively. The standard solutions of fructose, glucose, mannose and rhamnose were used to demon- strate the relationship between the integrated absorbance of the monosaccharide peak to total carbohydrate con- centration. A linear relationship was observed between the absorbance of the monosaccharide peak area and the monosaccharide concentration with the correlation coef- ficient values ranged from 0.9957 to 0.9980 over the concentrations of 0.0 - 2.0 mg/mL, as seen in Figure 1. The linear relationship over the four monosaccharide standards demonstrated that the integrated monosaccha- ride peak area was a reliable indication of the total car- bohydrate concentration. Copyright © 2011 SciRes. AJAC 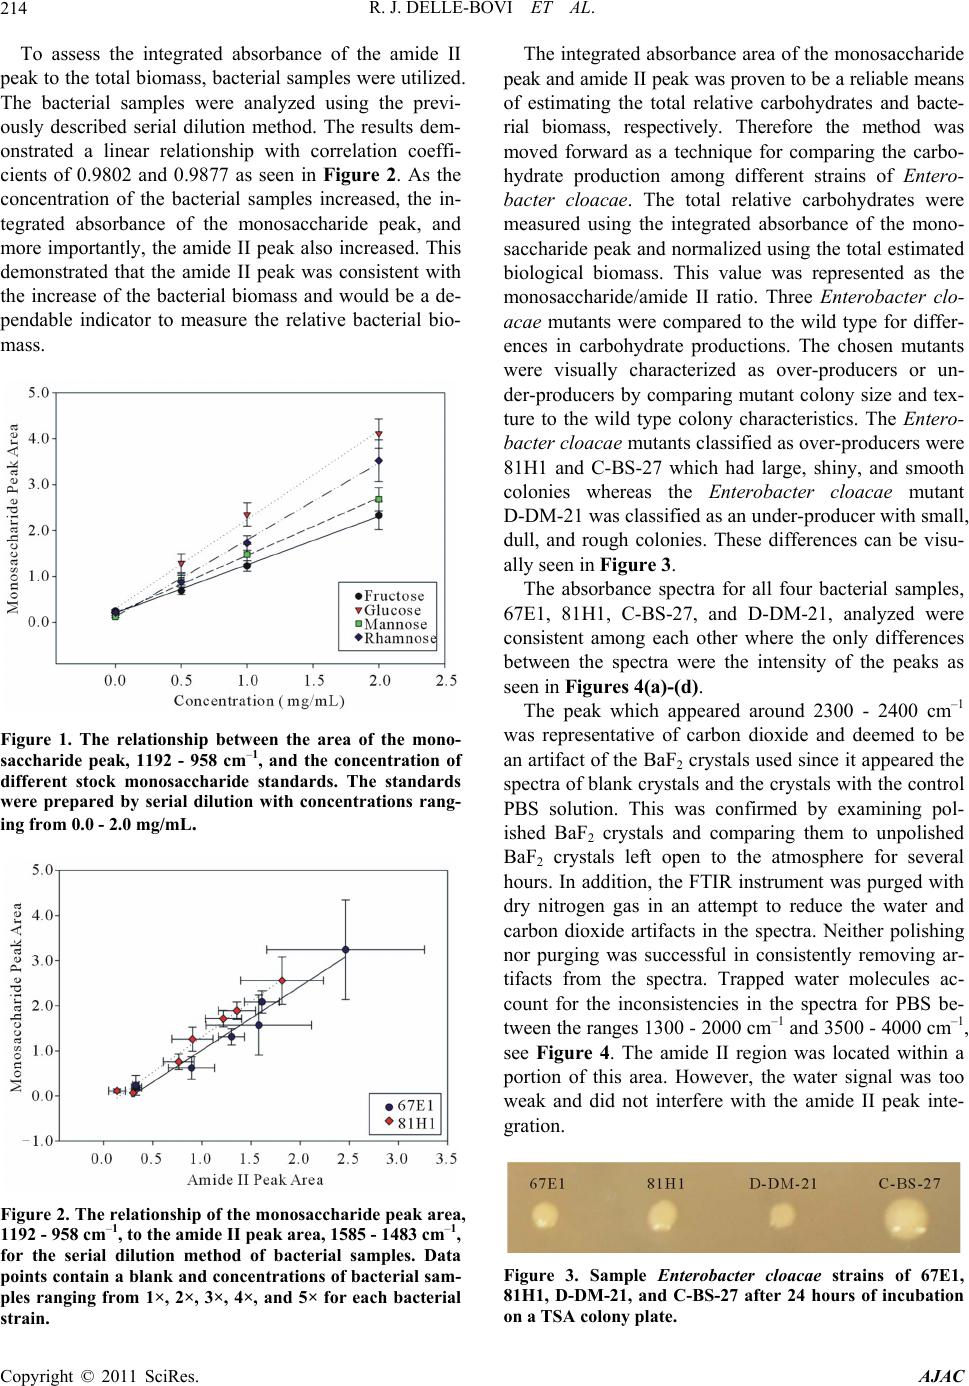 R. J. DELLE-BOVI ET AL. 214 To assess the integrated absorbance of the amide II peak to the total biomass, bacterial samples were utilized. The bacterial samples were analyzed using the previ- ously described serial dilution method. The results dem- onstrated a linear relationship with correlation coeffi- cients of 0.9802 and 0.9877 as seen in Figure 2. As the concentration of the bacterial samples increased, the in- tegrated absorbance of the monosaccharide peak, and more importantly, the amide II peak also increased. This demonstrated that the amide II peak was consistent with the increase of the bacterial biomass and would be a de- pendable indicator to measure the relative bacterial bio- mass. Figure 1. The relationship between the area of the mono- saccharide peak, 1192 - 958 cm–1, and the concentration of different stock monosaccharide standards. The standards were prepared by serial dilution with concentrations rang- ing from 0.0 - 2.0 mg/mL. Figure 2. The relationship of the monosaccharide peak area, 1192 - 958 cm–1, to the amide II peak area, 1585 - 1483 cm–1, for the serial dilution method of bacterial samples. Data points contain a blank and concentrations of bacteri al sam- ples ranging from 1×, 2×, 3×, 4×, and 5× for each bacterial train. s The integrated absorbance area of the monosaccharide peak and amide II peak was proven to be a reliable means of estimating the total relative carbohydrates and bacte- rial biomass, respectively. Therefore the method was moved forward as a technique for comparing the carbo- hydrate production among different strains of Entero- bacter cloacae. The total relative carbohydrates were measured using the integrated absorbance of the mono- saccharide peak and normalized using the total estimated biological biomass. This value was represented as the monosaccharide/amide II ratio. Three Enterobacter clo- acae mutants were compared to the wild type for differ- ences in carbohydrate productions. The chosen mutants were visually characterized as over-producers or un- der-producers by comparing mutant colony size and tex- ture to the wild type colony characteristics. The En tero - bacter cloacae mutants classified as over-producers were 81H1 and C-BS-27 which had large, shiny, and smooth colonies whereas the Enterobacter cloacae mutant D-DM-21 was classified as an under-producer with small, dull, and rough colonies. These differences can be visu- ally seen in Figure 3. The absorbance spectra for all four bacterial samples, 67E1, 81H1, C-BS-27, and D-DM-21, analyzed were consistent among each other where the only differences between the spectra were the intensity of the peaks as seen in Figures 4(a)-(d). The peak which appeared around 2300 - 2400 cm–1 was representative of carbon dioxide and deemed to be an artifact of the BaF2 crystals used since it appeared the spectra of blank crystals and the crystals with the control PBS solution. This was confirmed by examining pol- ished BaF2 crystals and comparing them to unpolished BaF2 crystals left open to the atmosphere for several hours. In addition, the FTIR instrument was purged with dry nitrogen gas in an attempt to reduce the water and carbon dioxide artifacts in the spectra. Neither polishing nor purging was successful in consistently removing ar- tifacts from the spectra. Trapped water molecules ac- count for the inconsistencies in the spectra for PBS be- tween the ranges 1300 - 2000 cm–1 and 3500 - 4000 cm–1, see Figure 4. The amide II region was located within a portion of this area. However, the water signal was too weak and did not interfere with the amide II peak inte- gration. Figure 3. Sample Enterobacter cloacae strains of 67E1, 81H1, D-DM-21, and C-BS-27 after 24 hours of incubation on a TSA colony plate. Copyright © 2011 SciRes. AJAC 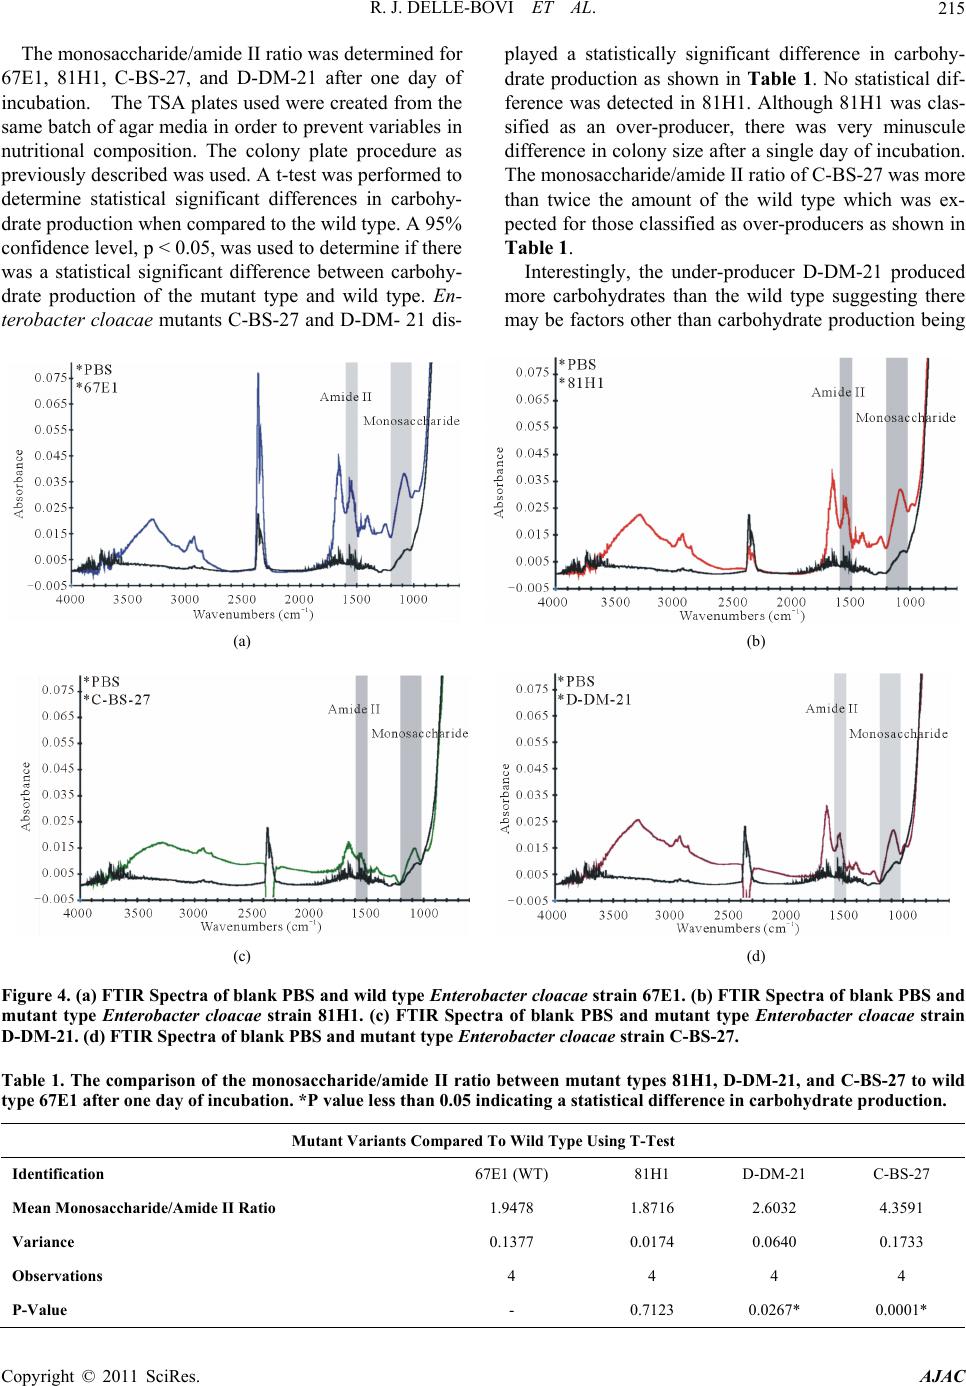 R. J. DELLE-BOVI ET AL. Copyright © 2011 SciRes. AJAC 215 The monosaccharide/amide II ratio was determined for 67E1, 81H1, C-BS-27, and D-DM-21 after one day of incubation. The TSA plates used were created from the same batch of agar media in order to prevent variables in nutritional composition. The colony plate procedure as previously described was used. A t-test was performed to determine statistical significant differences in carbohy- drate production when compared to the wild type. A 95% confidence level, p < 0.05, was used to determine if there was a statistical significant difference between carbohy- drate production of the mutant type and wild type. En- terobacter cloacae mutants C-BS-27 and D-DM- 21 dis- played a statistically significant difference in carbohy- drate production as shown in Table 1. No statistical dif- ference was detected in 81H1. Although 81H1 was clas- sified as an over-producer, there was very minuscule difference in colony size after a single day of incubation. The monosaccharide/amide II ratio of C-BS-27 was more than twice the amount of the wild type which was ex- pected for those classified as over-producers as shown in Table 1. Interestingly, the under-producer D-DM-21 produced more carbohydrates than the wild type suggesting there may be factors other than carbohydrate production being (a) (b) (c) (d) Figure 4. (a) FTIR Spect ra of blank PBS and w ild type Enterobacter cloacae strain 67E1. (b) FTIR Spectra of blank PBS and mutant type Enterobacter cloacae strain 81H1. (c) FTIR Spectra of blank PBS and mutant type Enterobacter cloacae strain D-DM-21. (d) FTIR Spectra of blank PBS and mutant ty pe Enterobacter cloacae strain C-BS-27. Table 1. The comparison of the monosaccharide/amide II ratio between mutant types 81H1, D-DM-21, and C-BS-27 to wild type 67E1 after one day of incubation. *P value less than 0.05 indicating a statistical difference in carbohydrate production. Mutant Variants Compared To Wild Type Using T-Test Identification 67E1 (WT) 81H1 D-DM-21 C-BS-27 Mean Monosaccharide/Amide II Ratio 1.9478 1.8716 2.6032 4.3591 Variance 0.1377 0.0174 0.0640 0.1733 Observations 4 4 4 4 P-Value - 0.7123 0.0267* 0.0001* 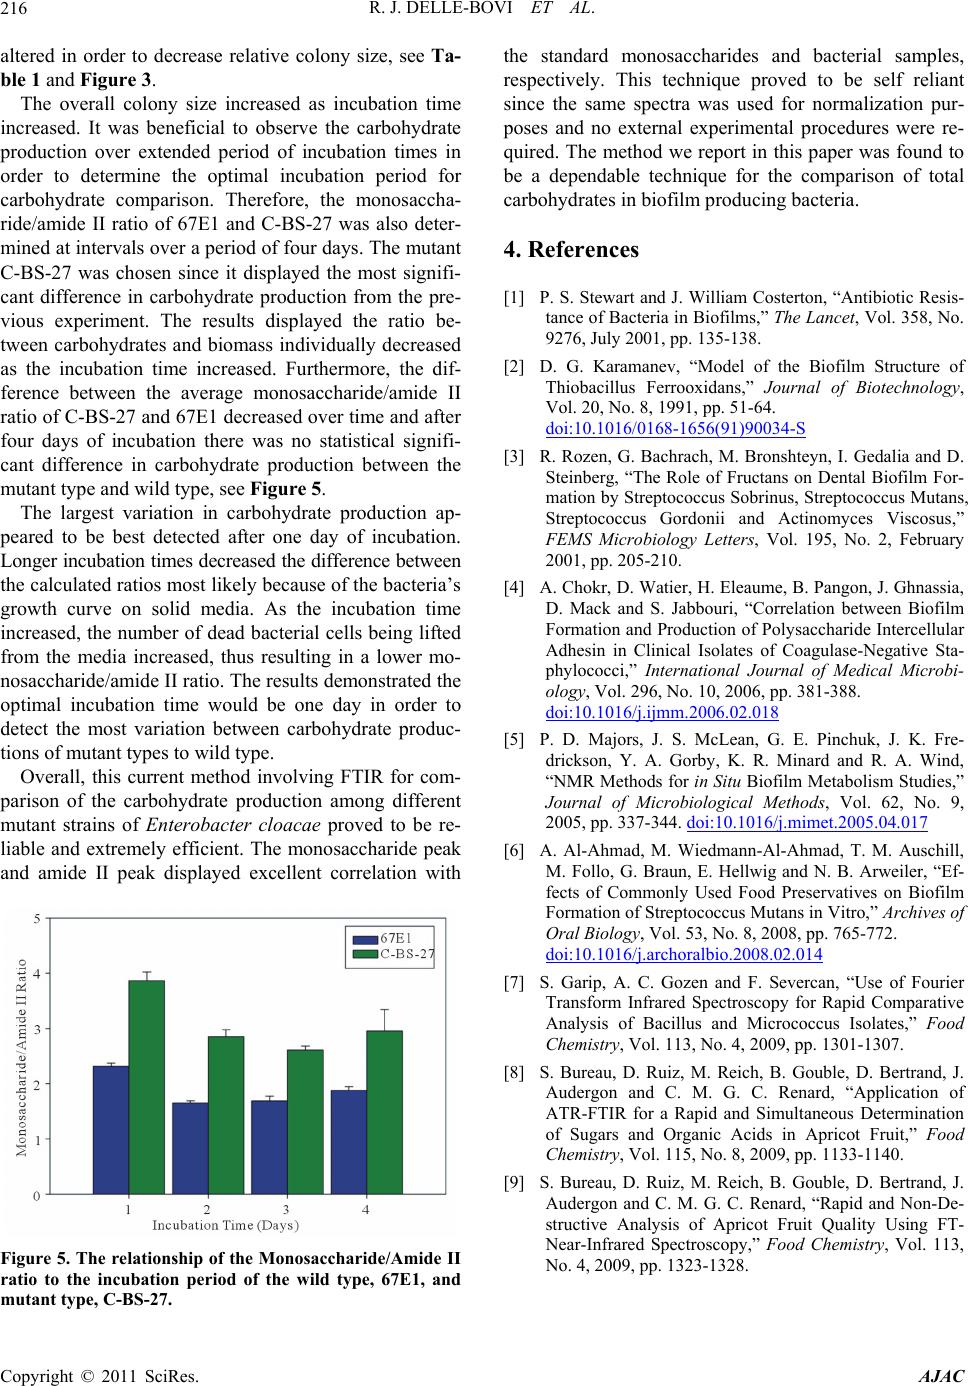 R. J. DELLE-BOVI ET AL. Copyright © 2011 SciRes. AJAC 216 altered in order to decrease relative colony size, see Ta- ble 1 and Figure 3. The overall colony size increased as incubation time increased. It was beneficial to observe the carbohydrate production over extended period of incubation times in order to determine the optimal incubation period for carbohydrate comparison. Therefore, the monosaccha- ride/amide II ratio of 67E1 and C-BS-27 was also deter- mined at intervals over a period of four days. The mutant C-BS-27 was chosen since it displayed the most signifi- cant difference in carbohydrate production from the pre- vious experiment. The results displayed the ratio be- tween carbohydrates and biomass individually decreased as the incubation time increased. Furthermore, the dif- ference between the average monosaccharide/amide II ratio of C-BS-27 and 67E1 decreased over time and after four days of incubation there was no statistical signifi- cant difference in carbohydrate production between the mutant type and wild type, see Figure 5. The largest variation in carbohydrate production ap- peared to be best detected after one day of incubation. Longer incubation times decreased the difference between the calculated ratios most likely because of the bacteria’s growth curve on solid media. As the incubation time increased, the number of dead bacterial cells being lifted from the media increased, thus resulting in a lower mo- nosaccharide/amide II ratio. The results demonstrated the optimal incubation time would be one day in order to detect the most variation between carbohydrate produc- tions of mutant types to wild type. Overall, this current method involving FTIR for com- parison of the carbohydrate production among different mutant strains of Enterobacter cloacae proved to be re- liable and extremely efficient. The monosaccharide peak and amide II peak displayed excellent correlation with Figure 5. The relationship of the Monosaccharide/Amide II ratio to the incubation period of the wild type, 67E1, and utant type, C-BS-27. m the standard monosaccharides and bacterial samples, respectively. This technique proved to be self reliant since the same spectra was used for normalization pur- poses and no external experimental procedures were re- quired. The method we report in this paper was found to be a dependable technique for the comparison of total carbohydrates in biofilm producing bacteria. 4. References [1] P. S. Stewart and J. William Costerton, “Antibiotic Resis- tance of Bacteria in Biofilms,” The Lancet, Vol. 358, No. 9276, July 2001, pp. 135-138. [2] D. G. Karamanev, “Model of the Biofilm Structure of Thiobacillus Ferrooxidans,” Journal of Biotechnology, Vol. 20, No. 8, 1991, pp. 51-64. doi:10.1016/0168-1656(91)90034-S [3] R. Rozen, G. Bachrach, M. Bronshteyn, I. Gedalia and D. Steinberg, “The Role of Fructans on Dental Biofilm For- mation by Streptococcus Sobrinus, Streptococcus Mutans, Streptococcus Gordonii and Actinomyces Viscosus,” FEMS Microbiology Letters, Vol. 195, No. 2, February 2001, pp. 205-210. [4] A. Chokr, D. Watier, H. Eleaume, B. Pangon, J. Ghnassia, D. Mack and S. Jabbouri, “Correlation between Biofilm Formation and Production of Polysaccharide Intercellular Adhesin in Clinical Isolates of Coagulase-Negative Sta- phylococci,” International Journal of Medical Microbi- ology, Vol. 296, No. 10, 2006, pp. 381-388. doi:10.1016/j.ijmm.2006.02.018 [5] P. D. Majors, J. S. McLean, G. E. Pinchuk, J. K. Fre- drickson, Y. A. Gorby, K. R. Minard and R. A. Wind, “NMR Methods for in Situ Biofilm Metabolism Studies,” Journal of Microbiological Methods, Vol. 62, No. 9, 2005, pp. 337-344. doi:10.1016/j.mimet.2005.04.017 [6] A. Al-Ahmad, M. Wiedmann-Al-Ahmad, T. M. Auschill, M. Follo, G. Braun, E. Hellwig and N. B. Arweiler, “Ef- fects of Commonly Used Food Preservatives on Biofilm Formation of Streptococcus Mutans in Vitro,” Archives of Oral Biology, Vol. 53, No. 8, 2008, pp. 765-772. doi:10.1016/j.archoralbio.2008.02.014 [7] S. Garip, A. C. Gozen and F. Severcan, “Use of Fourier Transform Infrared Spectroscopy for Rapid Comparative Analysis of Bacillus and Micrococcus Isolates,” Food Chemistry, Vol. 113, No. 4, 2009, pp. 1301-1307. [8] S. Bureau, D. Ruiz, M. Reich, B. Gouble, D. Bertrand, J. Audergon and C. M. G. C. Renard, “Application of ATR-FTIR for a Rapid and Simultaneous Determination of Sugars and Organic Acids in Apricot Fruit,” Food Chemistry, Vol. 115, No. 8, 2009, pp. 1133-1140. [9] S. Bureau, D. Ruiz, M. Reich, B. Gouble, D. Bertrand, J. Audergon and C. M. G. C. Renard, “Rapid and Non-De- structive Analysis of Apricot Fruit Quality Using FT- Near-Infrared Spectroscopy,” Food Chemistry, Vol. 113, No. 4, 2009, pp. 1323-1328. |