

Paper Menu >>
Journal Menu >>
 American Journal of Anal yt ical Chemistry, 2011, 2, 174-181 doi:10.4236/ajac.2011.22020 Published Online May 2011 (http://www.SciRP.org/journal/ajac) Copyright © 2011 SciRes. AJAC Stripping Voltammetric Determination of Timolol Drug in Pharmaceuticals and Biological Fluids Ali F. Al-Ghamdi Department of Chemistry, College of Science, Taibah University, Madinah, Saudi Arabia E-mail: [email protected] Received March 13, 2011; revised April 29, 2011; accepted May 3, 2011 Abstract A sensitive and reliable stripping voltammetric method was developed to determine timolol drug. This me- thod is based on the adsorptive accumulation of the drug at a hanging mercury drop electrode (HMDE) and then a negative sweep was initiated, which yield a well defined cathodic peak at –850 mV versus (Ag/AgCl) silver reference electrode. To achieve high sensitivity, various experimental and instrumental variables were investigated such as supporting electrolyte, pH, accumulation time and potential, scan rate, frequency, pulse amplitude, convection rate and working electrode area. The monitored adsorptive current was directly pro- portional to the concentration of timolol and it shows a linear response in the range from 1 × 10⁻⁷ to 1.5 × 10⁻⁶ mol·l–1 of this drug (correlation coefficient = 0.998) and the detection limit (S/N = 3) is 1.26 × 10⁻⁹ mol·l–1 at an accumulation time of 30 sec. The developed adsorptive stripping voltammetry (AdSV) proce- dure shows a good reproducibility, the relative standard deviation RSD% (n = 8) at a concentration level of 1 × 10⁻⁶ mol·l–1 of timolol was 0.13%, whereas the method accuracy was indicated via the mean recovery of 110% ± 1.414. Possible interferences by several substances usually present in the pharmaceutical formula- tions have been also evaluated. The applicability of this approach was illustrated by the determination of the drug in pharmaceutical preparation and biological fluids such as serum and urine. Keywords: Stripping Voltammetry, HMDE, Timolol, Urine, Serum 1. Introduction Of the most commonly used instrumental techniques, electroanalytical approach is the one of choice, and stripping voltammetric method has provoked particular interest because it is currently the most sensitive and widely used electrochemical technique. Its possibility of applications cover many fields ranging from environment, pharmaceutical and clinical to food and industrial samples. Many of the adsorptive stripping voltammetric (adsv) approach features such as sensitivity, selectivity, simplicity and versatility attributed to the combination of an effective preconcentartion step based on non-electro- lytic adsorptive accumulation process with an advanced measurement procedures such as differential pulse (DP) or square wave (SW) [1-5]. Unlike conventional strip- ping approaches (anodic and cathodic stripping voltam- metry), which are based on an electrolytic nature of preconcentration step, adsorptive stripping voltammetric approach in contrast is based on adsorptive accumulation of the analyte on the electrode at open circuit with no charge transferred. Consequently, for a wide range of surface-active organic and inorganic species, which can- not be preconcentrated electroanalytically, the adsorption approach allows these analytes to be interfacially accu- mulated on the electrode and hence analysed. There have been many reviews devoted to emphasize and illustrate the wide spectrum and scope of adsorptive stripping vol-- tammetric applications and potentialities in the analysis of metal ions [6,7] organic analytes [8,9] and pharma-- ceutical drugs and biomedical compounds, such as, the anti-Inflammatory drug Lornoxicam, the antidepressant drug sulpiride and Josamycin, a Macrolide Antibiotic [10-14]. Timolol was the first beta (β) blocker to be used as an anti-glaucoma agent and to date remains as the standard because none of the newer β blockers were found to be more effective. Timolol maleate is the generic name for (Ocumol 0.5, Timolo 0.5%, 5 mg/ml- Riyadh, Pharma-SA), an eye drop (ophthalmic solution) indicated for the treatment of elevated intraocular pressure for those patients with primary open-angle glaucoma and ocular hypertension. Timolol maleate should be used 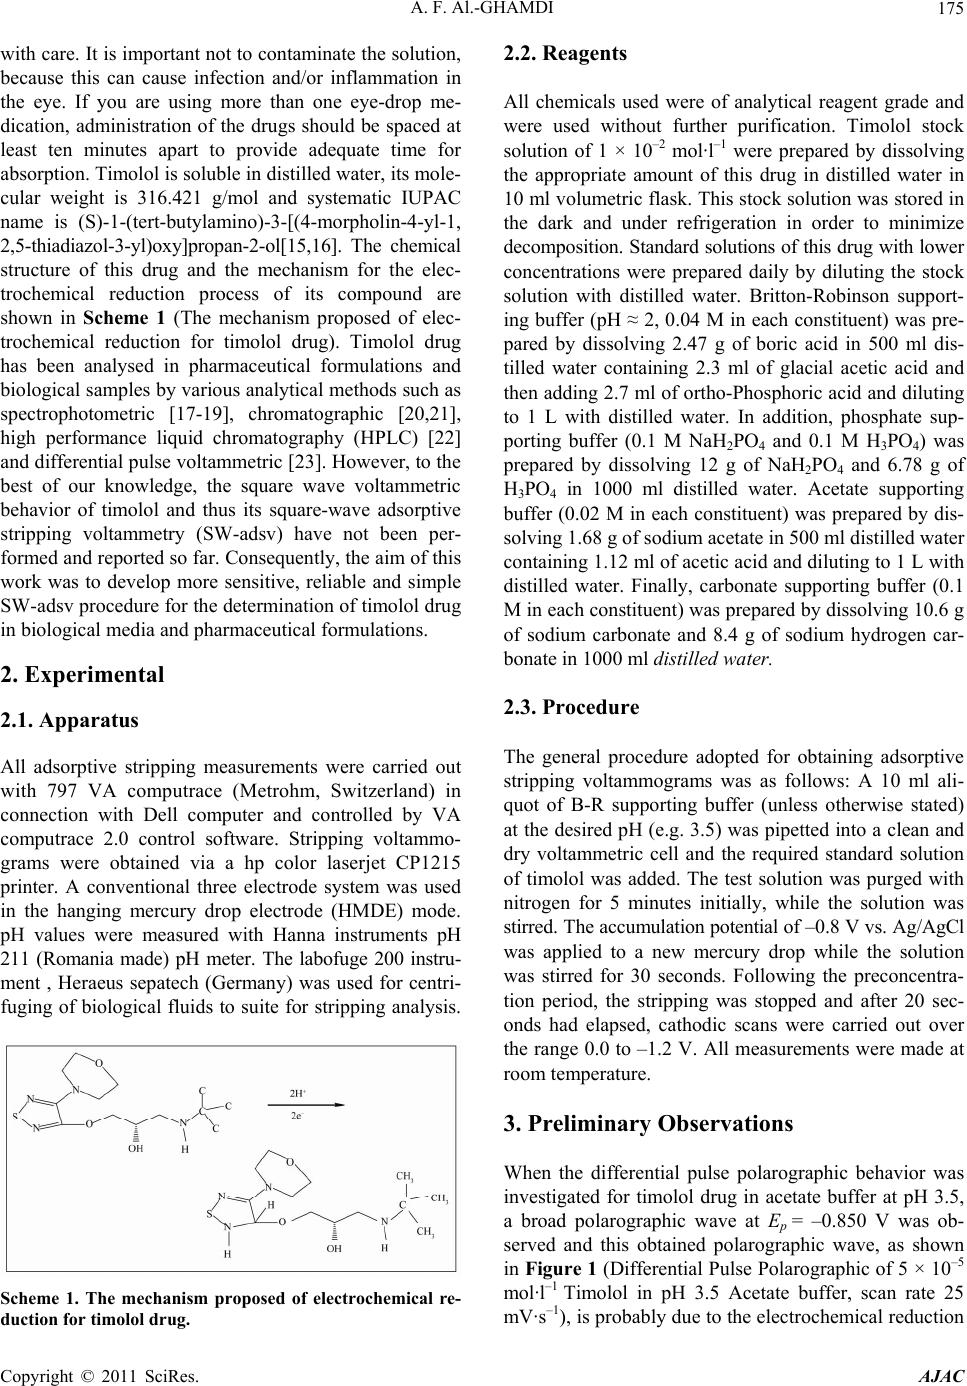 A. F. Al.-GHAMDI175 with care. It is important not to contaminate the solution, because this can cause infection and/or inflammation in the eye. If you are using more than one eye-drop me- dication, administration of the drugs should be spaced at least ten minutes apart to provide adequate time for absorption. Timolol is soluble in distilled water, its mole- cular weight is 316.421 g/mol and systematic IUPAC name is (S)-1-(tert-butylamino)-3-[(4-morpholin-4-yl-1, 2,5-thiadiazol-3-yl)oxy]propan-2-ol[15,16]. The chemical structure of this drug and the mechanism for the elec- trochemical reduction process of its compound are shown in Scheme 1 (The mechanism proposed of elec- trochemical reduction for timolol drug). Timolol drug has been analysed in pharmaceutical formulations and biological samples by various analytical methods such as spectrophotometric [17-19], chromatographic [20,21], high performance liquid chromatography (HPLC) [22] and differential pulse voltammetric [23]. However, to the best of our knowledge, the square wave voltammetric behavior of timolol and thus its square-wave adsorptive stripping voltammetry (SW-adsv) have not been per- formed and reported so far. Consequently, the aim of this work was to develop more sensitive, reliable and simple SW-adsv procedure for the determination of timolol drug in biological media and pharmaceutical formulations. 2. Experimental 2.1. Apparatus All adsorptive stripping measurements were carried out with 797 VA computrace (Metrohm, Switzerland) in connection with Dell computer and controlled by VA computrace 2.0 control software. Stripping voltammo- grams were obtained via a hp color laserjet CP1215 printer. A conventional three electrode system was used in the hanging mercury drop electrode (HMDE) mode. pH values were measured with Hanna instruments pH 211 (Romania made) pH meter. The labofuge 200 instru- ment , Heraeus sepatech (Germany) was used for centri- fuging of biological fluids to suite for stripping analysis. Scheme 1. The mechanism proposed of electrochemical re- duction for timolol drug. 2.2. Reagents All chemicals used were of analytical reagent grade and were used without further purification. Timolol stock solution of 1 × 10⁻² mol·l–1 were prepared by dissolving the appropriate amount of this drug in distilled water in 10 ml volumetric flask. This stock solution was stored in the dark and under refrigeration in order to minimize decomposition. Standard solutions of this drug with lower concentrations were prepared daily by diluting the stock solution with distilled water. Britton-Robinson support- ing buffer (pH ≈ 2, 0.04 M in each constituent) was pre- pared by dissolving 2.47 g of boric acid in 500 ml dis- tilled water containing 2.3 ml of glacial acetic acid and then adding 2.7 ml of ortho-Phosphoric acid and diluting to 1 L with distilled water. In addition, phosphate sup- porting buffer (0.1 M NaH2PO4 and 0.1 M H3PO4) was prepared by dissolving 12 g of NaH2PO4 and 6.78 g of H3PO4 in 1000 ml distilled water. Acetate supporting buffer (0.02 M in each constituent) was prepared by dis- solving 1.68 g of sodium acetate in 500 ml distilled water containing 1.12 ml of acetic acid and diluting to 1 L with distilled water. Finally, carbonate supporting buffer (0.1 M in each constituent) was prepared by dissolving 10.6 g of sodium carbonate and 8.4 g of sodium hydrogen car- bonate in 1000 ml distilled water. 2.3. Procedure The general procedure adopted for obtaining adsorptive stripping voltammograms was as follows: A 10 ml ali- quot of B-R supporting buffer (unless otherwise stated) at the desired pH (e.g. 3.5) was pipetted into a clean and dry voltammetric cell and the required standard solution of timolol was added. The test solution was purged with nitrogen for 5 minutes initially, while the solution was stirred. The accumulation potential of –0.8 V vs. Ag/AgCl was applied to a new mercury drop while the solution was stirred for 30 seconds. Following the preconcentra- tion period, the stripping was stopped and after 20 sec- onds had elapsed, cathodic scans were carried out over the range 0.0 to –1.2 V. All measurements were made at room temperature. 3. Preliminary Observations When the differential pulse polarographic behavior was investigated for timolol drug in acetate buffer at pH 3.5, a broad polarographic wave at Ep = –0.850 V was ob- served and this obtained polarographic wave, as shown in Figure 1 (Differential Pulse Polarographic of 5 × 10⁻⁵ mol·l–1 Timolol in pH 3.5 Acetate buffer, scan rate 25 mV·s–1), is probably due to the electrochemical reduction Copyright © 2011 SciRes. AJAC  A. F. Al.-GHAMDI 176 Figure 1. Differential Pulse Polarographic of 5 × 10⁻⁵ mol·l–1 Timolol in pH 3.5 Acetate buffer, scan rate 25 mV·s–1. of the double bond (–N=C) as shown in the previous scheme1, which including a proposed mechanism for the electrochemical reduction of this drug. This mechanism suggesting that the electrochemical reaction is an irre- versible process, an assumption which was confirmed by cyclic voltammetric measurement at a scan rate of 50 mV–1 of timolol in acetate buffer (pH 3.5) as shown in Figure 2 (Cyclic voltammogram of 5 × 10⁻⁵ mol·l–1 Ti- molol in pH 3.5 Acetate buffer, scan rate 50 mV·s–1). In order to obtain a voltammetric peak with better de- finition and higher sensitivity, a HMDE was used to study the adsorptive prosperities of timolol compound. The AdSV behavior of the drug was investigated in var- ious supporting electrolytes at different pH values. This Drug compound yielded a well-developed and defined AdSV peak corresponding to the electroactive –N=C at peak potential of –0.85 V. A typical adsorptive stripping voltammogram for 5 × 10⁻⁷ mol·l–1 timolol in acetate buf- fer is shown in Figure 3 (SW-AdSV voltammogram Figure 2. Cyclic voltammogram of 5 × 10⁻⁵ mol·l–1 Timolol in pH 3.5 Acetate buffer, scan rate 50 mV·s–1. Figure 3. SW-AdSV voltammogram of 5 × 10⁻⁷ mol·l–1 Ti- molol in pH 3.5 Acetate buffer. Accumulation time 30 sec, accumulation potential –0.8 V and scan rate 250 mV·s–1. of 5 × 10⁻⁷ mol·l–1 Timolol in pH 3.5 Acetate buffer. Ac- cumulation time 30 sec, accumulation potential –0.8 V and scan rate 250 mV·s–1), which illustrates a well ob- served electrochemical peak indicating a strong and rea- dily adsorption process at the surface of the working electrode. 3.1. Parameters Affecting the Adsorptive Stripping Response 3.1.1. Effect of Supporting Electrolyte and pH The nature and acidity of the supporting buffer are some of the most important factors which strongly influence the stability of the analyte and its cathodic reduction and adsorption processes. Among the various investigated buffers (B-R, acetate, carbonate and phosphate) the best voltammetric signal in terms of sensitivity (peak height) and resolution (peak shape) have been secured using acetate buffer. In addition, when the AdSV peak current was measured as a function of pH over 2-6 range, the stripping voltammetric signal increased steadily over the acidic region and the peak current reached its maximum value at pH 3.5 which was selected as optimal value for subsequent studies. It is noteworthy that when more than 3.5 acetate supporting electrolyte was used, timolol was barely detectable and nearly no stripping voltammetric signal was observed. The variation of AdSV peak current with pH, obtained for 1 × 10⁻⁶ mol·l–1 Timolol drug con- centration accumulated for 30 sec is exhibited in Figure 4 (Effect of pH on AdSV peak current of 1 × 10⁻⁶ M Ti- molol at Acetate buffer). 3.1.2. Effect of Accumulation Time and Potential Preconcentration of the analyzed drug on the surface of the working electrode (HMDE) is one of the essential Copyright © 2011 SciRes. AJAC  A. F. Al.-GHAMDI177 Figure 4. Effect of pH on AdSV peak current of 1 × 10⁻⁶ M Timolol at Acetate buffer. conditions for highly sensitive determinations. Variation of the accumulation time over 0 - 150 sec period for 1 × 10⁻⁶ mol·l–1 timolol drug solution at a preconcentration potential of 0.0 V, showed a gradual enhancement for the monitored peak current over the range 0 - 30 sec. The de- pendence of peak current on accumulation time is pre- sented in Figure 5 (Effect of accumulation time on AdSV peak current of 1 × 10⁻⁶ M Timolol in pH 3.5 Acetate buf- fer). The proportional relationship was nearly ob- served up to 30 sec and then it became virtually curved and lev- eled off owing to the saturation of the hanging mercury drop by the analyte. For further experiments an accumula- tion time of 30 sec was selected as optimal because it pro- vided relatively high peak current with adequate practical time. The variation of accumulation time did not produce significant shifts in peak potential value. In addition, as can be seen from Figure 6 (Effect of accumulation potential on AdSV peak current of 1 × 10⁻⁶ M Timolol in pH 3.5 Acetate buffer and accumulation time 30 sec), when the influence of accumulation poten- tial on the monitored electrochemical response was ex- amined over the –0.8 to +0.8 V range at 30 sec precon- centration time, the peak current was directly reached its maximum value at Ep = –0.8 V then it decreased sharply after potential –0.8V. Thus, Eacc= 0.8 V will be adopted as optimum operational value for the following works as it ensured the highest AdSV signal. Figure 5. Effect of accumulation time on AdSV peak cur- rent of 1 × 10⁻⁶ M Timolol in pH 3.5 Acetate buffer. Figure 6. Effect of accumulation potential on AdSV peak current of 1 × 10⁻⁶ M Timolol in pH 3.5 Acetate buffer and accumulation time 30 sec. 3.1.3. Effect of Scan Rat The cathodic peak current of timolol drug was found to be forthwith proportional to the scan rate, particularly at low scan rate values, a phenomenon characterized for adsorbed materials [24]. When the stripping voltammet- ric peak current of 1 × 10⁻⁶ mol·l–1 timolol drug in pH 3.5 acetate buffer was measured over the range 10 - 300 mV/s, it was found that peak height was observed in the scan rate 250 mV/s as it was shown in Figure 7 (Effect of scan rate on AdSV peak current of 1 × 10⁻⁶ M Timolol in pH 3.5 Acetate buffer, accumulation time 30 sec and accumulation potential –0.8 V). However, after this maximum value the peak current started to decrease di- rectly with faster scan rate. Accordingly, 250 mV/s scan rate value was adopted as optimum condition for further investigations. 3.1.4. Effec t of Pulse Amplitude and Freq uency In addition, the impact of varying the excitation wave pulse amplitude on the voltammetric current intensity was also evaluated. The effect of this operating variable was studied over the rang 10 - 120 mV (see Figure 8: Effect of pulse amplitude on the peak current of 1 × 10⁻⁶ M Timolol in pH 3.5 Acetate buffer, accumulation time 30 sec, accumulation potential –0.8 V and 250 mV/s scan Figure 7. Effect of scan rate on AdSV peak current of 1 × 10⁻⁶ M Timolol in pH 3.5 Acetate buffer, accumulation time 30 sec and accumulation potential -0.8 V. Copyright © 2011 SciRes. AJAC  A. F. Al.-GHAMDI 178 Figure 8. Effect of pulse amplitude on the peak current of 1 × 10⁻⁶ M Timolol in pH 3.5 Acetate buffer, accumulation time 30 sec, accumulation potential –0.8 V and 250 mV/s scan rate. rate) and it was concluded that in order to assure maxi- mum peak current, 100 mV pulse amplitude was the ideal choice for this operational parameter. Moreover, varying the value of square wave frequency also plays an impor- tant role for the measured signal of square wave- adsorp- tive stripping voltammetric (SW-AdSV) approach. When the voltammetric peak current of 1 × 10⁻⁶ mol·l–1 timolol drug in acetate buffer pH 3.5 was measured over the range 10 - 50 Hz, as in Figure 9 (Effect of frequency on the peak current of 1 × 10⁻⁶ M Timolol in pH 3.5 Acetate buffer, accumulation time 30 sec, accumulation potential –0.8 V, Scan rate 250 mV/s and pulse amplitude 0.10 V), it was found that peak height was observed at a low fre- quency 10 - 15Hz only, after this value (15Hz) the peak current started to decrease with increasing frequency. Ac- cordingly, for farther work 15 Hz square wave frequency value was adopted. 3.1.5. Effect of Instrumental Parameters The monitored adsorptive stripping voltammetry (AdSV) peak height could be further maximized by optimizing other experimental factors that can affect the adsorption Figure 9. Effect of frequency on the peak current of 1 × 10⁻⁶ M Timolol in pH 3.5 Acetate buffer, accumulation time 30 sec, accumulation potential –0.8 V, Scan rate 250 mV/s and pulse amplitude 0.10 V. process of the formed drug. The influence of both the surface size of the mercury drop working electrode and electrode convection rate was also evaluated. An increase in the surface of the working electrode (over 0.15 - 0.60 mm2) yielded, as expected, a linear enhancement in the analytical signal and did not affect the value of the strip- ping voltammetric potential. In addition, an increase in the stirring rate (raising it from 0.0 to 3000 rpm) yielded, a linear enhancement in the analytical signal from 0.0 to 2000 rpm, after that it is decreased and did not affect the value of the stripping voltammetric potential. Thus, for optimal sensitivity, 0.60 mm2 drop size and 2000 rpm stirring speed were chosen for subsequent practical works (see Figures 10: Effect of electrode area on the peak current of 1 × 10⁻⁶ M Timolol in pH 3.5 Acetate buffer, accumulation time 30 sec, accumulation potential –0.8 V, Scan rate 250 mV/s, pulse amplitude 0.10 V and frequency 15 Hz, Figure 11: Effect of convection rate on the peak current of 1 × 10⁻⁶ M Timolol in pH 3.5 Acetate buffer, accumulation time 30 sec, accumulation potential –0.8 V, Scan rate 250 mV/s, pulse amplitude 0.10 V, frequency 15 Hz and drop size 0.6 mm2). 3.2. Analytical Performance (Method Validation) Once the most ideal and suitable chemical conditions and instrumental parameters for the adsorptive determination were established, a calibration plot for the analyzed drug was recorded to estimate the analytical characteristics of the developed method. 3.2.1. Calib ra t i on Graph Under the optimum conditions a very good linear corre- lation was obtained between the monitored voltammetric peak current and timolol concentration in the range 1 × 10⁻⁷ - 1.5 × 10⁻⁶ mol·l–1, is constant in all measurements, (see Figure 12: SW-AdSV voltammogram for Timolol in acetate buffer, pH = 3.5, Tacc = 30 sec, Eacc = –0.80 V. Figure 10. Effect of electrode area on the peak current of 1 × 10⁻⁶ M Timolol in pH 3.5 Acetate buffer, accumulation time 30 sec, accumulation potential –0.8 V, Scan rate 250 mV/s, pulse amplitude 0.10V and freque nc y 15 Hz. Copyright © 2011 SciRes. AJAC  A. F. Al.-GHAMDI179 Figure 11. Effect of convection rate on the peak current of 1 × 10⁻⁶ M Timolol in pH 3.5 Acetate buffer, accumulation time 30 sec, accumulation potential –0.8 V, Scan rate 250 mV/s, pulse amplitude 0.10V, fre quency 15Hz and drop size 0.6 mm2. Figure 12. SW-AdSV voltammogram for Timolol in acetate buffer, pH = 3.5, Tacc =30 sec, Eacc = –0.80 V. Drug Conc.:- (A = 1 × 10⁻⁷ M, B = 3 × 10⁻⁷ M, C = 5 × 10⁻⁷ M, D = 7 × 10⁻⁷ M, E = 1 × 10⁻⁶ M, F = 1.5 × 10⁻⁶ M). Drug Conc.:- (A = 1 × 10⁻⁷ M, B = 3 × 10⁻⁷ M, C = 5 × 10⁻⁷ M, D = 7 × 10⁻⁷ M, E = 1 × 10⁻⁶ M, F = 1.5 × 10⁻⁶ M). Least-square treatment of the calibration graph yielded the following regression equation: ip (nA) = 53.1 + 3.1 × 10⁸ C (mol l–1) r = 0.998, n = 6. where ip is the adsorptive stripping peak current, C is the analysed drug concentration and r is the correlation coef- ficient. 3.2.2. Detect i o n Li mi t The lowest detectable concentration of this drug was 1.26 × 10⁻⁹ mol·l–1(0.4 ppb), which was estimated based on the signal-to-noise ratio (S/N = 3) and this obtained analytical sensitivity is very promising since it was achieved after employing very short accumulation time (30 s) comparing to that reported for the previous volt- ammetric determination of timolol using differential pulse voltammetry (DPV) technique which required 2.5 ppb detection limit [23]. 3.2.3. Reproducibility The high sensitivity of adsorptive voltammetry is ac- companied by very good reproducibility. This analytical performance was evaluated from eight repeated meas- urements of electrochemical signal of 1 × 10⁻⁶ mol·l–1 ti- molol drug solution. The precision of the electrochemical developed method in terms of the relative standard de- viation (RSD%) was 0.13%. 3.2.4. Accuracy The accuracy of the proposed method was checked by calculating the recovery of known amount of timolol (5 × 10⁻⁷ mol·l–1) solution added to acetate buffer solution and analysed via the optimized stripping voltammetric pro- cedure. The value of the recovery obtained by the stan- dard addition method was 110% ± 1.414. 3.2.5. Stability Under the optimum conditions, the stability of 1 × 10⁻⁶ mol·l–1 timolol solution was evaluated by monitoring the changes in the height of adsorptive stripping voltammet- ric (AdSV) peak over a period of 90 min. The electro- analytical signal was gradually constant with time. The acidic media (pH 3.5) of the acetate electrolyte solution probably initiated a slow degradation process for the drug. 3.3. Interference Studies In order to evaluate the selectivity of the developed AdSV procedure, the influence of various interferences was examined. Considerable interference can be caused by co-existing surface-active compounds capable of com- peting with the analyte of interest for the adsorption site on the electrode surface, resulting in decreased or in- creased peak height. The competitive co-adsorption in- terference was evaluated in the presence of various sub- stance usually occur in the pharmaceutical eye-drops and formulations. For these investigations, the interfering species were added at different concentrations (one, 5-fold and 50-fold) higher than the concentration of ti- molol (1 × 10⁻⁶ mol·l–1). The addition of starch at these concentration levels caused the adsorptive stripping vol- tammetric (AdSV) peak current to decrease by about 3%, 4% and 6%, respectively, of its original peak current. Also the addition of 50-fold of sucrose in the test drug solution (1 × 10⁻⁶ mol·l–1), caused the stripping voltam- metric peak current to decrease by about 8%. Apparently, Copyright © 2011 SciRes. AJAC  A. F. Al.-GHAMDI 180 these inhibition effects were caused by the working elec- trode surface blockage due to adsorption of interferences. In contrast, the addition of 50-fold of lactose in the drug solution, caused the square wave adsorptive stripping voltammetry (SW-AdSV) response of the drug to in- crease by about 16%. 3.4. Practical Applications The reliability of the proposed adsorptive stripping vol- tammetry (AdSV) method for the determination of ti- molol drug was investigated by assaying this drug in some real samples. Following the developed electroana- lytical procedure described above, timolol drug was ana- lysed in pharmaceutical formulation. The timolol content of commercially available eye drop (Ocumol 0.5, Ti- molol 0.5%, 5 mg/ml) was determination directly by the square wave adsorptive stripping voltammetry (SW- AdSV) method after the required dissolving steps. Four aliquots of the dissolved sample were diluted to the re- quired concentration level and measured via the standard additions approach. For these studies, results obtained gave a recovery mean 80% with standard deviation of ± 2.94%. As can be seen from Table 1 (Analysis of Ti- molol drug in its commercial eye drop). In addition, the applicability of the stripping voltam- metric procedure for the analysis of timolol drug in bio- logical samples was also evaluated by estimating its re- coveries from spiked human urine and serum samples. A simple and fast pretreatment (clean-up) procedure, which is in fact a slight modification of the sample preparation method develop for the determination of some antagonist drugs [25] was used. By adding a small amount of 5% ZnSO4·7H2O solution, NaOH and methanol to the serum sample and centrifuging the mixture, most of the inter- fering substances (mainly proteins) were simply removed and eliminated by precipitation. As can be extracted from Table 2 (Analytical results for timolol drug recoveries from urine and serum samples), this adsorptive stripping voltammetric (AdSV) method (after appropriate dilution) allowed the determination of timolol drug in urine and Table 1. Analysis of Timolol drug in its commercial eye drop. Found (mg) Recovery % Labeled 3.85 77 Content 3.90 78 5 mg/ml 4.10 82 Timolol 4.15 83 Mean 80 Standard Deviation ±2.94 Table 2. Analytical results for timolol drug recoveries from urine and serum samples. Recovery%: Spiked Urine Spiked Serum 86 108 88 107 Added Timolol 85 109 5.0 × 10⁻⁷ mol·l–1 89 106 Means 87 107.5 Standard Deviations±1.83 ±1.3 serum samples with mean recoveries 87% ± 1.83 and 107.5% ± kmi 1.3, respectively. 4. Conclusions Voltammetric methods have proved to be very sensitive for the determination of organic molecules, including drugs and related molecules in pharmaceutical dosage forms. These techniques have several advantages, in- cluding that they are quick and reproducible, present low limits of detection and quantification and have relatively low cost compared with the more traditional techniques. Moreover, they provide a better discrimination against background currents. In this study, a new, simple, selective, accurate and precise SW-AdSV method developed for the determina- tion of Timolol in pharmaceutical formulation. In this study, all experimental and instrumental parameters were optimized, as their values strongly affect the sensitivity of the voltammetry. The peak current was investigated using differential pulse polarography and cyclic voltam- metry. The electrochemical reduction of Timolol is an irreversible process controlled by adsorption under the conditions described in this work. The proposed method with the optimized parameters demonstrated a good lin- ear relationship between the peak current and the Ti- molol concentration for a wide range of concentration. The applicability of the proposed procedure was tested using a commercial pharmaceutical formulation of Ti- molol. This drug was quantified in the pharmaceutical preparation and biological fluids such as serum and urine, and no pretreatment or time - consuming extraction was required prior to the analysis. The results are in good agreement with the labeled values. Accuracy and selec- tivity of the developed method were demonstrated by recovery studies. Reproducibility, stability, and interfer- ences studies of this proposed method suggest that this method could be used in quality control analysis, clinical laboratories, and pharmacokinetic studies. Copyright © 2011 SciRes. AJAC  A. F. Al.-GHAMDI Copyright © 2011 SciRes. AJAC 181 5. Acknowledgements I would like to thank Prof. Mohammed Hefnawy and Prof. Mohammed Al-Omar at King Saud University for their assistances. 6. References [1] J. Wang, “Analytical Electrochemistry,” 2nd Edition, VCH Publishers, Inc., New York, 1994, pp. 44-54. [2] K. H. Brainina and E. Neyman, “Electroanalytical Strip- ping Methods,” John Wiley and Sons, New York, 1993, pp. 71-120. [3] J. Wang, “Stripping Analysis: Principles, Instrumentation and applications,” VCH Publishers Inc., New York, 1985, pp. 1-160 [4] R. Kalvoda, “Adsorptive Stripping Voltammetry in Ana- lytical Chemistry II,” Ellis Horwood, New York, 1996. [5] J. Wang, “Electroanalytical Techniques in Clinical Che- mistry and Laboratory Medicine,” VCH Publishers Inc., New York, 1988, pp. 17-20. [6] P. M. Zaitsev, R. M. Salikhdzhanova and N. K. Zaitsev, “Use of Adsorption Voltammetry in Trace Analysis of Inorganic Ions,” Industrial Laboratory, Vol. 65, No. 1, 1999, pp. 1-15. [7] A. Z. Abu Zuhri and W. Voelter, “Applications of Ad- sorptive Stripping Voltammetry for the Trace Analysis of Metals, Pharmaceuticals and Biomolecules,” Fresenius' Journal of Analytical Chemistry, Vol. 360, No. 1, 1998, pp. 1-9. doi:10.1007/s002160050633 [8] K. H. Brainina, N. A. Malakhova and N. Y. Stojko, “Stripping Voltammetry in Environmental and Food Analysis,” Fresenius' Journal of Analytical Chemistry, Vol. 368, No. 4, 2000, pp. 307-325. doi:10.1007/s002160000525 [9] N. S. Abdul, S. Afzal, A. M. Sarfraz and R. Abdul, “Ad- sorptive Stripping Voltammetric Determination of Hy- droquinone Using an Electrochemically Pretreated Glassy Carbon Electrode,” Pakistan Journal of Analytical Envi- ronmental Chemistry, Vol. 9, No. 2, 2008, pp. 110-117. [10] A. H. Alghamdi, “Square-Wave Adsorptive Stripping Voltammetric Determination of an Antihistamine Drug Astemizole,” Chemical Papers, Vol. 62, No. 4, 2002, pp. 339-344. [11] J. C. Vire, J. M. Kauffmann and G. J. Patriarche, “Ad- sorptive Stripping Voltammetry Applied to Drug Analy- sis: A Powerful Tool,” Journal of Pharmaceutical and Biomedical Analysis, Vol. 7, No. 12, 1998, pp. 1323- 1335. [12] M. M. Ghoneim, A. M. Beltagi and A. Radi, “Square- Wave Adsorptive Stripping Voltammetric Determination of the Anti-Inflammatory Drug Lornoxicam,” Analytical Sciences, Vol. 18, No. 2, 2002, p.183. [13] O. A. Farghaly, “Adsorptive Stripping Voltammetric Determination of the Antidepressant Drug Sulpiride,” Journal of Pharmaceutical and Biomedical Analysis, Vol. 23, No. 5, October 2000, pp. 783-791. doi:10.1016/S0731-7085(00)00376-9 [14] A. H. Alghamdi, M. A. Alshadokhy and A. A. Alwarthan, “Development of Adsorptive Stripping Voltammetric Procedure for the Determination of Josamycin, a Mac- rolide Antibiotic,” Jordan Journal of Chemistry, Vol. 1, No. 2, 2006, pp. 171-182. [15] B. Susan, “The Merck Index,” 12th Edition, Whitehouse Station, Merck& Co., Inc., New Jersey, 1996. [16] E. F. K. James, “Matrindale the Extra Pharmacopoeia,” 31st Edition, Royal Pharmaceutical Society, London, 1996. [17] M. M. Ayad, A. Shalaby, H. E. Abdellatef and M. M. Hosny, “Spectrophotometric Methods for Determination of Enalapril and Timolol in Bulk and in Drug Formula- tions,” Analytical and Bioanalytical Chemistry, Vol. 375, No. 4, 2003, pp. 556-560. [18] S. P. Agarwal, V. Singhal and A. Prakash, “Spectropho- tometric Determination of Atenolol and Timolol Dosage forms via Charge-Transfer Complexation,” Indian Jour- nal of Pharmaceutical Science, Vol. 60, No. 1, 1998, pp. 53-55. [19] M. L. Sataf, J. Robles, H. C. Goicoechea and A. C. Oliv- ier, “Simultaneous Determination of Timolol Maleate and Pilocarpine Hydrochloride in Ophthalmic Solutions by First Derivative UV Spectrophotometry and PLS-1 Mul- tivariate Calibration,” Analytical Letters, Vol. 32, No. 10, 1999, pp. 2019-2033. doi:10.1080/00032719908542949 [20] S. P. Kulkarni and P. D. Amin, “Stability Indicating HPTLC Determination of Timolol Maleate as Bulk Drug and in Pharmaceutical Preparations,” Journal of Phar- maceutical and Biomedical Analysis, Vol. 23, No. 6, 2000, pp. 983-987. doi:10.1016/S0731-7085(00)00389-7 [21] T. V. Olah, J. D. Gilbert and A. Barrish, “Determination of the β-Adrenergic Blocker Timolol in Plasma by Liquid Chromatography—Atmospheric Pressure Chemical Ioniza- tion Mass Spectrometry,” Journal of Pharmaceutical and Biomedical Analysis, Vol. 11, No. 2, 1993, pp. 157-163. [22] H. B. He, I. E. Timi and J. J. Alastrair, “Determination of Low Plasma Timolol Concentrations Following Topical Application of Timolol Eye Drops in Humans by High-Performance Liquid Chromatography with Elec- trochemical Detection,” Journal of Chromatography B: Biomedical Science Applications, Vol. 661, No. 2, No- vember 1994, pp. 351-356. [23] M. H. Urkdemir, G. Erdogdu, T. Aydemir, A. A. Kara- gozler and A. E. Karagozler, Journal of Analytical Che- mistry, Vol. 56, 2001, pp. 1047-1050. [24] C. M. Van den Berg, “The Determination of Nanomolar Levels of Nitrite in Fresh and Sea Water by Cathodic Stripping Voltammetry,” Analytical Chemica Acta, Vol. 212, 1988, pp. 31-41. [25] G. Stubauer and D. Obendorf, “Determination of Trace Levels of Niguldipine in Urine and Blood by Adsorptive Stripping Voltammetry at the Hanging Mercury Drop Electrode,” Analyst, Vol. 121, No. 3, 1996, pp. 351-356. |