

Paper Menu >>
Journal Menu >>
 International Journal of Geosciences, 2011, 2, 111-119 doi:10.4236/ijg.2011.22012 Published Online May 2011 (http://www.SciRP.org/journal/ijg) Copyright © 2011 SciRes. IJG Beach Morphology and Sediment Budget Variability Based on High Quality Digital Elevation Models Derived from Field Data Sets Mohammed Taaouati*, Abdelmounim El Mrini, Driss Nachite Department of Geology, Abdelmalek Essaâdi University, Tétouan, Morocco E-mail: [email protected] Received January 11, 2011; revised February 17, 2011; accepted March 22, 2011 Abstract The morphological and volumetric changes of a sandy beach were investigated through a series of two- monthly filed surveys carried out over a 2-year period from April 2005 to January 2007. This paper discusses the ability of 3-D digital elevation models (DEMs) derived from high accurate data to assess and quantify beach morphodynamics in relation with wave forcing. The methodology and data acquisition are described and consist mainly in the production of interpolated DEMs from which a variety of representations can be made, including as elevation change maps, two-dimensional cross-sections of the beach, and calculation of net volume. The results of the analysis highlight seasonal changes in beach morphology due to variations in wave energy. This behavior is characterized by beach erosion and bar decay under high-energy waves and net accretion and bar formation during relatively fair weather conditions. The sand budgets adjustments show that the loss of volume in the winter months is compensated for by accumulation to the beach during summer. This trend suggests that waves are the main forcing which controls the beach evolution. The correlation be- tween beach changes and wave energy variations highlights a strong relationship between them and supports the suggestion previously made. The results from this investigation state the value of DEMs utilized and demonstrate the efficiency of the 3-D approach employed here to assess the erosion and accretion patterns which would not be visualized using 2-D profiles. Keywords: Moroccan Coast, Beach Change, Wave Forcing, Digital Elevation Model, 3-D Approach 1. Introduction Sandy beaches are difficult landforms to study because of the complex interaction between morphology, sedi- ment and hydrodynamic forcing, which makes these en- vironments very dynamic and moving systems. Many authors have worked on the spatial and temporal evolution of beach morphology using several models, classification and indices [1]. Unfortunately, little suc- cess has been obtained when using such models because of the complexity of beach systems [2]. An alternative approach is to repeatedly measure the beach topography over time to evaluate the changes that have taken place [2]. Nowadays, high-resolution techniques (satellites, ae- rial photographs, LIDAR, etc.) allow for improved monitoring and provide coverage of large sections of coastal systems. Although the excellent resolution of the data obtained, some limitations (cost, enormous data sets) restrict the use of such techniques. Field surveys remain the best way to frequently collect topographic data. The most common technique used is beach topographic pro- filing or 3D surveying [3], which is the case of the pre- sent work. On the other hand, the data collected must be repre- sented appropriately in order to keep as much as possible the field reality. The digital elevation model (DEM) is a numerical representation of beach topography, which is widely used throughout geomorphologic and environ- mental studies [4,5]. In coastal areas, DEMs have been utilized in many analyses such as topographic distribu- tion, slope variations, estimation of scour and/or fill volumes. The present work aims to apply DEMs, derived from accurate topographic data, to identify seasonal morpho- logic change in a mesotidal high-energy beach, located 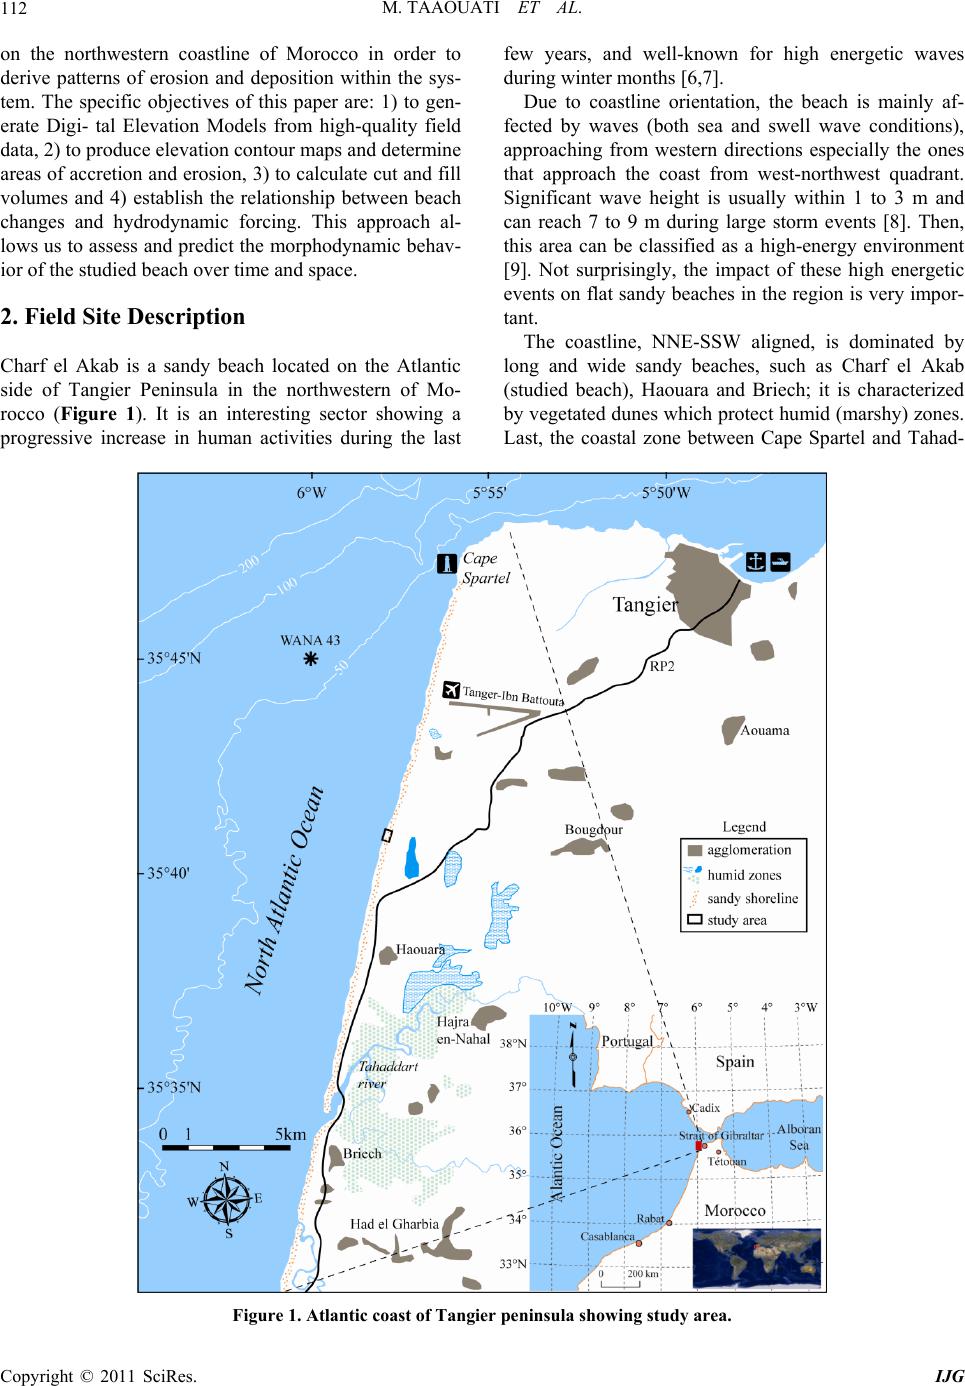 M. TAAOUATI ET AL. 112 on the northwestern coastline of Morocco in order to derive patterns of erosion and deposition within the sys- tem. The specific objectives of this paper are: 1) to gen- erate Digi- tal Elevation Models from high-quality field data, 2) to produce elevation contour maps and determine areas of accretion and erosion, 3) to calculate cut and fill volumes and 4) establish the relationship between beach changes and hydrodynamic forcing. This approach al- lows us to assess and predict the morphodynamic behav- ior of the studied beach over time and space. 2. Field Site Description Charf el Akab is a sandy beach located on the Atlantic side of Tangier Peninsula in the northwestern of Mo- rocco (Figure 1). It is an interesting sector showing a progressive increase in human activities during the last few years, and well-known for high energetic waves during winter months [6,7]. Due to coastline orientation, the beach is mainly af- fected by waves (both sea and swell wave conditions), approaching from western directions especially the ones that approach the coast from west-northwest quadrant. Significant wave height is usually within 1 to 3 m and can reach 7 to 9 m during large storm events [8]. Then, this area can be classified as a high-energy environment [9]. Not surprisingly, the impact of these high energetic events on flat sandy beaches in the region is very impor- tant. The coastline, NNE-SSW aligned, is dominated by long and wide sandy beaches, such as Charf el Akab (studied beach), Haouara and Briech; it is characterized by vegetated dunes which protect humid (marshy) zones. Last, the coastal zone between Cape Spartel and Tahad- Figure 1. Atlantic coast of Tangier peninsula showing study area. Copyright © 2011 SciRes. IJG  M. TAAOUATI ET AL. Copyright © 2011 SciRes. IJG 113 dart is drained by rivers, notably Tahaddart, which carry terrigenous sediments towards the continental shelf [6]. Charf el Akab is an approximately 2 km long and 200 m wide beach. Throughout this beach is present a wide vegetated foredune and rocky outcrops in many places along the backbeach (Figure 2(a)). The study area (200 × 250 m) is characterized by many features formed by wind, tide and wave processes. Sand shadows are usually found on the backshore of Charf el Akab beach, especially when strong offshore winds prevail in the studied area. They are associated with pebbles, shells and considerable heavy minerals fractions (Figure 2(b)). The foreshore zone exhibits a wide variety of beach features such as swash marks, ripples, etc. The most usual are the rill marks which are formed by water drainage in the rip channels. One of the main features of Charf el Akab site is an intertidal bar which is provisionally present at the mid- and upper beach (Figure 2(c)). 3. Data and Methods Below, we present the data analysis methods used herein in order to characterize the hydrodynamic (wave) condi- tions, beach morphology and sediment budget variability. The data analysis involved mainly 1) seasonal charac- terization of beach morphology and offshore wave forc- ing, and 2) exploring for evident correlation between them. 3.1. Wave Data Wave data provided by Puertos del Estado (Ministry of Public Works, Spain).were utilized to characterize the wave conditions during survey period. Data are collected from an offshore point “WANA43” (35°45' N, 6° W) located near the study beach at approximately 70 m depth (Figure 1). These data are daily wave forecast output from the WAM wave model [10] and do not come from direct measurements. However, the data are useful and reliable since the objective is to analyze the wave climate at seasonal time scale. The wave data sets ana- lyzed cover a two-year period from 2005 to 2007 and consist of sig- nificant wave height (Hs), wave period (Tp) and wave direction (θ). The WANA data analysis was de- Figure 2. Ground photographs of beach morphologies in Charf el Akab site.  M. TAAOUATI ET AL. Copyright © 2011 SciRes. IJG 114 signated to characterize the general offshore wave condi- tions in the study area throughout the period of beach monitoring. The wave data are represented by frequency histograms for the 2-year period. Additionally, the significant wave height and the cor- responding period were identified and compared with the beach changes for correspondence analysis. The under- lying question was what value should be used to properly represent the wave forcing as it pertains to morphologi- cal evolution. Thus, considering that the morphology responds more rapidly to the more energetic events, the significant wave height and the corresponding wave pe- riod were chosen. These values were then used to calcu- late the wave energy flux or wave power “P” using the following expression [11]: 22 32 π g HT P with, ρ is the sea water density 1025 kg/m3 and H and T are the offshore wave height and period, respectively. 3.2. Topographic Data Almost two years of beach surveying was conducted on Charf el Akab site. A 3D topographic mapping was made using GTS-TOPCON 225, a high resolution laser total station, at two-monthly and/or seasonal intervals through- out the study period. In this study, we obtained highly accurate vertical (±2 cm) as well as horizontal (±5 cm) position estimates, which allow us to recommend GTS- TOPCON 225 as a highly effective tool for beach moni- toring. Previously, many authors [12,13] stated that ground survey, using GPS and Total Station techniques give the best accuracy in elevation measurements. Then, the DEMs established from such data sets seem to be more representative of the field reality and the calcula- tion of sediment budget is reliable [2]. Each of the 9 surveys covered most of the beach from the dune to just below the waterline. The elevation points measured are referenced to a benchmark installed at the foot of the dune. The collected data were interpolated using triangulation with linear interpolation (TLI) and converted into a grid with 2 m cell spacing. The grids are used to produce the DEMs for which the quality (preci- sion) is assessed. Precision is usually evaluated by indi- ces with no spatial dimension such as the mean error or the root mean square error [4]. In this study, In this study, estimated height from the selected interpolation tech- nique was compared at each point to observed height using a cross-validate option in a basic mapping software program SURFER® (Golden Software, Golden, CO). An empirically derived error margin of 5 cm, covering both field measurement and data interpolation, was applied to the raw data. 4. Results 4.1. Hydrodynamic Characterization Wave climate for the period 2005 – 2007 was character- rized by conducting a statistical analysis of the data sets corresponding to the “wana43” point. Results shown in Figure 3 indicate that the most likely waves come from the W quadrant, with almost 90% of the incident angle of the incoming waves range between SW and NW. The most frequent wave directions are WNW and W, which represent approximately 60% and 24%, respectively. With respect to the wave energy, the most frequent (45%) significant wave height is between 0.5 m and 1 m, and 93.5% of the time the wave height is below 2 m. During the study period the significant wave energy exceeded rarely (6.5%) 2 m, but the occurrence of such “storm” events can affect strongly the beach morphology. The most likely wave periods are within 8 to 12 s and 65% of the time the wave period is above 8 s. In order to characterize energy conditions just before the surveying times, significant events were identified and the wave height and period were chosen to determine the corresponding energy level (Table 1). The results show that the offshore waves are characterized by a mean significant wave height and period of 2 m and 9 s, respectively. However, considerable annual variation in the wave conditions is experienced (Table 1). Mean sig- nificant wave conditions in winter (January - March) are characterized by a wave height of 2.85 m and a period of 13.4 s. Mean significant wave conditions in summer (June - September) are characterized by a wave height of 1.6 m and a period of 6.7 s, which remain, however, rela- tively energetic conditions. Table 1. Offshore wave energy conditions. Survey times Hs (m) Tp (s) P (kgms−3) 23/04/2005 1.8 13.4 42 618 22/06/2005 2 9.4 36 915 24/09/2005 1.4 6.3 12 124 07/01/2006 2.5 12.3 75 472 04/03/2006 3.2 14.5 145 767 29/04/2006 1.2 7 9 896 27/06/2006 1.3 5.3 8 792 09/09/2006 2 6.5 25 526 20/01/2007 2.5 7.5 46 019 Mean 1.99 9.13 44 792 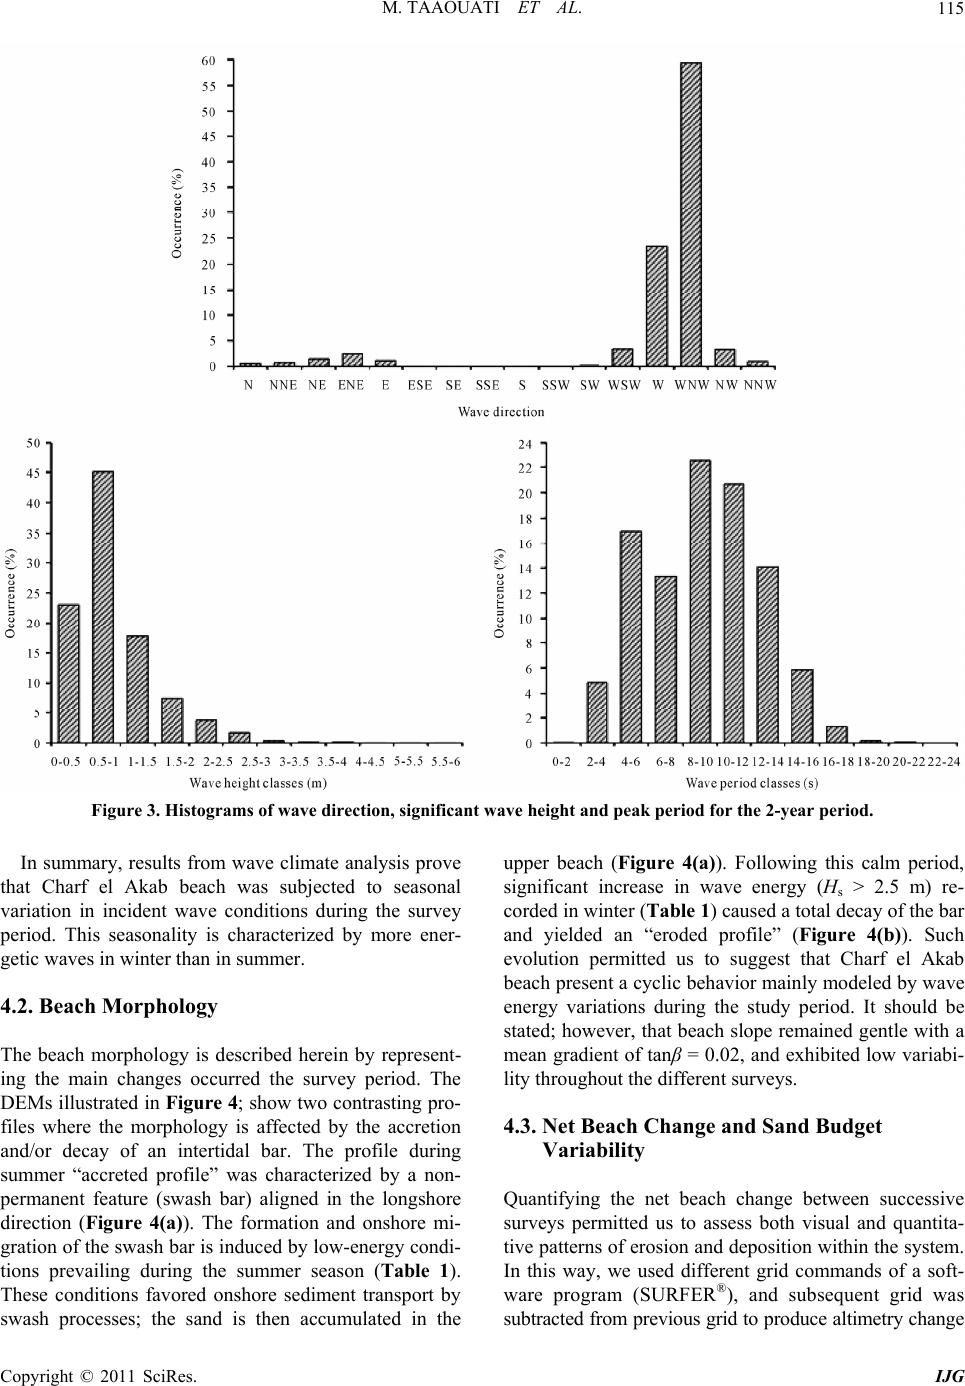 M. TAAOUATI ET AL. Copyright © 2011 SciRes. IJG 115 Figure 3. Histograms of wave direction, significant wave height and peak period for the 2-year period. In summary, results from wave climate analysis prove that Charf el Akab beach was subjected to seasonal variation in incident wave conditions during the survey period. This seasonality is characterized by more ener- getic waves in winter than in summer. 4.2. Beach Morphology The beach morphology is described herein by represent- ing the main changes occurred the survey period. The DEMs illustrated in Figure 4; show two contrasting pro- files where the morphology is affected by the accretion and/or decay of an intertidal bar. The profile during summer “accreted profile” was characterized by a non- permanent feature (swash bar) aligned in the longshore direction (Figure 4(a)). The formation and onshore mi- gration of the swash bar is induced by low-energy condi- tions prevailing during the summer season (Table 1). These conditions favored onshore sediment transport by swash processes; the sand is then accumulated in the upper beach (Figure 4(a)). Following this calm period, significant increase in wave energy (Hs > 2.5 m) re- corded in winter (Table 1 ) caused a total decay of the bar and yielded an “eroded profile” (Figure 4(b)). Such evolution permitted us to suggest that Charf el Akab beach present a cyclic behavior mainly modeled by wave energy variations during the study period. It should be stated; however, that beach slope remained gentle with a mean gradient of tanβ = 0.02, and exhibited low variabi- lity throughout the different surveys. 4.3. Net Beach Change and Sand Budget Variability Quantifying the net beach change between successive surveys permitted us to assess both visual and quantita- tive patterns of erosion and deposition within the system. In this way, we used different grid commands of a soft- ware program (SURFER®), and subsequent grid was subtracted from previous grid to produce altimetry change 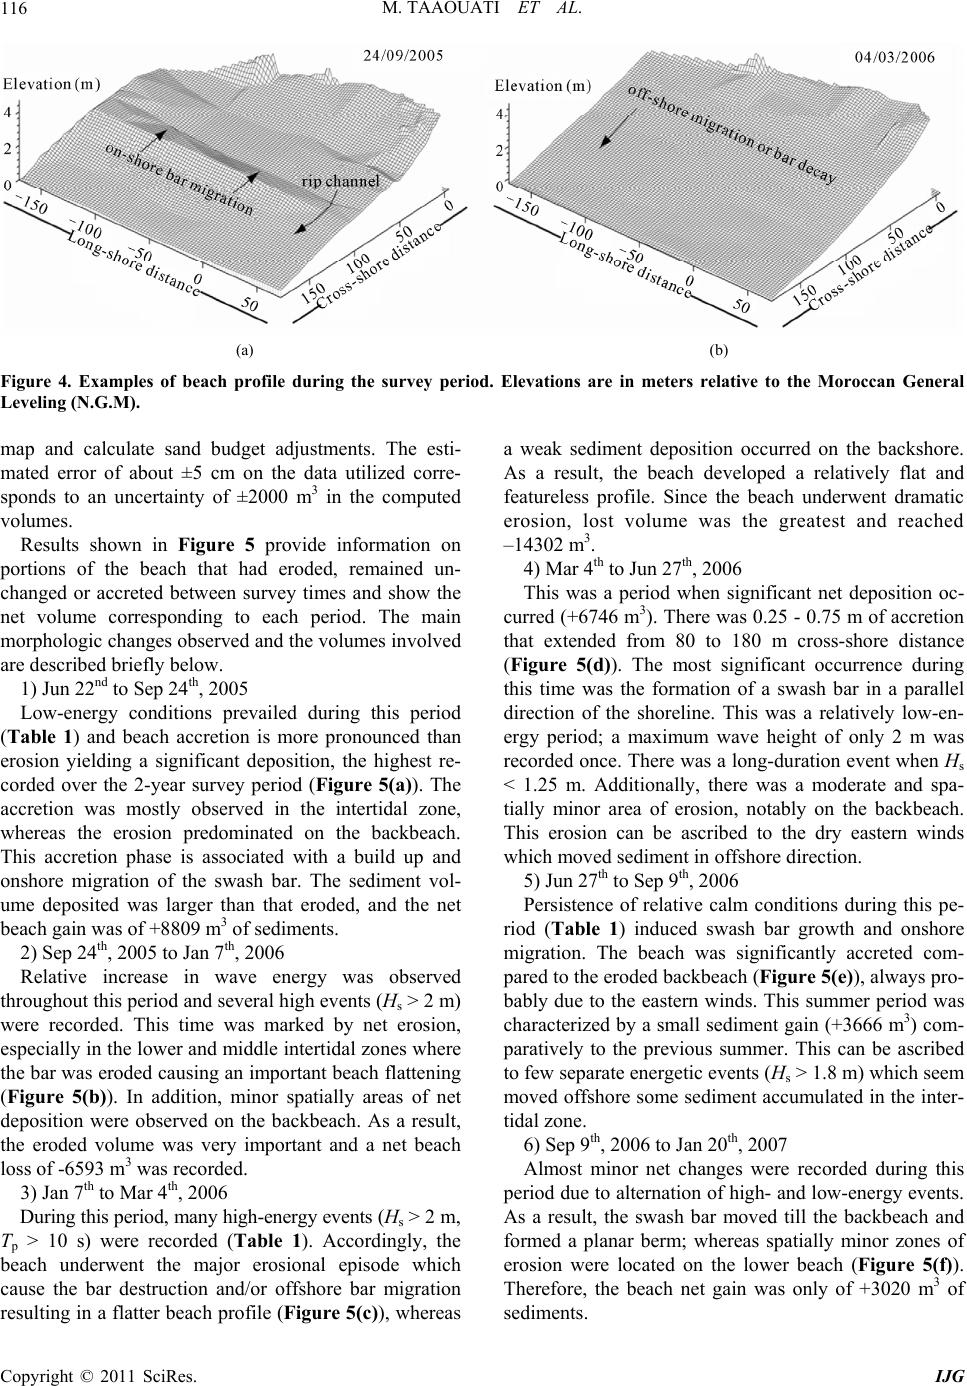 M. TAAOUATI ET AL. Copyright © 2011 SciRes. IJG 116 (a) (b) Figure 4. Examples of beach profile during the survey period. Elevations are in meters relative to the Moroccan General Leveling (N.G.M). map and calculate sand budget adjustments. The esti- mated error of about ±5 cm on the data utilized corre- sponds to an uncertainty of ±2000 m3 in the computed volumes. Results shown in Figure 5 provide information on portions of the beach that had eroded, remained un- changed or accreted between survey times and show the net volume corresponding to each period. The main morphologic changes observed and the volumes involved are described briefly below. 1) Jun 22nd to Sep 24th, 2005 Low-energy conditions prevailed during this period (Table 1) and beach accretion is more pronounced than erosion yielding a significant deposition, the highest re- corded over the 2-year survey period (Figure 5(a)). The accretion was mostly observed in the intertidal zone, whereas the erosion predominated on the backbeach. This accretion phase is associated with a build up and onshore migration of the swash bar. The sediment vol- ume deposited was larger than that eroded, and the net beach gain was of +8809 m3 of sediments. 2) Sep 24th, 2005 to Jan 7th, 2006 Relative increase in wave energy was observed throughout this period and several high events (Hs > 2 m) were recorded. This time was marked by net erosion, especially in the lower and middle intertidal zones where the bar was eroded causing an important beach flattening (Figure 5(b)). In addition, minor spatially areas of net deposition were observed on the backbeach. As a result, the eroded volume was very important and a net beach loss of -6593 m3 was recorded. 3) Jan 7th to Mar 4th, 2006 During this period, many high-energy events (Hs > 2 m, Tp > 10 s) were recorded (Table 1). Accordingly, the beach underwent the major erosional episode which cause the bar destruction and/or offshore bar migration resulting in a flatter beach profile (Figure 5(c)), whereas a weak sediment deposition occurred on the backshore. As a result, the beach developed a relatively flat and featureless profile. Since the beach underwent dramatic erosion, lost volume was the greatest and reached –14302 m3. 4) Mar 4th to Jun 27th, 2006 This was a period when significant net deposition oc- curred (+6746 m3). There was 0.25 - 0.75 m of accretion that extended from 80 to 180 m cross-shore distance (Figure 5(d)). The most significant occurrence during this time was the formation of a swash bar in a parallel direction of the shoreline. This was a relatively low-en- ergy period; a maximum wave height of only 2 m was recorded once. There was a long-duration event when Hs < 1.25 m. Additionally, there was a moderate and spa- tially minor area of erosion, notably on the backbeach. This erosion can be ascribed to the dry eastern winds which moved sediment in offshore direction. 5) Jun 27th to Sep 9th, 2006 Persistence of relative calm conditions during this pe- riod (Table 1) induced swash bar growth and onshore migration. The beach was significantly accreted com- pared to the eroded backbeach (Figure 5(e)), always pro- bably due to the eastern winds. This summer period was characterized by a small sediment gain (+3666 m3) com- paratively to the previous summer. This can be ascribed to few separate energetic events (Hs > 1.8 m) which seem moved offshore some sediment accumulated in the inter- tidal zone. 6) Sep 9th, 2006 to Jan 20th, 2007 Almost minor net changes were recorded during this period due to alternation of high- and low-energy events. As a result, the swash bar moved till the backbeach and formed a planar berm; whereas spatially minor zones of erosion were located on the lower beach (Figure 5(f)). Therefore, the beach net gain was only of +3020 m3 of ediments. s 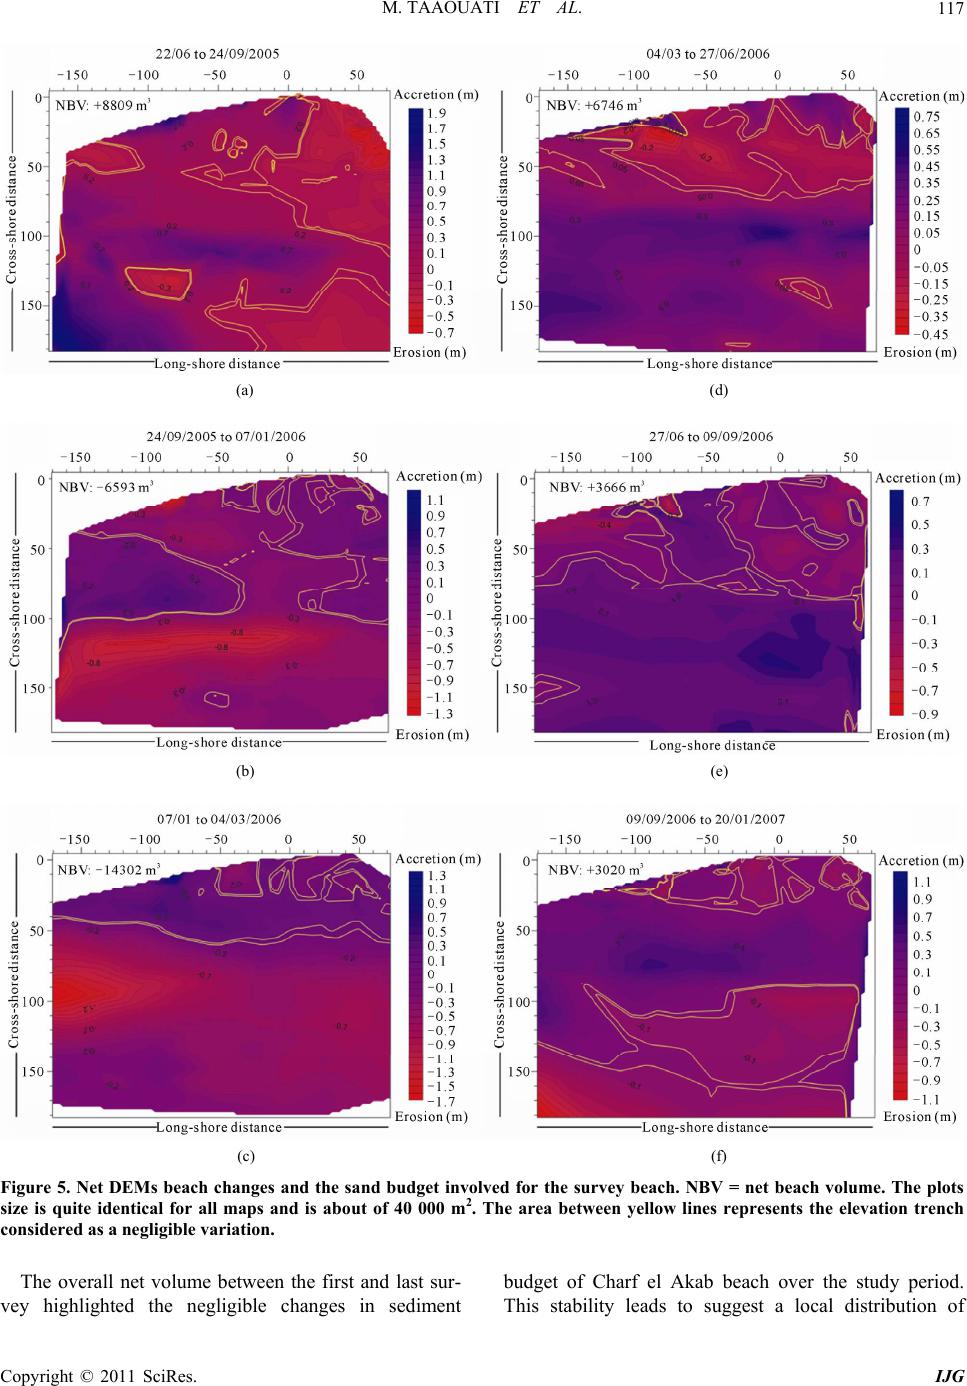 M. TAAOUATI ET AL. Copyright © 2011 SciRes. IJG 117 (a) (d) (b) (e) (c) (f) Figure 5. Net DEMs beach changes and the sand budget involved for the survey beach. NBV = net beach volume. The plots size is quite identical for all maps and is about of 40 000 m2. The area between yellow lines represents the elevation trench considered as a negligible variation. The overall net volume between the first and last sur- vey highlighted the negligible changes in sediment budget of Charf el Akab beach over the study period. This stability leads to suggest a local distribution of 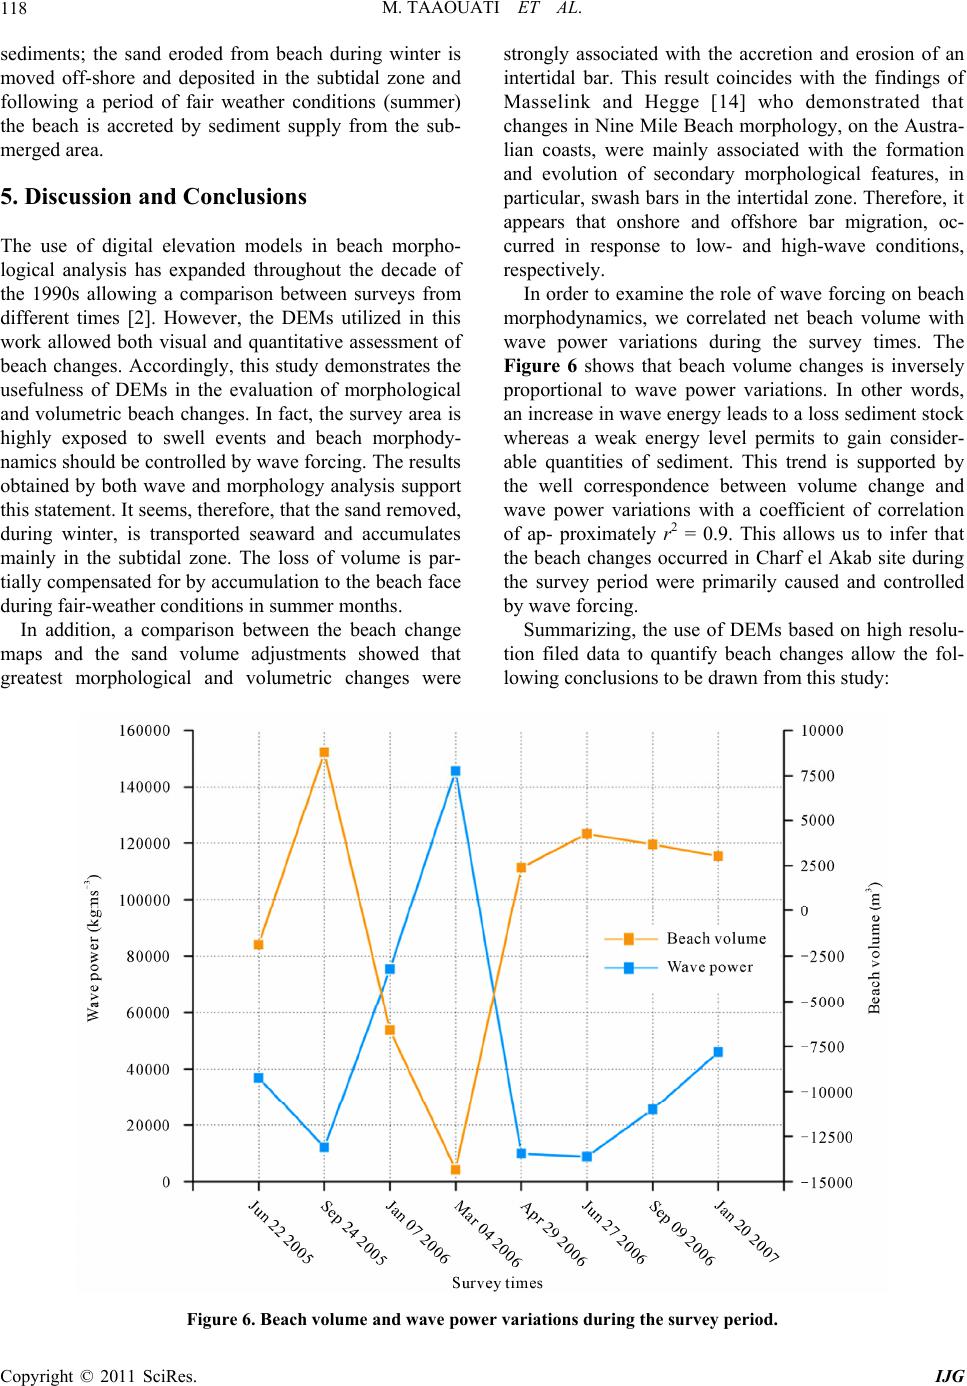 M. TAAOUATI ET AL. 118 sediments; the sand eroded from beach during winter is moved off-shore and deposited in the subtidal zone and following a period of fair weather conditions (summer) the beach is accreted by sediment supply from the sub- merged area. 5. Discussion and Conclusions The use of digital elevation models in beach morpho- logical analysis has expanded throughout the decade of the 1990s allowing a comparison between surveys from different times [2]. However, the DEMs utilized in this work allowed both visual and quantitative assessment of beach changes. Accordingly, this study demonstrates the usefulness of DEMs in the evaluation of morphological and volumetric beach changes. In fact, the survey area is highly exposed to swell events and beach morphody- namics should be controlled by wave forcing. The results obtained by both wave and morphology analysis support this statement. It seems, therefore, that the sand removed, during winter, is transported seaward and accumulates mainly in the subtidal zone. The loss of volume is par- tially compensated for by accumulation to the beach face during fair-weather conditions in summer months. In addition, a comparison between the beach change maps and the sand volume adjustments showed that greatest morphological and volumetric changes were strongly associated with the accretion and erosion of an intertidal bar. This result coincides with the findings of Masselink and Hegge [14] who demonstrated that changes in Nine Mile Beach morphology, on the Austra- lian coasts, were mainly associated with the formation and evolution of secondary morphological features, in particular, swash bars in the intertidal zone. Therefore, it appears that onshore and offshore bar migration, oc- curred in response to low- and high-wave conditions, respectively. In order to examine the role of wave forcing on beach morphodynamics, we correlated net beach volume with wave power variations during the survey times. The Figure 6 shows that beach volume changes is inversely proportional to wave power variations. In other words, an increase in wave energy leads to a loss sediment stock whereas a weak energy level permits to gain consider- able quantities of sediment. This trend is supported by the well correspondence between volume change and wave power variations with a coefficient of correlation of ap- proximately r2 = 0.9. This allows us to infer that the beach changes occurred in Charf el Akab site during the survey period were primarily caused and controlled by wave forcing. Summarizing, the use of DEMs based on high resolu- tion filed data to quantify beach changes allow the fol- lowing conclusions to be drawn from this study: Figure 6. Beach volume and wave power variations during the survey period. Copyright © 2011 SciRes. IJG  M. TAAOUATI ET AL. Copyright © 2011 SciRes. IJG 119 1) Charf el Akab beach presented almost seasonal be- havior during the study period; 2) this trend consisted in net accretion during low- en- ergy conditions (summer) and beach erosion and flatten- ing due to high wave energy in winter months; 3) the sediment budget variations were found to be strongly influenced by seasonal changes in wave energy; and 4) the 3-D DEM employed here is valuable tool with which morphological and volumetric changes can be clearly visualized and quantified. Finally, this investigation presents an effective method of determining beach accretion and/or erosion from high-resolution spatial data which enables accurate three-dimensional DEMs production. The results from the present work support this suggestion since the vol- ume change calculated from DEMs, were highly corre- lated to variations in wave forcing. These dynamics would not be identifiable using two-dimensional profiles and this em- phasizes the value of the three-dimensional DEMs uti- lized in this study. 6. Acknowledgements This work was funded by the Moroccan PROTARS III D16/07 program research. The principal author was sponsored by a PhD studentship provided by the Na- tional Center for Scientific and Technical Research of Morocco. Authors are grateful to the anonymous re- viewers for their constructive remarks and suggestions for improvement. 7. References [1] M. Ortega-Sánchez, et al., “Relation between Beachface Morphology and Wave Climate at Trafalgar Beach (Cádiz, Spain),” Geomorphology, Vol. 99, No. 1-4, 2008, pp. 171-185. [2] B. D. Andrews, P. A. Gares and J. D. Colby, “Techniques for GIS Modeling of Coastal Dunes,” Geomorphology, Vol. 48, No. 1-3, 2002, pp. 289-308. doi:10.1016/S0169-555X(02)00186-1 [3] G. Anfuso, J. A. Martínez del Pozo, D. Nachite, J. Benavente and A. Macias, “Morphological Characteristics and Med- ium-Term Evolution of the Beaches between Ceuta and Cabo Negro (Morocco),” Environmental Geology, Vol. 52, No. 5, 2007, pp. 933-946. doi:10.1007/s00254-006-0535-3 [4] V. Chaplot, F. Darboux, H. Bourennane, S. Leguédois, N. Silvera and K. Phachomphon, “Accuracy of Interpolation Techniques for the Derivation of Digital Elevation Mo- dels in Relation to Landform Types and Data Density,” Geomorphology, Vol. 77, No. 1-2, 2006, pp. 126-141. doi:10.1016/j.geomorph.2005.12.010 [5] G. L. Heritage, D. J. Milan, A. R. G. Large and I. C. Fuller, “Influence of Survey Strategy and Interpolation Model on DEM Quality,” Geomorphology, Vol. 112, No. 3-4, 2009, pp. 334-344. doi:10.1016/j.geomorph.2009.06.024 [6] F. Duplantier and P. Lesueur, “Les Sables du Littoral Atlantique Nord-Marocain: Origines et Mode de Mise en Place [Sand on the North-Moroccan Atlantic Coast: Origins and Depositional Modes],” Bulletin de l’Institut Géologique du Bassin d’Aquitaine, Vol. 33, 1983, pp. 5-24. [7] P. Cirac, A. D. Resseguier and O. Weber, “Situation Cou- rantologique et Hydrologique Sur le Plateau Continental Atlantique Nord-Marocain: Mission Géomar II [Hy- drological structure on the North Atlantic Moroccan Shelf: Cruises Géomar II],” Bulletin de l’Institut Géologique du Bassin d’Aquitaine, Vol. 46, 1989, pp. 81-95. [8] E. B. Jaaidi and P. Cirac, “La Couverture Sédimentaire Meuble du Plateau Continental Atlantique Marocain Entre Larache et Agadir [The soft Sedimentary Cover of the Moroccan Atlantic Continental Shelf between Larache and Agadir],” Bulletin de l’Institut Géologique du Bassin d’Aquitaine, Vol. 42, 1987, pp. 33-51. [9] M. Taaouati, D. Nachite, J. Benavente and A. E. Mrini, “Seasonal Changes and Morphodynamic Behavior of a High-Energy Mesotidal Beach: Case Study of Charf el Akab Beach on the North Atlantic Coast of Morocco,” Environmental Earth Sciences, submitted for publication, 2011. doi: 10.1007/s12665-011-0937-8 [10] H. Günther, S. Hasselmann and P. A. E. M. Janssen, “The WAM Model Cycle 4 (Revised Version),” Technical Re- port, Deutsches Klima Rechenzentrum, Hamburg, 1992. [11] USACE, “Coastal Hydrodynamics,” Coastal Engineering Manual, No. 1110-2-1100 (Part II), United States Army Corps of Engineers, Vicksburg, 2008, p. 608. [12] D. C. Masson, C. Gurney and M. Kennett, “Beach To- pography Mapping—A Comparison of Techniques,” Journal of Coastal Conservation, Vol. 6, No. 1, 2000, pp. 113-124. [13] J. D. Huang, D. W. T. Jackson and J. A. G. Cooper, “Morphological Monitoring of a High Energy Beach System Using GPS and Total Station Techniques, Run- kerry, Co. Antrim, Northern Ireland,” Journal of Coastal Research, Vol. 36, No. 36, 2002, pp. 390-398. [14] G. Masselink and B. Hegge, “Morphodynamics of Meso- and Macrotidal Beaches: Examples from Central Queens- land, Australia,” Marine Geology, Vol. 129, No. 1-2, 1995, pp. 1-23. doi:10.1016/0025-3227(95)00104-2 |