

Paper Menu >>
Journal Menu >>
 American Journal of Anal yt ical Chemistry, 2011, 2, 152-157 doi:10.4236/ajac.2011.22017 Published Online May 2011 (http://www.SciRP.org/journal/ajac) Copyright © 2011 SciRes. AJAC Determination of Glimepiride in Rat Serum by RP-HPLC Method Sujatha Samala, Sandhya Rani Tatipamula, Ciddi Veeresham University College of Pharmaceutical Sciences, Kakatiya University, Warangal, India E-mail: [email protected] Received August 27, 2010; revised November 12, 2010; accepted November 17, 2010 Abstract A simple and sensitive reverse phase high performance liquid chromatography (RP-HPLC) method was de- veloped for the determination of glimepiride in rat serum. The assay involves one step liquid-liquid extrac- tion with methanol. Gliclazide was used as an internal standard. Chromatographic separation was performed on a C18 column using a mobile phase of methanol: 10 mM phosphate buffer (80:20 v/v) adjusted to pH 3.0 with orthophosphoric acid, at a flow rate of 1.0 ml/min and UV detection at 230 nm. The retention time of glimepiride and gliclazide was found to be 5.5 and 4.0 min and separation was complete in less than 10 min. The method was validated for linearity, accuracy and precision were found to be acceptable over the range of 0.5 - 500 µg/ml for glimepiride. The method was found suitable to analyse rat serum samples for application in pharmacokinetic, pharmacodynamic, bioavailability/bioequivalence studies. Keywords: Glimepiride, Gliclazide, RP-HPLC, Rat Serum 1. Introduction The sulfonylurea glimepiride (1-[[p-[2-(3-ethyl-4-methy l-2-oxo-3-pyrroline-1-carboxamido)ethyl]phenyl]sulfonyl]- 3-(trans-4-methylcyclohexyl) urea) used widely in the treatment of non-insulin dependent Type II diabetes mel- litus [1,2]. It acts by stimulating insulin secretions from the beta cells of pancreas and is also known to increase peripheral insulin sensitivity thereby decreasing insulin resistance. It can be used in combination with metformin, thiazolidinediones, alpha-glucosidase inhibitors and in- sulin [3,4]. After oral administration, it is completely absorbed from the gastrointestinal tract. Peak plasma concentration is reached 2 - 3 h after dosing. Its bioavailability changes a little with food and glimepiride (99.5%) are bound to proteins. Glimepiride is completely metabolised in liver [5]. The structures of glimepiride and gliclazide (internal standard IS) are shown in Figure 1. To date there is no method was available for determi- nation of glimepiride in rat serum, so an RP-HPLC method was developed for determination of glimepiride in rat serum. Several different methods have been re- ported for qualitative and quantitative analysis of glime- piride in human plasma and biological samples; these include micellar electrokinetic capillary chromatography (MECC) with diode-array detection (DAD) or ultraviolet (UV) detection [6], high performance liquid chromatog- raphy (HPLC) with DAD [7] and UV detection [8] and derivative UV spectrophotometric detection [9], liquid chromatography-electrospray ionization mass spectrome- try (LC-ESI/MS) [10-13], an HPLC method for the quantification of glimepiride in tablets [14], the determi- nation of related substances in glimepiride [15], the quantification of cis-isomer of glimepiride by normal phase chromatography [16] and the quantification of cis-isomer of glimepiride in a bulk drug substance by (a) (b) Figure 1. Chemical structures of (a) Gliclazide and (b) Gli- mepiride. 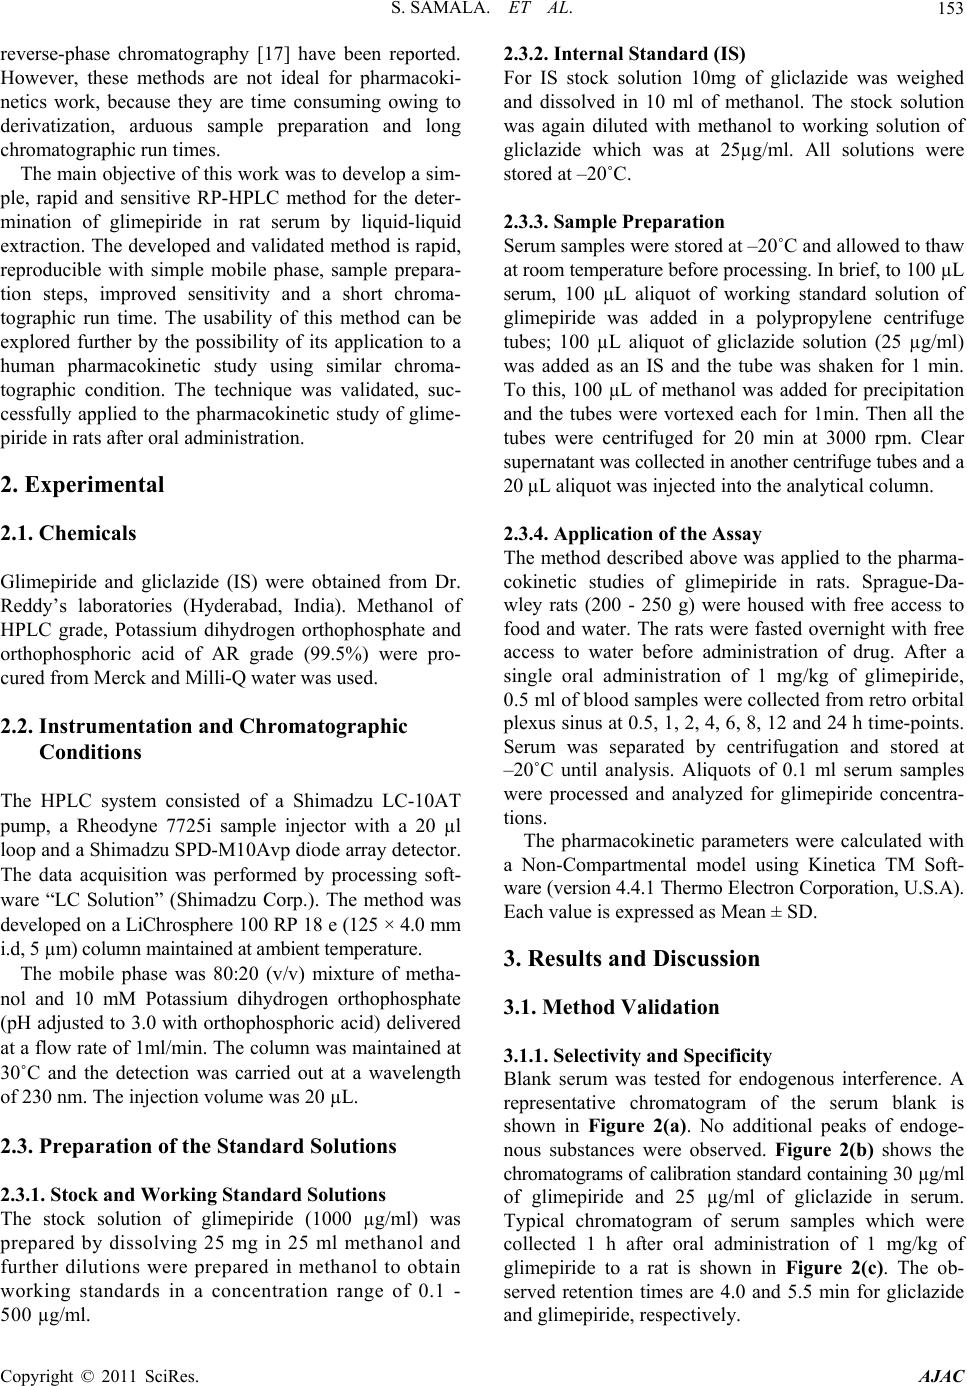 S. SAMALA. ET AL.153 reverse-phase chromatography [17] have been reported. However, these methods are not ideal for pharmacoki- netics work, because they are time consuming owing to derivatization, arduous sample preparation and long chromatographic run times. The main objective of this work was to develop a sim- ple, rapid and sensitive RP-HPLC method for the deter- mination of glimepiride in rat serum by liquid-liquid extraction. The developed and validated method is rapid, reproducible with simple mobile phase, sample prepara- tion steps, improved sensitivity and a short chroma- tographic run time. The usability of this method can be explored further by the possibility of its application to a human pharmacokinetic study using similar chroma- tographic condition. The technique was validated, suc- cessfully applied to the pharmacokinetic study of glime- piride in rats after oral administration. 2. Experimental 2.1. Chemicals Glimepiride and gliclazide (IS) were obtained from Dr. Reddy’s laboratories (Hyderabad, India). Methanol of HPLC grade, Potassium dihydrogen orthophosphate and orthophosphoric acid of AR grade (99.5%) were pro- cured from Merck and Milli-Q water was used. 2.2. Instrumentation and Chromatographic Conditions The HPLC system consisted of a Shimadzu LC-10AT pump, a Rheodyne 7725i sample injector with a 20 µl loop and a Shimadzu SPD-M10Avp diode array detector. The data acquisition was performed by processing soft- ware “LC Solution” (Shimadzu Corp.). The method was developed on a LiChrosphere 100 RP 18 e (125 × 4.0 mm i.d, 5 µm) column maintained at ambient temperature. The mobile phase was 80:20 (v/v) mixture of metha- nol and 10 mM Potassium dihydrogen orthophosphate (pH adjusted to 3.0 with orthophosphoric acid) delivered at a flow rate of 1ml/min. The column was maintained at 30˚C and the detection was carried out at a wavelength of 230 nm. The injection volume was 20 µL. 2.3. Preparation of the Standard Solutions 2.3.1. Stock and Working Standard Solutions The stock solution of glimepiride (1000 µg/ml) was prepared by dissolving 25 mg in 25 ml methanol and further dilutions were prepared in methanol to obtain working standards in a concentration range of 0.1 - 500 µg/ml. 2.3.2. Internal Standard (IS) For IS stock solution 10mg of gliclazide was weighed and dissolved in 10 ml of methanol. The stock solution was again diluted with methanol to working solution of gliclazide which was at 25µg/ml. All solutions were stored at –20˚C. 2.3.3. Sample Preparation Serum samples were stored at –20˚C and allowed to thaw at room temperature before processing. In brief, to 100 µL serum, 100 µL aliquot of working standard solution of glimepiride was added in a polypropylene centrifuge tubes; 100 µL aliquot of gliclazide solution (25 µg/ml) was added as an IS and the tube was shaken for 1 min. To this, 100 µL of methanol was added for precipitation and the tubes were vortexed each for 1min. Then all the tubes were centrifuged for 20 min at 3000 rpm. Clear supernatant was collected in another centrifuge tubes and a 20 µL aliquot was injected into the analytical column. 2.3.4. Appl ic a ti on of the Assay The method described above was applied to the pharma- cokinetic studies of glimepiride in rats. Sprague-Da- wley rats (200 - 250 g) were housed with free access to food and water. The rats were fasted overnight with free access to water before administration of drug. After a single oral administration of 1 mg/kg of glimepiride, 0.5 ml of blood samples were collected from retro orbital plexus sinus at 0.5, 1, 2, 4, 6, 8, 12 and 24 h time-points. Serum was separated by centrifugation and stored at –20˚C until analysis. Aliquots of 0.1 ml serum samples were processed and analyzed for glimepiride concentra- tions. The pharmacokinetic parameters were calculated with a Non-Compartmental model using Kinetica TM Soft- ware (version 4.4.1 Thermo Electron Corporation, U.S.A). Each value is expressed as Mean ± SD. 3. Results and Discussion 3.1. Method Validation 3.1.1. Selectivity and Specificity Blank serum was tested for endogenous interference. A representative chromatogram of the serum blank is shown in Figure 2(a). No additional peaks of endoge- nous substances were observed. Figure 2(b) shows the chromatograms of calibration standard containing 30 µg/ml of glimepiride and 25 µg/ml of gliclazide in serum. Typical chromatogram of serum samples which were collected 1 h after oral administration of 1 mg/kg of glimepiride to a rat is shown in Figure 2(c). The ob- served retention times are 4.0 and 5.5 min for gliclazide and glimepiride, respectively. Copyright © 2011 SciRes. AJAC 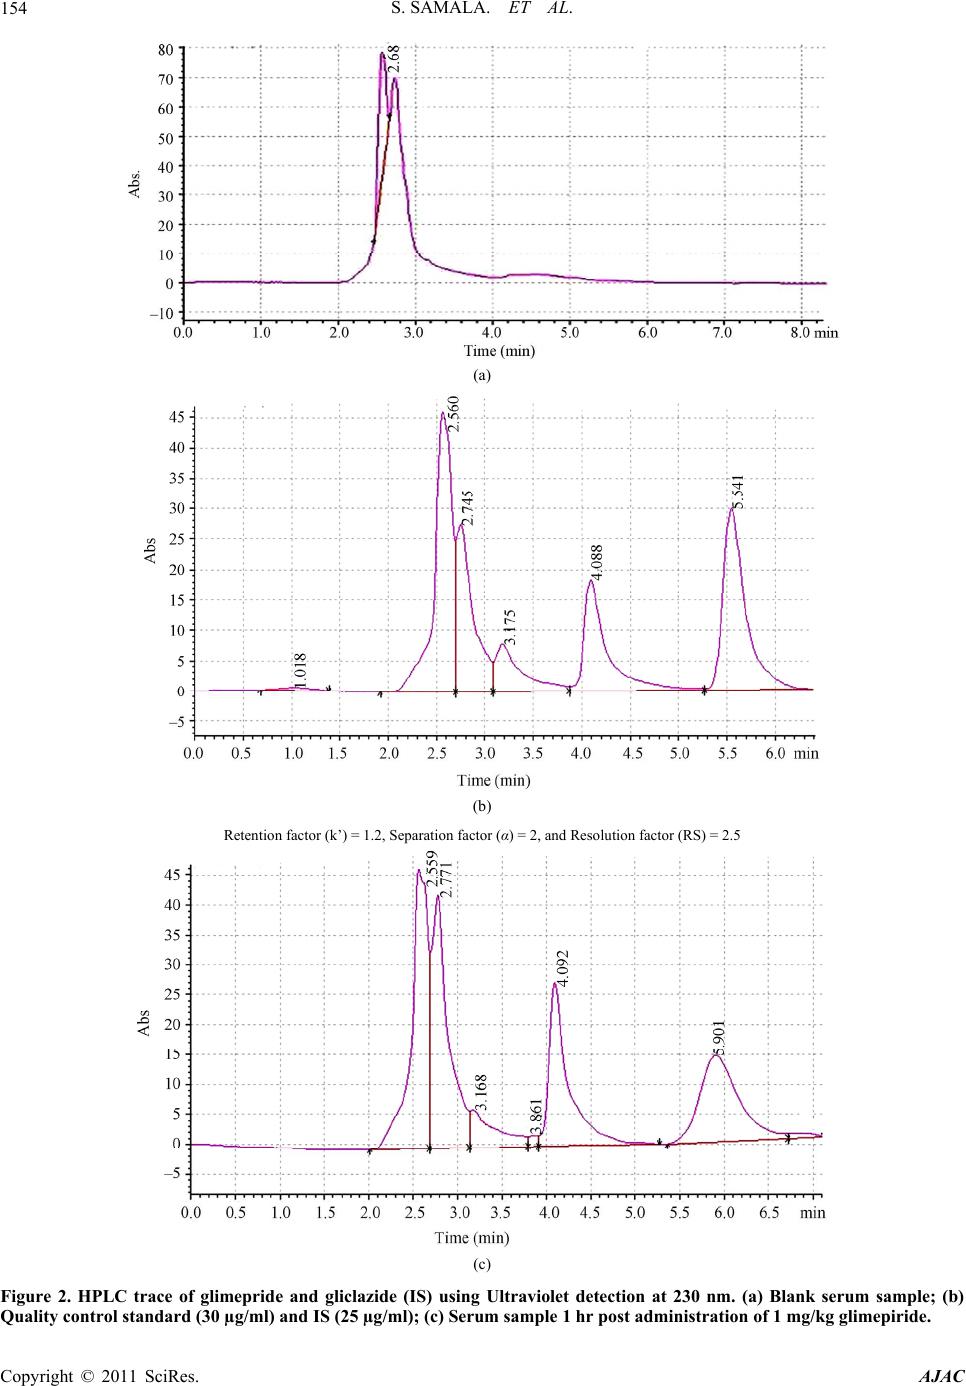 S. SAMALA. ET AL. Copyright © 2011 SciRes. AJAC 154 (a) (b) Retention factor (k’) = 1.2, Separation factor (α) = 2, and Resolution factor (RS) = 2.5 (c) Figure 2. HPLC trace of glimepride and gliclazide (IS) using Ultraviolet detection at 230 nm. (a) Blank serum sample; (b) Quality control standard (30 µg/ml) and IS (25 µg/ml); (c) Serum sample 1 hr post administration of 1 mg/kg glimepiride.  S. SAMALA. ET AL. Copyright © 2011 SciRes. AJAC 155 3.1.2. Linearity and Limit of Quantitation Linear calibration curves with correlation coefficients greater than 0.9999 were obtained over the concentration range 0.5 - 100 µg/ml for glimepiride in rat serum. The typical equation of the calibration curve is as follows; Y = 0.0686x + 0.0192, r = 0.9999. The results shown that within the concentration range indicated there was an excellent correlation between peak area ratio and each concentration of glimepiride. The limit of quantitation, defined as the lowest con- centration analyzed with an accuracy of ±15% and a co- efficient of variation <15%, was 0.5 µg/ml for the deter- mination of glimepiride in serum. 3.1.3. Precision and Accuracy Precision and accuracy of the assay were determined, using replicate analyses (n = 6) of quality control samples at three concentrations, by performing the complete ana- lytical runs on the same day and also on three consecu- tive days. The data obtained for glimepiride were within the acceptable limits to meet the guidelines for bioana- lytical methods. The results are depicted in Table 1. 3.1.4. Extraction Recovery Extraction recovery of glimepiride was determined by comparing peak areas obtained from extracted serum samples with those found by extracting blank matrices through the extraction procedure and spiking with a known amount of glimepiride. The results showed that the mean extraction recoveries of glimepiride were >85% at concentrations of 1.0, 5.0, and 10.0 µg/ml respectively (Table 2). Different organic extraction solvents were evaluated in the experiment, including Methanol, Ethy- lacetate, Acetonitrile, Dichloromethane, Chloroform and Diethylether. Methanol proved to be the most efficient in extracting glimepiride from rat serum and had a small variation in extraction recoveries over the concentration range. 3.1.5. Stability The amount of glimepiride recovered over a period of 30 days in serum samples stored at –20˚C did not differ from the initial concentrations, which were shown in Table 3. 3.2. Application of the Analytical Method in Pharmacokinetic Studies The described method was applied to a pharmacokinetic study in rats. After a single oral administration of glime- piride (1 mg/kg) to rats, serum concentrations were de- termined over a period of 24 h after administration. The mean serum concentration-time curve after an oral dose of 1 mg/kg glimepiride is shown in Figure 3 and the main pharmacokinetic parameters are summarized in Table 4. The Cmax of glimepiride detected in the rats was 17.56 µg/ml, and the Tmax was 4 hrs. Table 1. Inter-day and Intra-day accuracy and precision for the analysis of Glimepiride in rat serum. Inter-day Intra-day Nominal concentration (µg/ml) Calculated concentration Mean (µg/ml)a ± SD Accuracy (%)b Precision (% RSD)c Calculated concentration Mean (µg/ml)a ± SD Accuracy (%)b Precision (% RSD)c 1 1.045 ± 0.02 104.5 1.91 1.02 ± 0.1 102.1 9.79 5 5.01 ± 0.1 100.2 2.00 4.92 ± 0.25 98.4 5.08 10 10.08 ± 0.52 100.8 5.16 10.01 ± 1.05 100.1 10.5 a: Averaged for six measurements at each concentration level (n = 6); b: Accuracy = (mean observed concentration) (spiked concentration)−1 × 100; c: Preci- sion (% RSD) = (SD × 100) (mean observed concentration)−1. Table 2. The percent extraction recovery of measurement of glimepiride in rat serum. Nominal concentration (µg/ml) % Recoverya,b 1 91.2 5 86.4 10 89.7 a: Averaged for six measurements at each concentration level (n = 6); b: % recovery = (response of extracted spike) (response of post-extracted spike)–1 × 100. Table 3. Glimepiride stability results: Blank rat serum was spiked with 3 different concentrations of glimepiride and stored at –20˚C over a period of 30 days. Concentration obtained (µg/ml) Concentration added (µg/ml) Day 1 Day 14 Day 21Day 30 1 1.02 0.98 1.05 1.002 5 4.92 5.01 4.98 5.05 10 10.01 10.12 9.98 9.99  S. SAMALA. ET AL. Copyright © 2011 SciRes. AJAC 156 Figure 3. Mean serum concentration-time profile of glimepiride after oral administration of 1 mg/kg glimepiride in rats. Table 4. The main pharmacokinetic parameters of mean drug serum concentration time curve (mean ± SD, n = 6) of glime- piride in rats after single oral administration at 1 mg/kg. C max (µg/ml) Tmax (hrs)AUCo-n (µg.h/ml)AUCtot (µg.h/ml)t½ (hrs) MRT (hrs) Glimepiride 17.56 ± 0.3 4.0 ± 1.255.6 ± 1.4 57.5 ± 5.3 1.05 ± 0.8 4.14 ± 2.6 4. Conclusion A sensitive and selective reverse phase HPLC method was developed for the pharmacokinetic study of glime- piride in rats. This analytical procedure is inexpensive and simple because it requires fewer preparation steps, is less time consuming than methods using pre-column derivatization, and is particularly suitable when tandem mass spectrometric detection is not available. The assay has been validated and the results have shown that the method is sensitive, accurate and reproducible. As a re- sult, the proposed method is found to be appropriate and suitable for the determination of glimepiride in serum samples for pharmacokinetic, bioavailability or bio- equivalence studies. 5. Acknowledgements The authors are thankful to Dr. Reddy’s laboratories, Hyderabad, India for the gift samples of glimepiride and gliclazide. 6. References [1] A. L. McCall, “Clinical Review of Glimepiride,” Expert Opinion on Pharmacotherapy, Vol. 2, No. 4, 2001, pp. 699-713. doi:10.1517/14656566.2.4.699 [2] J. Rosenstock, E. Samols, D. B. Muchmore and J. Sch- neider, “Glimepiride, a New Once-Daily Sulfonylurea: A Double-Blind Placebo-Controlled Study Of NIDDM Pa- tients,” Diabetes Care, Vol. 19, No. 11, 1996, pp. 1194-1199. doi:10.2337/diacare.19.11.1194 [3] S. N. Davis, “The Role of Glimepiride in the Effective Management of Type 2 Diabetes,” Journal of Diabetes and its Complications, Vol. 18, No. 6, 2004, pp. 367-376. doi:10.1016/j.jdiacomp.2004.07.001 [4] D. S. Bell, “Practical Considerations and Guidelines for Dosing Sulfonylureas in Monotherapy or Combination Therapy,” Clinical Therapeutics, Vol. 26, No. 11, 2004, pp. 1714-1727. doi:10.1016/j.clinthera.2004.10.014 [5] M. Badian, A. Korn, K. H. Lehr, V. Malerczyk and W. Waldhausl, “Determination of the Absolute Bioavailabil- ity of Glimepiride (HOE 490), a New Sulfonylurea,” In- ternational Journal of Clinical Pharmacology, Therapy and Toxicology, Vol. 30, No. 11, 1992, pp. 481-482. [6] M. E. Roche, R. P. Oda, G. M. Lawson and J. P. Landers, “Capillary Electrophoretic Detection of Metabolites in the Urine of Patients Receiving Hypoglycemic Drug Therapy,” Electrophoresis, Vol. 18, No. 10, 1997, pp. 1865-1874. doi:10.1002/elps.1150181024 [7] J. N. Jingar, S. J. Rajput, B. Dasandi and S. Rathnam, “Development and Validation of LC-UV for Simultane- ous Estimation of Rosiglitazone and Glimepiride in Hu- man Plasma,” Chromatographia, Vol. 67, No. 11-12, 2008, pp. 951-955. doi:10.1365/s10337-008-0633-3 [8] Y. K. Song, J. E. Maeng, H. R. Hwang, J. S. Park, B. C. Kim, J. K. Kim and C. K. Kim, “Determination of Glime- piride in Human Plasma Using Semi-Microbore High-Pe- rformance Liquid Chromatography with Columnswitch- ing,” Journal of Chromatography B: Analytical Tech-  S. SAMALA. ET AL.157 nologies in the Biomedical and Life Sciences, Vol. 810, No. 1, 2004, pp. 143-149. [9] I. U. Khan, F. Aslam, M. Ashfaq and M. N. Asghar, “Determination of Glimepiride in Pharmaceutical For- mulations Using High-Performance Liquid Chromatog- raphy and First-Derivative Spectrophotometric Methods,” Journal of Analytical Chemistry, Vol. 64, No. 2, 2009, pp. 171-175. doi:10.1134/S1061934809020130 [10] I. I. Salem, J. Idrees and J. I. Al Tamimi, “Determination of Glimepiride in Human Plasma by Liquid Chromatog- raphy—Electrospray Ionization Tandem Mass Spectro- metry,” Journal of Chromatography B: Analytical Tech- nologies in the Biomedical and Life Sciences, Vol. 799, No. 1, 2004, pp. 103-109. doi:10.1016/j.jchromb.2003.10.024 [11] H. Kim, K. Y. Chang, H. J. Lee and S. B. Han, “Deter- mination of Glimepiride in Human Plasma by Liquid Chromatography—Electrospray Ionization Tandem Mass Spectrometry,” Bulletin of the Korean Chemical Society, Vol. 25, No. 1, 2004, pp. 109-114. doi:10.5012/bkcs.2004.25.1.109 [12] H. Kim, K. Y. Chang, C. H. Park, M. S. Jang, J. A. Lee, H. J. Lee and K. R. Lee, “Determination of Glimepiride in Human Plasma by LC-MS-MS and Comparison of Sample Preparation Methods for Glimepiride,” Chroma- tographia, Vol. 60, No. 1-2, 2004, pp. 93-98. doi:10.1365/s10337-004-0351-4 [13] N .Yuzuak, T. Ozden, S. Eren and S. Ozilhan, “Determi- nation of Glimepiride in Human Plasma by LC-MS-MS,” Chromatographia, Vol. 66, No. 1, 2007, pp. 165-168. doi:10.1365/s10337-007-0368-6 [14] S. P. Pawar, G. A. Meshram and M. U. Phadke, “Simul- taneous LC Estimation of Glimepiride and Metformin in Glimepiride Immediate Release and Metformin Sustained Release Tablets,” Chromatographia, Vol. 68, No. 11-12, 2008, pp. 1063-1066. doi:10.1365/s10337-008-0802-4 [15] K. H. Lehr and P. Damm, “Simultaneous Determination of the Sulphonylurea Glimepiride and Its Metabolites in Human Serum and Urine by High-Performance Liquid Chromatography after Pre-Column Derivatization,” Jou- rnal of Chromatography-Biomedical Applications, Vol. 526, No. 1, 1990, pp. 497-505. doi:10.1016/S0378-4347(00)82531-1 [16] The United States Pharmacopeia (USP) and the National Formulary (NF), “The Official Compendia of Standards,” Vol. 29, No. 2, 2006, p. 1001. [17] D. B. Pathare, A. S. Jadhav and M. S. Shingare, “RP-LC Determination of the Cis-Isomer of Glimepiride in a Bulk Drug Substance,” Chromatographia, Vol. 66, No. 7-8, 2007, pp. 639-641. doi:10.1365/s10337-007-0356-x Copyright © 2011 SciRes. AJAC |