

Paper Menu >>
Journal Menu >>
 Natural Science, 2009, 1, 41-46 NS http://dx.doi.org/10.4236/ns.2009.11008 Copyright © 2009 SciRes. OPEN ACCESS A Study of thermal decomposition in cellulose by molecular dynamics simulation Chao Liu1, De-Zheng Jiang1, Shun-An Wei2, Jin-Bao Huang1 1College of Power Engineering, Chongqing University, Chongqing 400044, China; 2College of Chemistry and Chemical Engineering, Chongqing University, Chongqing 400044, China. Email: [email protected] Received 19 May 2009; revised 5 June 2009; accepted 7 June 2009. ABSTRACT PM3 method was used in this paper to optimize cellulose molecular structure which is the main component of biomass and a series of struc- tural parameter was attained. The single chain of cellulose (the degree of polymerization is 9) was simulated in different force fields by mo- lecular dynamic method. Energy history, depo- sition temperature and the cracked groups of simulation process in different force fields was gotten, of which Amber force field is quite matched to the experiments data. By simulating the process of cellulose thermal decomposition with MD which is based on Amber force field and quantum mechanics, we get the sequence of bond break of cellulose molecule and the first cracked group. Also, the first production was analyzed. The heating process includes two stages: vibrate at low temperature and break at high temperature (273k-375k) and breaking stage when the temperature of the system ar- rived at 375K. Keywords: Molecular Dynamics Simulation; Cel- lulose; Thermal Decomposition; Bond Breaks 1. INTRODUCTION The special meeting, green energy: the cooperation of government and enterprise, of Boao Asian Forum pointed out that the miraculous development of Asia will not continue if no appropriate measures were taken to make sure energy safety, decrease energy consuming, find new energy and to release environment stress. However, all the problems probably can be solved by biomass energy, which has become one of the most popular and important topics in the word. Biomass consists of cellulose, hemicellulose, lignin and a small amount of ash content. Cellulose, which is D-glucose high molecular polymer formed by connec- tion between (1-4)-glycosidic bond, is the main component of biomass, accounting for 40%-96% of the total amount of biomass. Many researches on relation between raw material and production of biomass energy were done by scholars form all over the world, using thermal decomposition, liquefaction, gasification [2,3,4, 5]. However, the work on the process is rare. In order to investigate the further principle of biomass energy’s thermal deposition process, a reactive molecular dynam- ics model was developed to simulation the thermal deposition of cellulose in this paper. Molecular structures were optimized before molecular dynamic simulation to lower the molecule energy to the possibly lowest degree. The lower the energy is, the steadier the structure is and the higher probability exists in the system is. Single point calculation was applied for optimizing energy; Optimized structure was searched by calculating a series of bond length and bond angle. Single molecular was employed in this MD simula- tion, which differs form other poly-molecular systems. The lowest point of partial total potential energy was gotten when searching the lowest total potential energy, but the global optimization was needed. MD method must be used when optimal three dimensional struc- tures were set. Molecules are heated up and the struc- ture extends and relaxes adequately at high tempera- ture. Then we cool down the molecules and calculate the optimum structure. Optimal three dimensional structures can be obtained. The conformations were much different between single molecule and multiple molecules which are more accordant with practical situation. Single molecule was researched in this paper considering huge system, complex structure and the operation ability of computes. The semi-empirical method MNDO-PM3 based on MNDO model was used in this paper and Polak-Ribiere conjugate gradient was applied in optimization with RMS setted as 0.042kJ/mol. The results of cellulose molecular optimization were listed in Table 1. 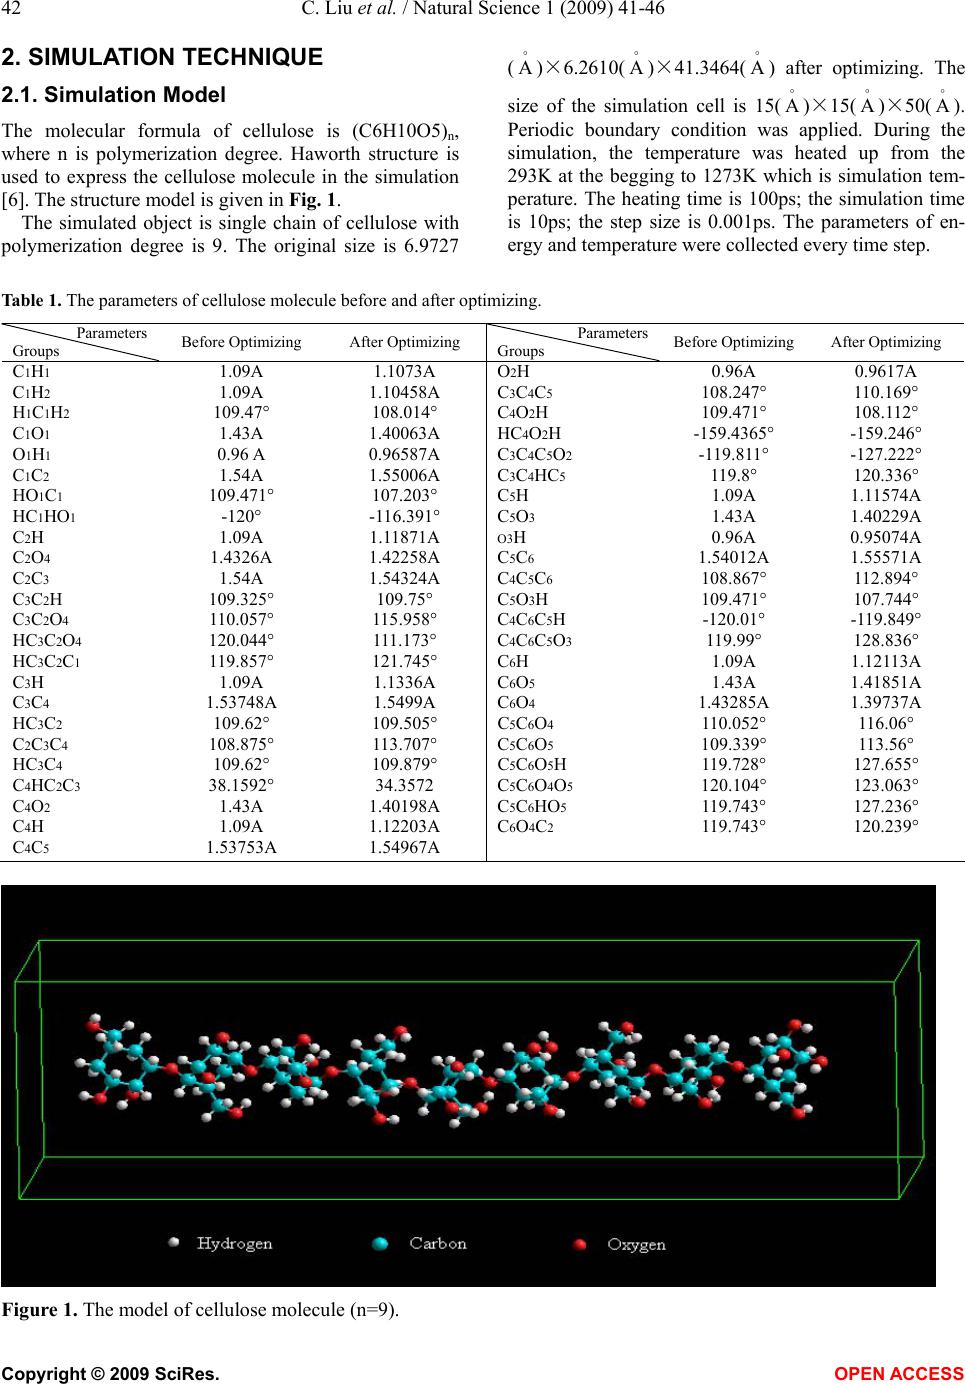 42 C. Liu et al. / Natural Science 1 (2009) 41-46 Copyright © 2009 SciRes. OPEN ACCESS 2. SIMULATION TECHNIQUE 2.1. Simulation Model The molecular formula of cellulose is (C6H10O5)n, where n is polymerization degree. Haworth structure is used to express the cellulose molecule in the simulation [6]. The structure model is given in Fig. 1. The simulated object is single chain of cellulose with polymerization degree is 9. The original size is 6.9727 ( )×6.2610( )×41.3464( ) after optimizing. The size of the simulation cell is 15( )×15( )×50( ). Periodic boundary condition was applied. During the simulation, the temperature was heated up from the 293K at the begging to 1273K which is simulation tem- perature. The heating time is 100ps; the simulation time is 10ps; the step size is 0.001ps. The parameters of en- ergy and temperature were collected every time step. Table 1. The parameters of cellulose molecule before and after optimizing. Parameters Groups Before Optimizing After Optimizing Parameters Groups Before Optimizing After Optimizing C1H1 1.09A 1.1073A O2H 0.96A 0.9617A C1H2 1.09A 1.10458A C3C4C5 108.247° 110.169° H1C1H2 109.47° 108.014° C4O2H 109.471° 108.112° C1O1 1.43A 1.40063A HC4O2H -159.4365° -159.246° O1H1 0.96 A 0.96587A C3C4C5O2 -119.811° -127.222° C1C2 1.54A 1.55006A C3C4HC5 119.8° 120.336° HO1C1 109.471° 107.203° C5H 1.09A 1.11574A HC1HO1 -120° -116.391° C5O3 1.43A 1.40229A C2H 1.09A 1.11871A O3H 0.96A 0.95074A C2O4 1.4326A 1.42258A C5C6 1.54012A 1.55571A C2C3 1.54A 1.54324A C4C5C6 108.867° 112.894° C3C2H 109.325° 109.75° C5O3H 109.471° 107.744° C3C2O4 110.057° 115.958° C4C6C5H -120.01° -119.849° HC3C2O4 120.044° 111.173° C4C6C5O3 119.99° 128.836° HC3C2C1 119.857° 121.745° C6H 1.09A 1.12113A C3H 1.09A 1.1336A C6O5 1.43A 1.41851A C3C4 1.53748A 1.5499A C6O4 1.43285A 1.39737A HC3C2 109.62° 109.505° C5C6O4 110.052° 116.06° C2C3C4 108.875° 113.707° C5C6O5 109.339° 113.56° HC3C4 109.62° 109.879° C5C6O5H 119.728° 127.655° C4HC2C3 38.1592° 34.3572 C5C6O4O5 120.104° 123.063° C4O2 1.43A 1.40198A C5C6HO5 119.743° 127.236° C4H 1.09A 1.12203A C6O4C2 119.743° 120.239° C4C5 1.53753A 1.54967A Figure 1. The model of cellulose molecule (n=9). 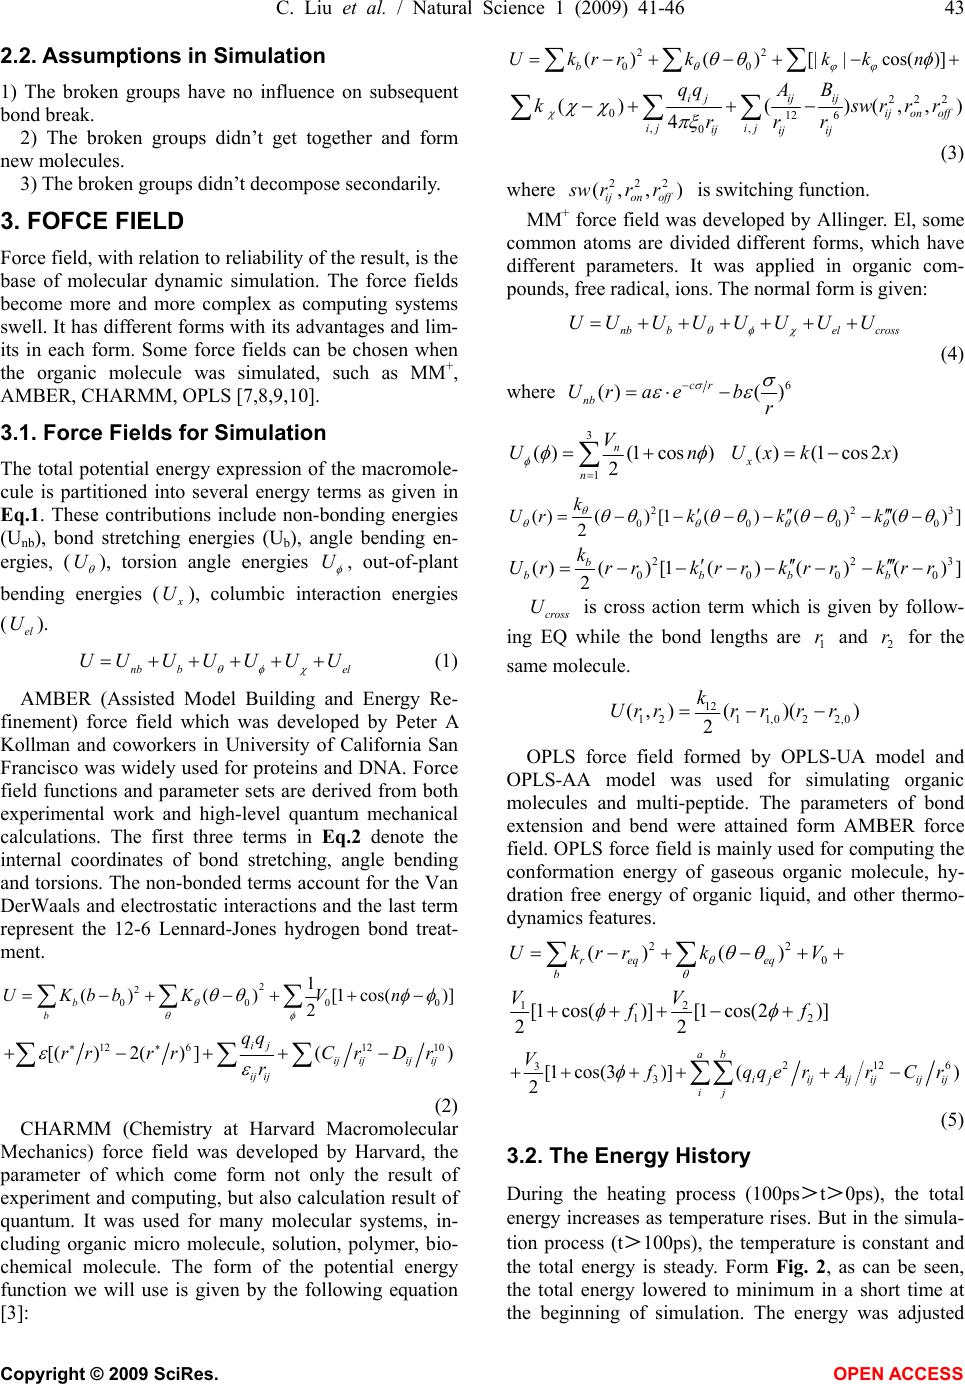 C. Liu et al. / Natural Science 1 (2009) 41-46 43 Copyright © 2009 SciRes. OPEN ACCESS 2.2. Assumptions in Simulation 1) The broken groups have no influence on subsequent bond break. 2) The broken groups didn’t get together and form new molecules. 3) The broken groups didn’t decompose secondarily. 3. FOFCE FIELD Force field, with relation to reliability of the result, is the base of molecular dynamic simulation. The force fields become more and more complex as computing systems swell. It has different forms with its advantages and lim- its in each form. Some force fields can be chosen when the organic molecule was simulated, such as MM+, AMBER, CHARMM, OPLS [7,8,9,10]. 3.1. Force Fields for Simulation The total potential energy expression of the macromole- cule is partitioned into several energy terms as given in Eq.1. These contributions include non-bonding energies (Unb), bond stretching energies (Ub), angle bending en- ergies, (U ), torsion angle energies U , out-of-plant bending energies ( x U), columbic interaction energies (el U). nb bel UUU UUUU (1) AMBER (Assisted Model Building and Energy Re- finement) force field which was developed by Peter A Kollman and coworkers in University of California San Francisco was widely used for proteins and DNA. Force field functions and parameter sets are derived from both experimental work and high-level quantum mechanical calculations. The first three terms in Eq.2 denote the internal coordinates of bond stretching, angle bending and torsions. The non-bonded terms account for the Van DerWaals and electrostatic interactions and the last term represent the 12-6 Lennard-Jones hydrogen bond treat- ment. 2 2 0000 1 ()( )[1cos()] 2 b b UKbb KVn 12612 10 [( )2( )]() ij ij ijij ij ij ij qq rrrrCrD r r (2) CHARMM (Chemistry at Harvard Macromolecular Mechanics) force field was developed by Harvard, the parameter of which come form not only the result of experiment and computing, but also calculation result of quantum. It was used for many molecular systems, in- cluding organic micro molecule, solution, polymer, bio- chemical molecule. The form of the potential energy function we will use is given by the following equation [3]: 22 00 ()( )[||cos()] b Ukrr kkkn 22 2 012 6 ,, 0 ()( )(,,) 4 i jijij ijon off ij ij ij ij ij qqA B kswrrr rrr (3) where 22 2 (, ,) ijon off s wr rr is switching function. MM+ force field was developed by Allinger. El, some common atoms are divided different forms, which have different parameters. It was applied in organic com- pounds, free radical, ions. The normal form is given: nb belcross UUU UU UUU (4) where 6 ()( ) cr nb Ur aebr 3 1 ()(1 cos) 2 n n V Un ()(1 cos2) x Ux kx 223 0000 ()()[1()()()] 2 k Urkkk 223 0000 ()()[1()() ()] 2 b bbbb k Urrrkrrkrrkrr cross U is cross action term which is given by follow- ing EQ while the bond lengths are 1 r and 2 r for the same molecule. 12 1 211,022,0 (, )()() 2 k Urrr rrr OPLS force field formed by OPLS-UA model and OPLS-AA model was used for simulating organic molecules and multi-peptide. The parameters of bond extension and bend were attained form AMBER force field. OPLS force field is mainly used for computing the conformation energy of gaseous organic molecule, hy- dration free energy of organic liquid, and other thermo- dynamics features. 22 0 12 12 ()() [1 cos()][1 cos(2)] 22 reqeq b Ukrr kV VV ff 2126 3 3 [1 cos(3)]() 2 ab i jijijijijij ij V f qq erArCr (5) 3.2. The Energy History During the heating process (100ps>t>0ps), the total energy increases as temperature rises. But in the simula- tion process (t>100ps), the temperature is constant and the total energy is steady. Form Fig. 2, as can be seen, the total energy lowered to minimum in a short time at the beginning of simulation. The energy was adjusted 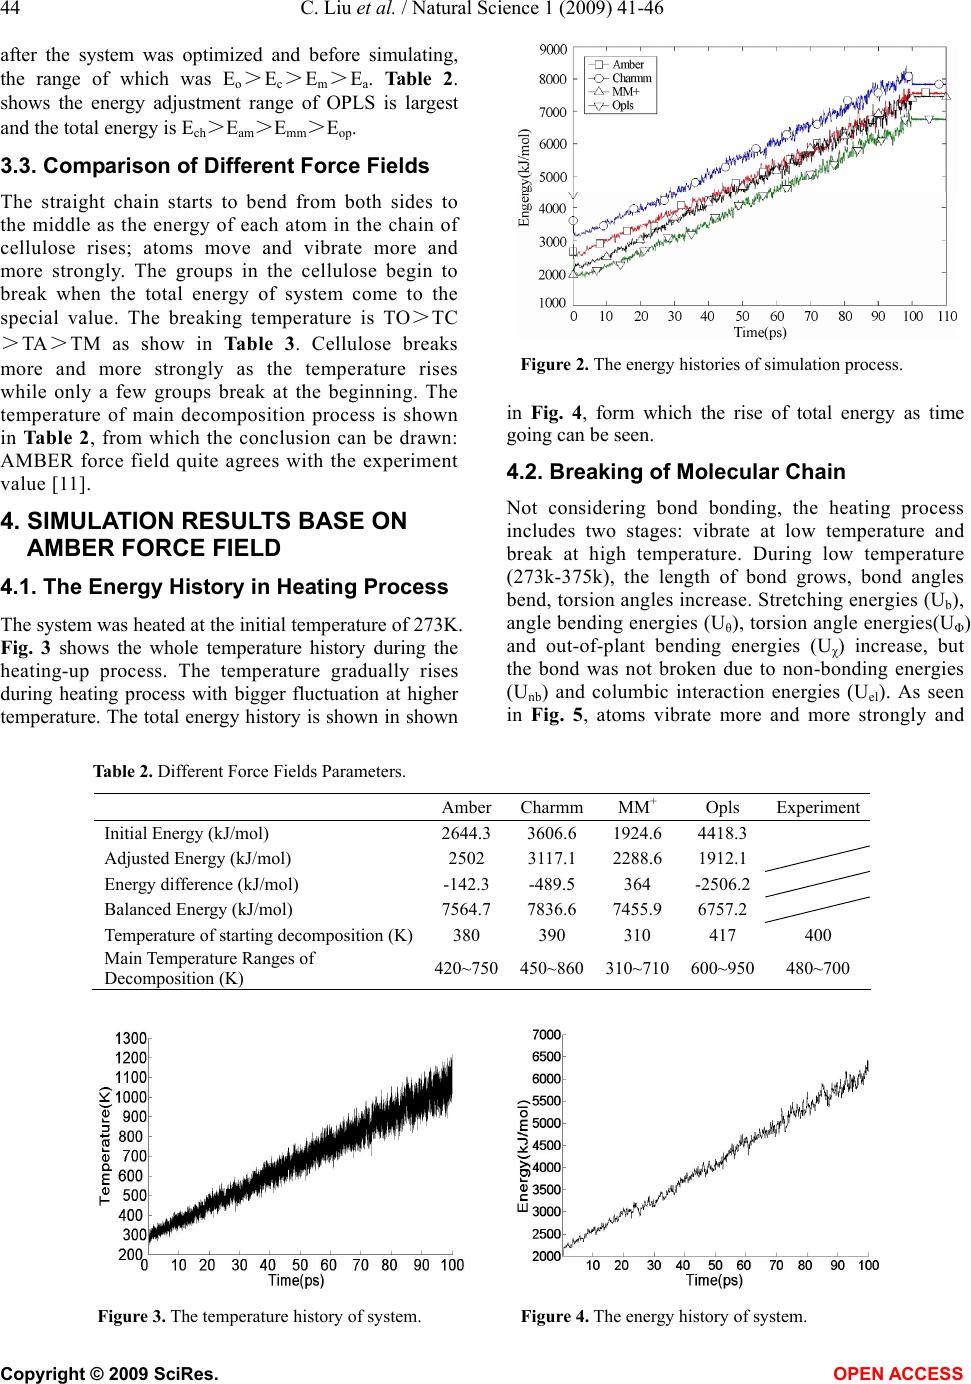 44 C. Liu et al. / Natural Science 1 (2009) 41-46 Copyright © 2009 SciRes. OPEN ACCESS after the system was optimized and before simulating, the range of which was Eo>Ec>Em>Ea. Table 2. shows the energy adjustment range of OPLS is largest and the total energy is Ech>Eam>Emm>Eop. 3.3. Comparison of Different Force Fields The straight chain starts to bend from both sides to the middle as the energy of each atom in the chain of cellulose rises; atoms move and vibrate more and more strongly. The groups in the cellulose begin to break when the total energy of system come to the special value. The breaking temperature is TO>TC >TA>TM as show in Table 3. Cellulose breaks more and more strongly as the temperature rises while only a few groups break at the beginning. The temperature of main decomposition process is shown in Table 2, from which the conclusion can be drawn: AMBER force field quite agrees with the experiment value [11]. 4. SIMULATION RESULTS BASE ON AMBER FORCE FIELD 4.1. The Energy History in Heating Process The system was heated at the initial temperature of 273K. Fig. 3 shows the whole temperature history during the heating-up process. The temperature gradually rises during heating process with bigger fluctuation at higher temperature. The total energy history is shown in shown Figure 2. The energy histories of simulation process. in Fig. 4, form which the rise of total energy as time going can be seen. 4.2. Breaking of Molecular Chain Not considering bond bonding, the heating process includes two stages: vibrate at low temperature and break at high temperature. During low temperature (273k-375k), the length of bond grows, bond angles bend, torsion angles increase. Stretching energies (Ub), angle bending energies (Uθ), torsion angle energies(UΦ) and out-of-plant bending energies (Uχ) increase, but the bond was not broken due to non-bonding energies (Unb) and columbic interaction energies (Uel). As seen in Fig. 5, atoms vibrate more and more strongly and Table 2. Different Force Fields Parameters. AmberCharmmMM+ Opls Experiment Initial Energy (kJ/mol) 2644.3 3606.6 1924.6 4418.3 Adjusted Energy (kJ/mol) 2502 3117.1 2288.6 1912.1 Energy difference (kJ/mol) -142.3 -489.5 364 -2506.2 Balanced Energy (kJ/mol) 7564.7 7836.6 7455.9 6757.2 Temperature of starting decomposition (K)380 390 310 417 400 Main Temperature Ranges of Decomposition (K) 420~750450~860310~710600~950 480~700 Figure 3. The temperature history of system. Figure 4. The energy history of system. 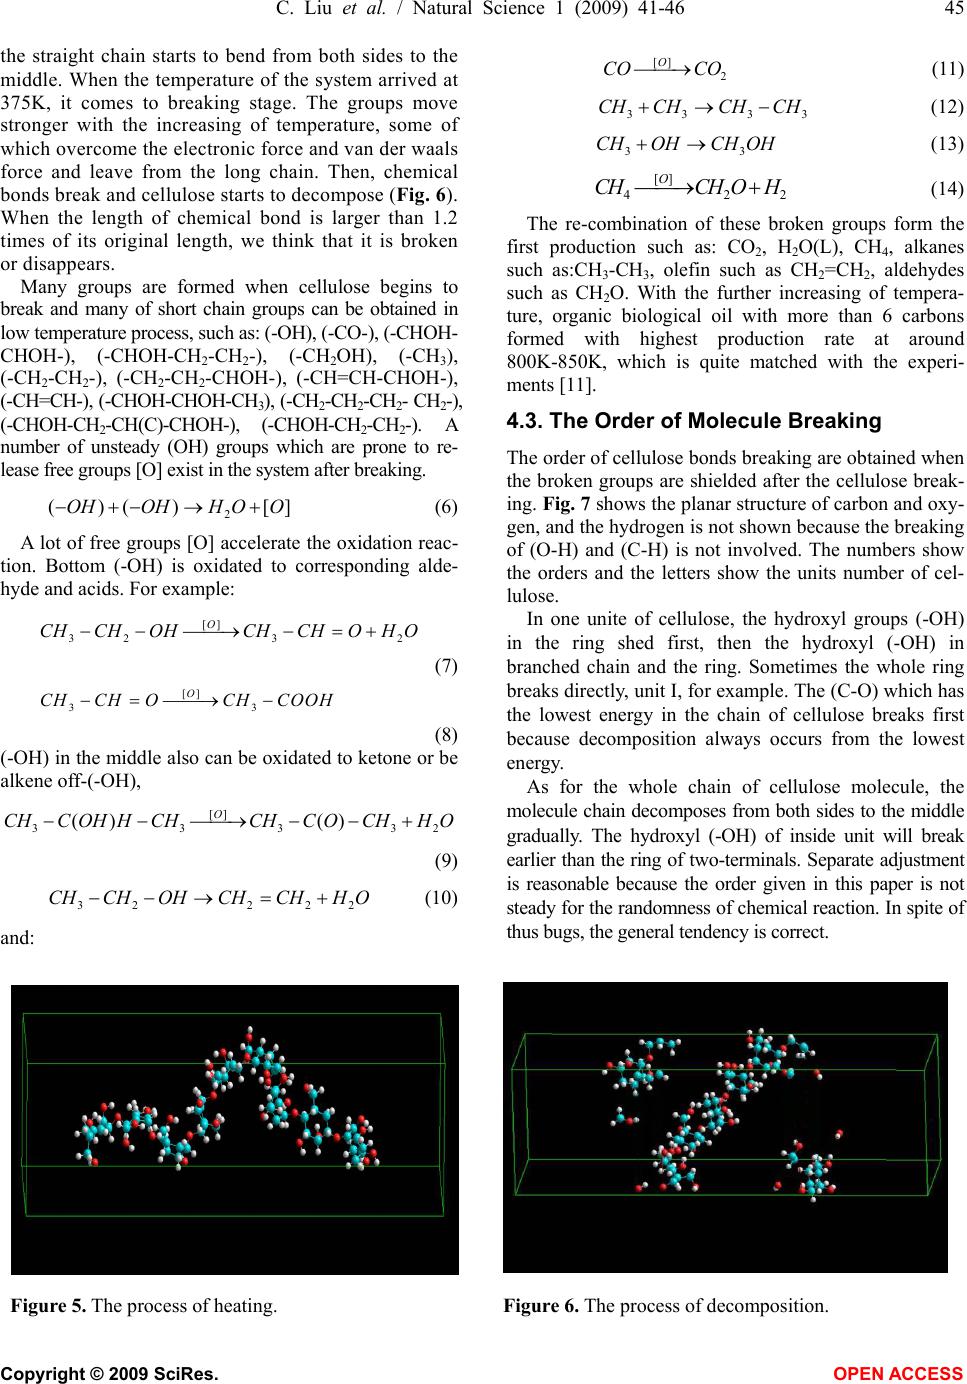 C. Liu et al. / Natural Science 1 (2009) 41-46 45 Copyright © 2009 SciRes. OPEN ACCESS the straight chain starts to bend from both sides to the middle. When the temperature of the system arrived at 375K, it comes to breaking stage. The groups move stronger with the increasing of temperature, some of which overcome the electronic force and van der waals force and leave from the long chain. Then, chemical bonds break and cellulose starts to decompose (Fig. 6). When the length of chemical bond is larger than 1.2 times of its original length, we think that it is broken or disappears. Many groups are formed when cellulose begins to break and many of short chain groups can be obtained in low temperature process, such as: (-OH), (-CO-), (-CHOH- CHOH-), (-CHOH-CH2-CH2-), (-CH2OH), (-CH3), (-CH2-CH2-), (-CH2-CH2-CHOH-), (-CH=CH-CHOH-), (-CH=CH-), (-CHOH-CHOH-CH3), (-CH2-CH2-CH2- CH2-), (-CHOH-CH2-CH(C)-CHOH-), (-CHOH-CH2-CH2-). A number of unsteady (OH) groups which are prone to re- lease free groups [O] exist in the system after breaking. 2 ()()[]OHOHH OO (6) A lot of free groups [O] accelerate the oxidation reac- tion. Bottom (-OH) is oxidated to corresponding alde- hyde and acids. For example: [] 323 2 O CH CHOHCH CHOHO (7) [] 33 O CH CHOCH COOH (8) (-OH) in the middle also can be oxidated to ketone or be alkene off-(-OH), [] 33332 () () O CHCOHHCHCHCOCHH O (9) 322 22 CHCHOHCHCHH O (10) and: [] 2 O CO CO (11) 33 33 CH CHCH CH (12) 33 CHOHCHOH (13) [] 422 O CHCH OH (14) The re-combination of these broken groups form the first production such as: CO2, H2O(L), CH4, alkanes such as:CH3-CH3, olefin such as CH2=CH2, aldehydes such as CH2O. With the further increasing of tempera- ture, organic biological oil with more than 6 carbons formed with highest production rate at around 800K-850K, which is quite matched with the experi- ments [11]. 4.3. The Order of Molecule Breaking The order of cellulose bonds breaking are obtained when the broken groups are shielded after the cellulose break- ing. Fig. 7 shows the planar structure of carbon and oxy- gen, and the hydrogen is not shown because the breaking of (O-H) and (C-H) is not involved. The numbers show the orders and the letters show the units number of cel- lulose. In one unite of cellulose, the hydroxyl groups (-OH) in the ring shed first, then the hydroxyl (-OH) in branched chain and the ring. Sometimes the whole ring breaks directly, unit I, for example. The (C-O) which has the lowest energy in the chain of cellulose breaks first because decomposition always occurs from the lowest energy. As for the whole chain of cellulose molecule, the molecule chain decomposes from both sides to the middle gradually. The hydroxyl (-OH) of inside unit will break earlier than the ring of two-terminals. Separate adjustment is reasonable because the order given in this paper is not steady for the randomness of chemical reaction. In spite of thus bugs, the general tendency is correct. Figure 5. The process of heating. Figure 6. The process of decomposition. 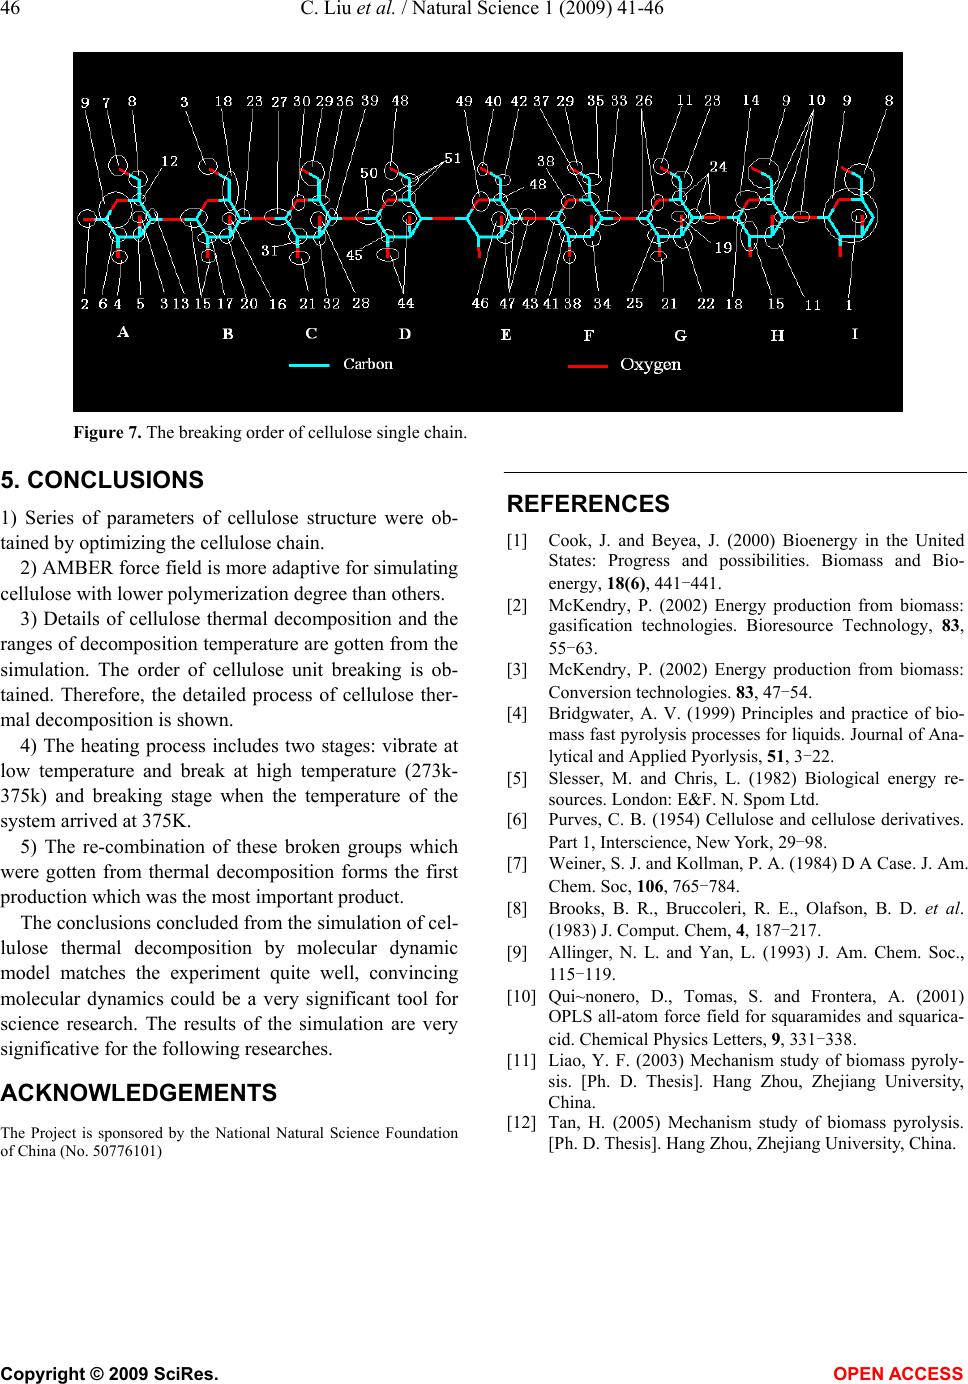 46 C. Liu et al. / Natural Science 1 (2009) 41-46 Copyright © 2009 SciRes. OPEN ACCESS Figure 7. The breaking order of cellulose single chain. 5. CONCLUSIONS 1) Series of parameters of cellulose structure were ob- tained by optimizing the cellulose chain. 2) AMBER force field is more adaptive for simulating cellulose with lower polymerization degree than others. 3) Details of cellulose thermal decomposition and the ranges of decomposition temperature are gotten from the simulation. The order of cellulose unit breaking is ob- tained. Therefore, the detailed process of cellulose ther- mal decomposition is shown. 4) The heating process includes two stages: vibrate at low temperature and break at high temperature (273k- 375k) and breaking stage when the temperature of the system arrived at 375K. 5) The re-combination of these broken groups which were gotten from thermal decomposition forms the first production which was the most important product. The conclusions concluded from the simulation of cel- lulose thermal decomposition by molecular dynamic model matches the experiment quite well, convincing molecular dynamics could be a very significant tool for science research. The results of the simulation are very significative for the following researches. ACKNOWLEDGEMENTS The Project is sponsored by the National Natural Science Foundation of China (No. 50776101) REFERENCES [1] Cook, J. and Beyea, J. (2000) Bioenergy in the United States: Progress and possibilities. Biomass and Bio- energy, 18(6), 441-441. [2] McKendry, P. (2002) Energy production from biomass: gasification technologies. Bioresource Technology, 83, 55-63. [3] McKendry, P. (2002) Energy production from biomass: Conversion technologies. 83, 47-54. [4] Bridgwater, A. V. (1999) Principles and practice of bio- mass fast pyrolysis processes for liquids. Journal of Ana- lytical and Applied Pyorlysis, 51, 3-22. [5] Slesser, M. and Chris, L. (1982) Biological energy re- sources. London: E&F. N. Spom Ltd. [6] Purves, C. B. (1954) Cellulose and cellulose derivatives. Part 1, Interscience, New York, 29-98. [7] Weiner, S. J. and Kollman, P. A. (1984) D A Case. J. Am. Chem. Soc, 106, 765-784. [8] Brooks, B. R., Bruccoleri, R. E., Olafson, B. D. et al. (1983) J. Comput. Chem, 4, 187-217. [9] Allinger, N. L. and Yan, L. (1993) J. Am. Chem. Soc., 115-119. [10] Qui~nonero, D., Tomas, S. and Frontera, A. (2001) OPLS all-atom force field for squaramides and squarica- cid. Chemical Physics Letters, 9, 331-338. [11] Liao, Y. F. (2003) Mechanism study of biomass pyroly- sis. [Ph. D. Thesis]. Hang Zhou, Zhejiang University, China. [12] Tan, H. (2005) Mechanism study of biomass pyrolysis. [Ph. D. Thesis]. Hang Zhou, Zhejiang University, China. |