

Paper Menu >>
Journal Menu >>
 Vol.2, No.2, 94-103 (2011) doi:10.4236/as.2011.22014 C opyright © 2011 SciRes. Openly accessible at http://www.scirp.org/journal/AS/ Agricultural Sciences Response of different corn populations to fertigated nitrogen and certain micronutrients in sandy soil Ahmed Attia1*, Charles Shapiro2, Mohamed Gomaa1, Ragab Aly1, Abd El-Raham Omar1 1Agronomy Department, Faculty of Agriculture, Zagazig University, Zagazig, Egypt; *Corresponding Author: [email protected] 2Northeast Research and Extension Center Haskell Agricultural Laboratory, University of Nebraska-Lincoln, Concord, USA. Received 7 November 2010; revised 16 February 2011; accepted 7 March 2011. ABSTRACT A field study was conducted during 2008 and 2009 at El-Khattara farm station, Zagazig Uni- versity, Sharkyia, Egypt (30°36' N, 32°15' E) to determine the effect of three N rates (214, 273, and 333 kg·N·ha–1), four micronutrients spray treatments (Check, Zn, Mn, and Zn + Mn), and three planting density levels (4.76, 5.7 1, and 6.66 plant·m–2) on growth and grain yield of corn (Zea mays, L). The soil was sandy (Entisols) and groundwater was used for irrigation. Response to N was maximized to 214 kg·ha–1 without a significant effect on most growth traits and grain yield. Agronomic efficiency of N use for grain yield w as negatively related to N rate (r2 = 0.49). Application of micronutrients had no ef- fect on most gro wth and yield characters excep t a significant increase by 9.5, 8.7, and 9% in plant weight (g·plant–1), biomass yield (kg·m–2), and N agronomic efficiency for biomass yield, respec- tively. Growth was decreased by increasing plant density without affecting harvest index, agronomic efficiency, biomass yield, and grain yield. The application of Zn to the highest maize plant density increased grain yield by 16% as compared to the check. It is recommended, as predicated by the linear model, that N fertigation rate should be around 220 kg·ha–1 with plant density of 6.66 plant·m–2 accompanied by Zn application for maximum irrigated corn grain yield in sandy soil. Abbreviations: DAS, days after sowing; LA, leaf area; LAI, leaf area index; RPP, relative photosynthetic potential; HI, har- vest index; BW, plant weight g·plant–1, GYP, grain yield g·plant–1, BYM, biomass yield kg·m–2, GYM, grain yield kg·m–2, NAE, nitrogen agro- nomic efficiency. Keywords: Fertigation; Micronutrients; Plant Density; Sandy Soil 1. INTRODUCTION The increased demand of maize (Zea mays, L.) by baking and cellulosic biomass industries requires ex- panding the growing areas to newly reclaimed and sandy soils. Drip irrigation system has become a popular tech- nique to reduce the amount of water and fertilizers ap- plied [1]. Growing corn in rotation with other field and vegetable crops in sandy soil secures a sustainable agri- culture to reduce the gap between production and con- sumption. Though, sandy soil characterized with low cation ex- change capacity and soil organic matter [2] it was proved that fertigation increases fertilizer use efficiency since nutrients are applied to the active root zone which re- duces losses of nutrients through leaching or soil fixation [3]. There are mixed literature reviews on corn response to different N levels. For instance, under similar condi- tion to the present study corn grain yield has been sig- nificantly affected by increasing N rate from 190 to 380 kg N ha–1 [4] while plateaued at 180 kg·ha–1 fertigation rate in another study [5]. Also, a positive response for corn grain yield has been recorded for N application up to 285 kg N ha–1 [6]. These inconsistencies in results may appear as soil characteristics and other environ- mental conditions change. As sandy soil has poor water and nutrients retention while the high N requirement of corn, adequate level of N must be applied to insure suf- ficiency. On the other side, there is increased concern about groundwater pollution by nitrate (NO3-N) which attributed to excessive N fertilizer application [7]. There fore, determining crop response to narrow range of N levels is so important for more understanding to corn N requirement for these newly developed areas. The importance of foliar fertilization with different macro and micronutrients on growth, photosynthetic activity of leaves, and grain yield has been reported by [8,9]. Deficiency of Mn induces growth inhibition, chlorosis and necrosis, early leaf fall, and low reutiliza- tion [10]. Some workers reported a significant increase 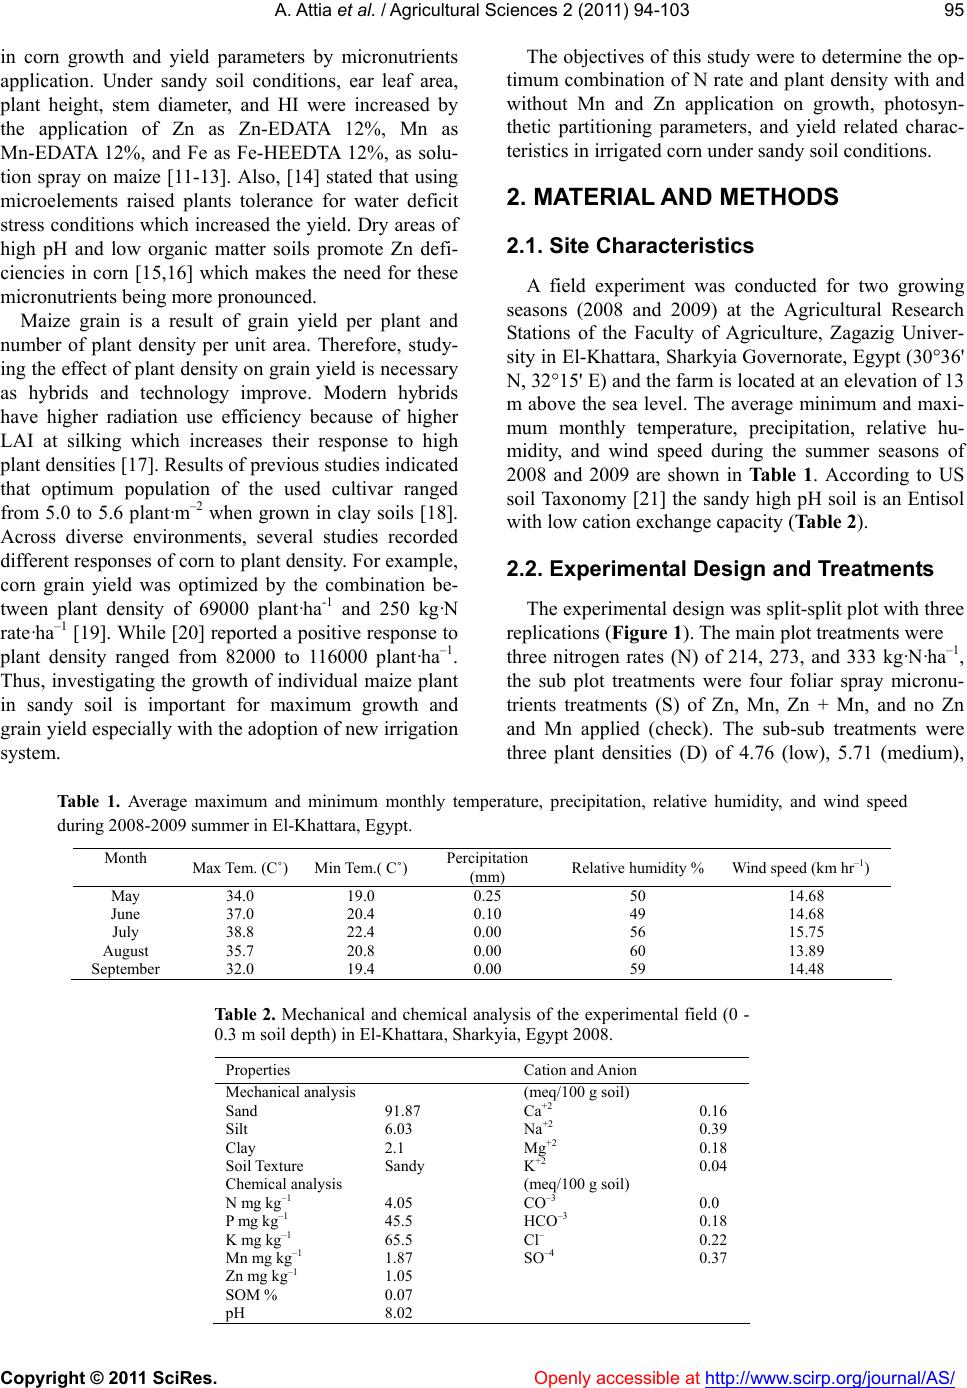 A. Attia et al. / Agricultural Sciences 2 (2 011) 94-103 Copyright © 2011 SciRes. Openl y accessible at http://www.scirp.org/journal/AS/ 95 in corn growth and yield parameters by micronutrients application. Under sandy soil conditions, ear leaf area, plant height, stem diameter, and HI were increased by the application of Zn as Zn-EDATA 12%, Mn as Mn-EDATA 12%, and Fe as Fe-HEEDTA 12%, as solu- tion spray on maize [11-13]. Also, [14] stated that using microelements raised plants tolerance for water deficit stress conditions which increased th e yield. Dry areas of high pH and low organic matter soils promote Zn defi- ciencies in corn [15,16] which makes the need for these micronutrient s bei n g m ore pr o no u nced . Maize grain is a result of grain yield per plant and number of plant density per unit area. Therefore, study- ing the effect of plant density on grain yield is necessary as hybrids and technology improve. Modern hybrids have higher radiation use efficiency because of higher LAI at silking which increases their response to high plant densities [17]. Results of previous studies indicated that optimum population of the used cultivar ranged from 5.0 to 5.6 plant·m–2 when grown in clay soils [18]. Across diverse environments, several studies recorded different r espons es of corn to plan t den sity. For example , corn grain yield was optimized by the combination be- tween plant density of 69000 plant·ha-1 and 250 kg·N rate·ha–1 [19]. While [20] reported a positive respon se to plant density ranged from 82000 to 116000 plant·ha–1. Thus, investigating the growth of individual maize plant in sandy soil is important for maximum growth and grain yield especially with the adop tion of new irrigation system. The objectives of this study were to determine the op- timum combination of N rate and plant density with and without Mn and Zn application on growth, photosyn- thetic partitioning parameters, and yield related charac- teristics in irrigated corn under sandy soil conditions. 2. MATERIAL AND METHODS 2.1. Site Characteristics A field experiment was conducted for two growing seasons (2008 and 2009) at the Agricultural Research Stations of the Faculty of Agriculture, Zagazig Univer- sity in El-Khattara, Sharkyia Governorate, Egypt (30°36' N, 32°15' E) and the farm is located at an elevation of 13 m above the sea level. The average minimum and maxi- mum monthly temperature, precipitation, relative hu- midity, and wind speed during the summer seasons of 2008 and 2009 are shown in Ta b l e 1 . According to US soil Taxonomy [21] the sandy high pH soil is an Entisol with low cation exchange capacity (Table 2). 2.2. Experimental Design and Treatments The experimental design was split-split p lot with three replications (Figure 1). The main plot treatments were three nitrogen rates (N) of 214, 273, and 333 kg·N·ha–1, the sub plot treatments were four foliar spray micronu- trients treatments (S) of Zn, Mn, Zn + Mn, and no Zn and Mn applied (check). The sub-sub treatments were three plant densities (D) of 4.76 (low), 5.71 (medium), Table 1. Average maximum and minimum monthly temperature, precipitation, relative humidity, and wind speed during 2008-2009 summer in El-Khattara, Egypt. Month Max Tem. (C˚) Min Tem.( C˚)Percipitation (mm) Relative humidity % Wind speed (km hr–1) May June July August September 34.0 37.0 38.8 35.7 32.0 19.0 20.4 22.4 20.8 19.4 0.25 0.10 0.00 0.00 0.00 50 49 56 60 59 14.68 14.68 15.75 13.89 14.48 Table 2. Mechanical and chemical analysis of the experimental field (0 - 0.3 m soil depth) in El-Khattara, Sharkyia, Egypt 2008. Properties Cation and Anion Mechanical analysis Sand Silt Clay Soil Texture Chemical analysis N mg kg–1 P mg kg–1 K mg kg–1 Mn mg kg–1 Zn mg kg–1 SOM % pH 91.87 6.03 2.1 Sandy 4.05 45.5 65.5 1.87 1.05 0.07 8.02 (meq/100 g soil) Ca+2 Na+2 Mg+2 K+2 (meq/100 g soil) CO–3 HCO–3 Cl– SO–4 0.16 0.39 0.18 0.04 0.0 0.18 0.22 0.37 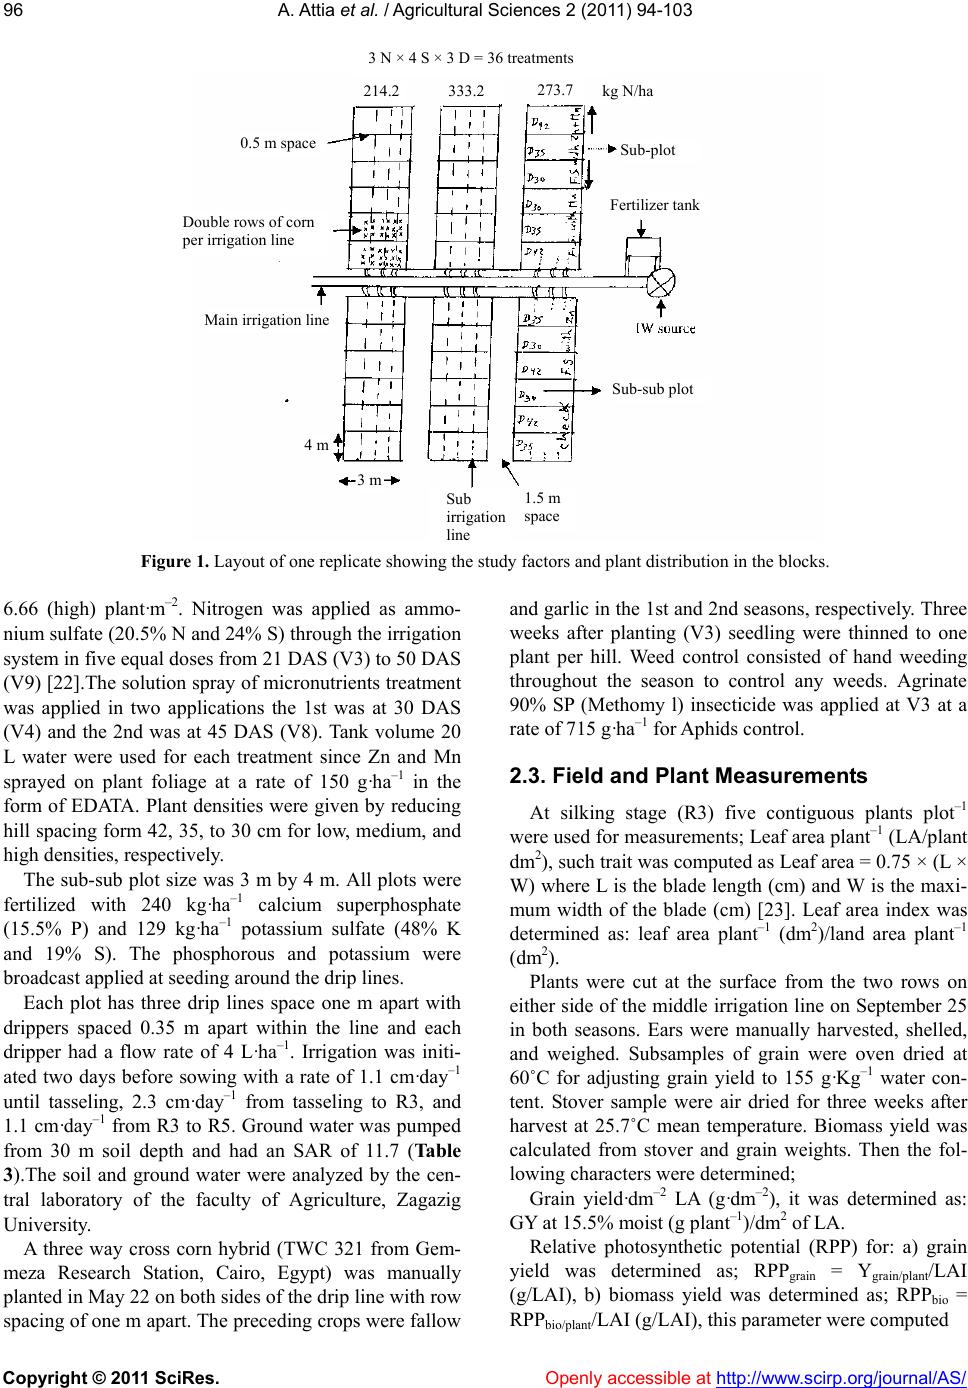 A. Attia et al. / Agricultural Sciences 2 (2 011) 94-103 Copyright © 2011 SciRes. Openly accessible at http://www.scirp.org/journal/AS/ 96 Figure 1. Layout of one replicate showing the study factors and plant distribution in the blocks. 6.66 (high) plant·m–2. Nitrogen was applied as ammo- nium sulfate (20.5% N and 24% S) through the irrigation system in five equal doses from 21 DAS (V3) to 50 DAS (V9) [22].The solution spray of micronutrients treatment was applied in two applications the 1st was at 30 DAS (V4) and the 2nd was at 45 DAS (V8). Tank volume 20 L water were used for each treatment since Zn and Mn sprayed on plant foliage at a rate of 150 g·ha–1 in the form of EDATA. Plant densities were given by reducing hill spacing form 42, 35, to 30 cm for low, medium, and high densities, respectively. The sub-sub plot size was 3 m by 4 m. All plots were fertilized with 240 kg·ha–1 calcium superphosphate (15.5% P) and 129 kg·ha–1 potassium sulfate (48% K and 19% S). The phosphorous and potassium were broadcast applied at seeding around the drip lines. Each plot has three drip lines space one m apart with drippers spaced 0.35 m apart within the line and each dripper had a flow rate of 4 L·ha–1. Irrigation was initi- ated two days before sowing with a rate of 1.1 cm·day–1 until tasseling, 2.3 cm·day–1 from tasseling to R3, and 1.1 cm·day–1 from R3 to R5. Ground water was pumped from 30 m soil depth and had an SAR of 11.7 (Table 3).The soil and ground water were analyzed by the cen- tral laboratory of the faculty of Agriculture, Zagazig University. A three way cross corn hybrid (TWC 321 from Gem- meza Research Station, Cairo, Egypt) was manually planted in May 22 on both sides of the drip line with row spacing of one m apart. The preceding crops were fallow and garlic in the 1st and 2nd seasons, respectively. Three weeks after planting (V3) seedling were thinned to one plant per hill. Weed control consisted of hand weeding throughout the season to control any weeds. Agrinate 90% SP (Methomy l) insecticide was applied at V3 at a rate of 715 g·ha–1 for Aphids control. 2.3. Field and Plant Measurements At silking stage (R3) five contiguous plants plot–1 were used for measurements; Leaf area plant–1 (LA/plant dm2), such trait was computed as Leaf area = 0.75 × (L × W) where L is the blade length (cm) and W is the maxi- mum width of the blade (cm) [23]. Leaf area index was determined as: leaf area plant–1 (dm2)/land area plant–1 (dm2). Plants were cut at the surface from the two rows on either side of the middle irrigation line on September 25 in both seasons. Ears were manually harvested, shelled, and weighed. Subsamples of grain were oven dried at 60˚C for adjusting grain yield to 155 g·Kg–1 water con- tent. Stover sample were air dried for three weeks after harvest at 25.7˚C mean temperature. Biomass yield was calculated from stover and grain weights. Then the fol- lowing characters were determined ; Grain yield·dm–2 LA (g·dm–2), it was determined as: GY at 15.5% moist (g plant–1)/dm2 of LA. Relative photosynthetic potential (RPP) for: a) grain yield was determined as; RPPgrain = Ygrain/plant/LAI (g/LAI), b) biomass yield was determined as; RPPbio = RPPbio/plant/LAI (g/LAI), this parameter were computed 3 N × 4 S × 3 D = 36 treatments kg N/ha Sub-plot Fertilizer tank Sub-sub plot 1.5 m space Sub irrigation line 3 m 4 m Main irrigation line Double rows of corn p er irrigation line 0.5 m space 214.2 333.2 273.7 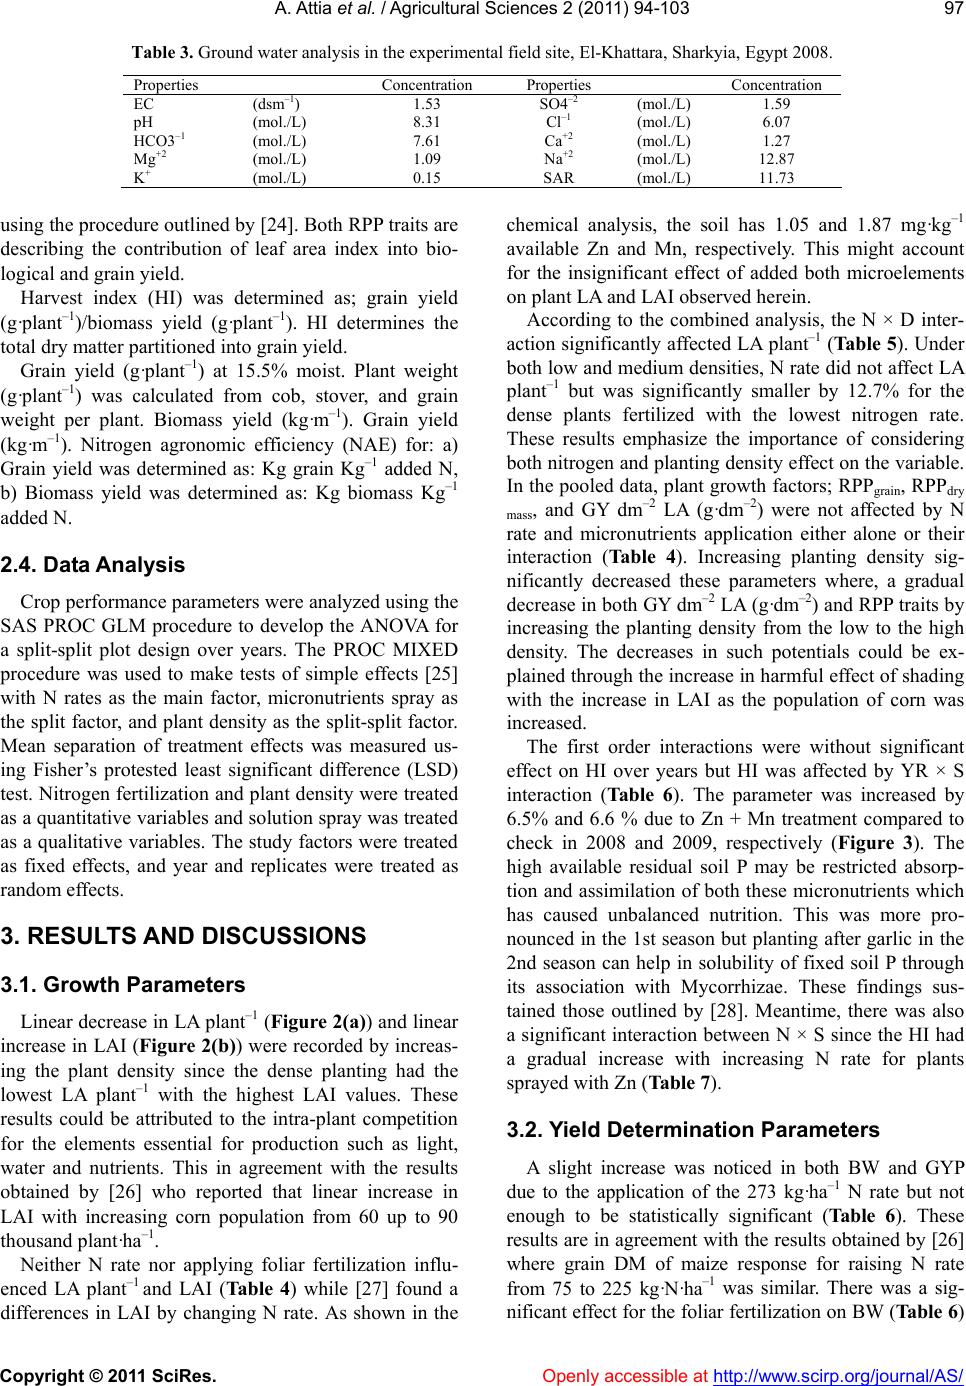 A. Attia et al. / Agricultural Sciences 2 (2 011) 94-103 Copyright © 2011 SciRes. Openly accessible at http://www.scirp.org/journal/AS/ 97 Table 3. Ground water analysis in the experimental field site, El-Khattara, Sharkyia, Egypt 2008. Properties Concentration Properties Concentration EC pH HCO3–1 Mg+2 K+ (dsm–1) (mol./L) (mol./L) (mol./L) (mol./L) 1.53 8.31 7.61 1.09 0.15 SO4–2 Cl–1 Ca+2 Na+2 SAR (mol./L) (mol./L) (mol./L) (mol./L) (mol./L) 1.59 6.07 1.27 12.87 11.73 using the procedure outlined by [24]. Both RPP traits are describing the contribution of leaf area index into bio- logical and grain yield. Harvest index (HI) was determined as; grain yield (g·plant–1)/biomass yield (g·plant–1). HI determines the total dry matter partitioned into grain yield. Grain yield (g·plant–1) at 15.5% moist. Plant weight (g·plant–1) was calculated from cob, stover, and grain weight per plant. Biomass yield (kg·m–1). Grain yield (kg·m–1). Nitrogen agronomic efficiency (NAE) for: a) Grain yield was determined as: Kg grain Kg–1 added N, b) Biomass yield was determined as: Kg biomass Kg–1 added N. 2.4. Data Analysis Crop performance parameters were analyzed using the SAS PROC GLM procedure to develop the ANOVA for a split-split plot design over years. The PROC MIXED procedure was used to make tests of simple effects [25] with N rates as the main factor, micronutrients spray as the split factor, and plant density as the split-split factor. Mean separation of treatment effects was measured us- ing Fisher’s protested least significant difference (LSD) test. Nitrogen fertilization and plant d ensity were treated as a quantitative variab les and solution spray was treated as a qualitative variables. The study factors were treated as fixed effects, and year and replicates were treated as random effects. 3. RESULTS AND DIS CUS SIONS 3.1. Growth Parameters Linear decrease in LA plant–1 (Figure 2(a)) and linear increase in LAI (Figure 2(b)) were recorded by increas- ing the plant density since the dense planting had the lowest LA plant–1 with the highest LAI values. These results could be attributed to the intra-plant competition for the elements essential for production such as light, water and nutrients. This in agreement with the results obtained by [26] who reported that linear increase in LAI with increasing corn population from 60 up to 90 thousand plant·ha–1. Neither N rate nor applying foliar fertilization influ- enced LA plant–1 and LAI (Ta b l e 4 ) while [27] found a differences in LAI by changing N rate. As shown in the chemical analysis, the soil has 1.05 and 1.87 mg·kg–1 available Zn and Mn, respectively. This might account for the insignificant effect of added both microelements on plant LA and LAI observed herein. According to the combined analysis, the N × D inter- action significantly affected LA plant–1 (Table 5). Under both low and medium densities, N rate did not affect LA plant–1 but was significantly smaller by 12.7% for the dense plants fertilized with the lowest nitrogen rate. These results emphasize the importance of considering both nitrogen and planting density effect on the variable. In the pooled data, plant growth factors; RPPgrain, RPPdry mass, and GY dm–2 LA (g·dm–2) were not affected by N rate and micronutrients application either alone or their interaction (Table 4). Increasing planting density sig- nificantly decreased these parameters where, a gradual decrease in both GY dm–2 LA (g·dm–2) and RPP traits by increasing the planting density from the low to the high density. The decreases in such potentials could be ex- plained through the increase in harmfu l effect of shading with the increase in LAI as the population of corn was increased. The first order interactions were without significant effect on HI over years but HI was affected by YR × S interaction (Table 6). The parameter was increased by 6.5% and 6.6 % due to Zn + Mn treatment compared to check in 2008 and 2009, respectively (Figure 3). The high available residual soil P may be restricted absorp- tion and assimilation of both these micronutrients which has caused unbalanced nutrition. This was more pro- nounced in the 1s t season bu t plan ting after garlic in the 2nd season can help in solubility of fixed soil P through its association with Mycorrhizae. These findings sus- tained those outlined by [28]. Meantime, there was also a significant interaction between N × S since the HI had a gradual increase with increasing N rate for plants sprayed with Zn (Table 7). 3.2. Yield Determination Parameters A slight increase was noticed in both BW and GYP due to the application of the 273 kg·ha–1 N rate but not enough to be statistically significant (Table 6). These results are in agreement with the results obtained by [26] where grain DM of maize response for raising N rate from 75 to 225 kg·N·ha–1 was similar. There was a sig- nificant effect for the foliar fertilizatio n on BW (Table 6) 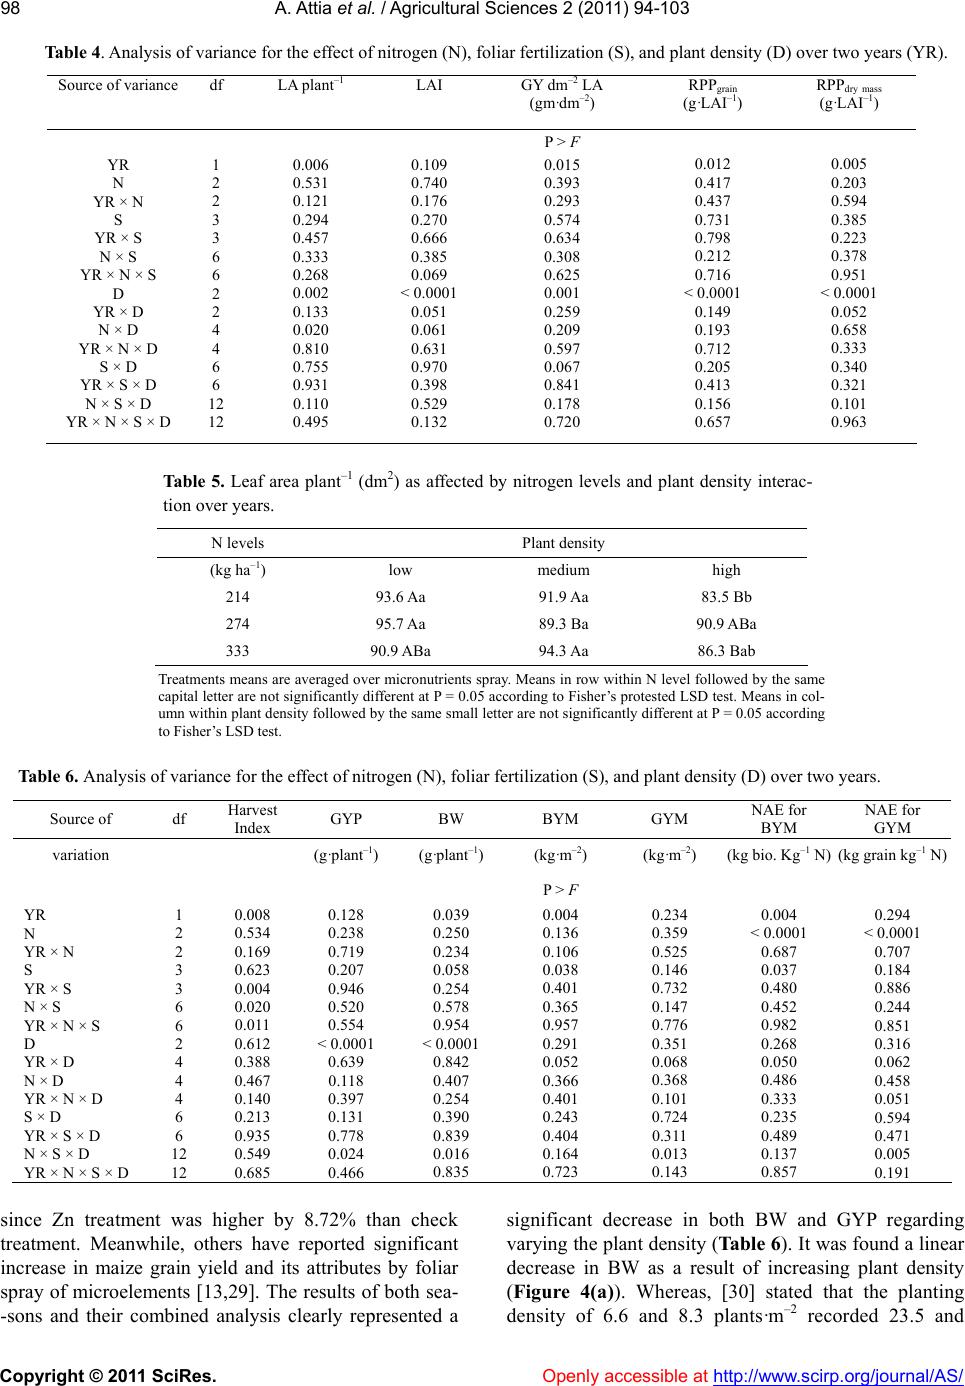 A. Attia et al. / Agricultural Sciences 2 (2 011) 94-103 Copyright © 2011 SciRes. Openly accessible at http://www.scirp.org/journal/AS/ 98 Table 4. Analysis of variance for the effect of nitrogen (N), foliar fertilization (S), and plant density (D) over two years (YR). Source of variance df LA plant–1 LAI GY dm–2 LA (gm·dm–2) RPPgrain (g·LAI–1) RPPdry mass (g·LAI–1) P > F YR N YR × N S YR × S N × S YR × N × S D YR × D N × D YR × N × D S × D YR × S × D N × S × D YR × N × S × D 1 2 2 3 3 6 6 2 2 4 4 6 6 12 12 0.006 0.531 0.121 0.294 0.457 0.333 0.268 0.002 0.133 0.020 0.810 0.755 0.931 0.110 0.495 0.109 0.740 0.176 0.270 0.666 0.385 0.069 < 0.0001 0.051 0.061 0.631 0.970 0.398 0.529 0.132 0.015 0.393 0.293 0.574 0.634 0.308 0.625 0.001 0.259 0.209 0.597 0.067 0.841 0.178 0.720 0.012 0.417 0.437 0.731 0.798 0.212 0.716 < 0.0001 0.149 0.193 0.712 0.205 0.413 0.156 0.657 0.005 0.203 0.594 0.385 0.223 0.378 0.951 < 0.0001 0.052 0.658 0.333 0.340 0.321 0.101 0.963 Ta ble 5. Leaf area plant–1 (dm2) as affected by nitrogen levels and plant density interac- tion over years. N levels Plant density (kg ha–1) low medium high 214 93.6 Aa 91.9 Aa 8 3.5 Bb 274 95.7 Aa 89.3 Ba 90.9 ABa 333 90.9 ABa 94.3 Aa 86.3 Bab Treatments means are av eraged ov er micronut rients spr ay. Means in ro w within N level followed b y the same capital letter are not significantly different at P = 0.05 according to Fisher ’s protested LSD test. Means in col- umn withi n pl ant dens it y fol lowed by t he sa me sm all l ett er ar e no t s ign ifi cant ly differen t at P = 0.05 accordi ng to Fisher’s LSD test. Table 6. Analysis of variance for the effect of nitrogen (N), foliar fertilization (S), and plant density (D) over two years. Source of df Harvest Index GYP BW BYM GYM NAE for BYM NAE for GYM variation (g·plant–1) (g·plant–1) (kg·m–2) (kg·m–2) (kg bio. Kg–1 N) (kg grain kg–1 N) P > F YR N YR × N S YR × S N × S YR × N × S D YR × D N × D YR × N × D S × D YR × S × D N × S × D YR × N × S × D 1 2 2 3 3 6 6 2 4 4 4 6 6 12 12 0.008 0.534 0.169 0.623 0.004 0.020 0.011 0.612 0.388 0.467 0.140 0.213 0.935 0.549 0.685 0.128 0.238 0.719 0.207 0.946 0.520 0.554 < 0.0001 0.639 0.118 0.397 0.131 0.778 0.024 0.466 0.039 0.250 0.234 0.058 0.254 0.578 0.954 < 0.0001 0.842 0.407 0.254 0.390 0.839 0.016 0.835 0.004 0.136 0.106 0.038 0.401 0.365 0.957 0.291 0.052 0.366 0.401 0.243 0.404 0.164 0.723 0.234 0.359 0.525 0.146 0.732 0.147 0.776 0.351 0.068 0.368 0.101 0.724 0.311 0.013 0.143 0.004 < 0.0001 0.687 0.037 0.480 0.452 0.982 0.268 0.050 0.486 0.333 0.235 0.489 0.137 0.857 0.294 < 0.0001 0.707 0.184 0.886 0.244 0.851 0.316 0.062 0.458 0.051 0.594 0.471 0.005 0.191 since Zn treatment was higher by 8.72% than check treatment. Meanwhile, others have reported significant increase in maize grain yield and its attributes by foliar spray of microelements [13,29]. The results of both sea- -sons and their combined analysis clearly represented a significant decrease in both BW and GYP regarding varying the plant density (Table 6). It was found a lin ear decrease in BW as a result of increasing plant density (Figure 4(a)). Whereas, [30] stated that the planting density of 6.6 and 8.3 plants·m–2 recorded 23.5 and 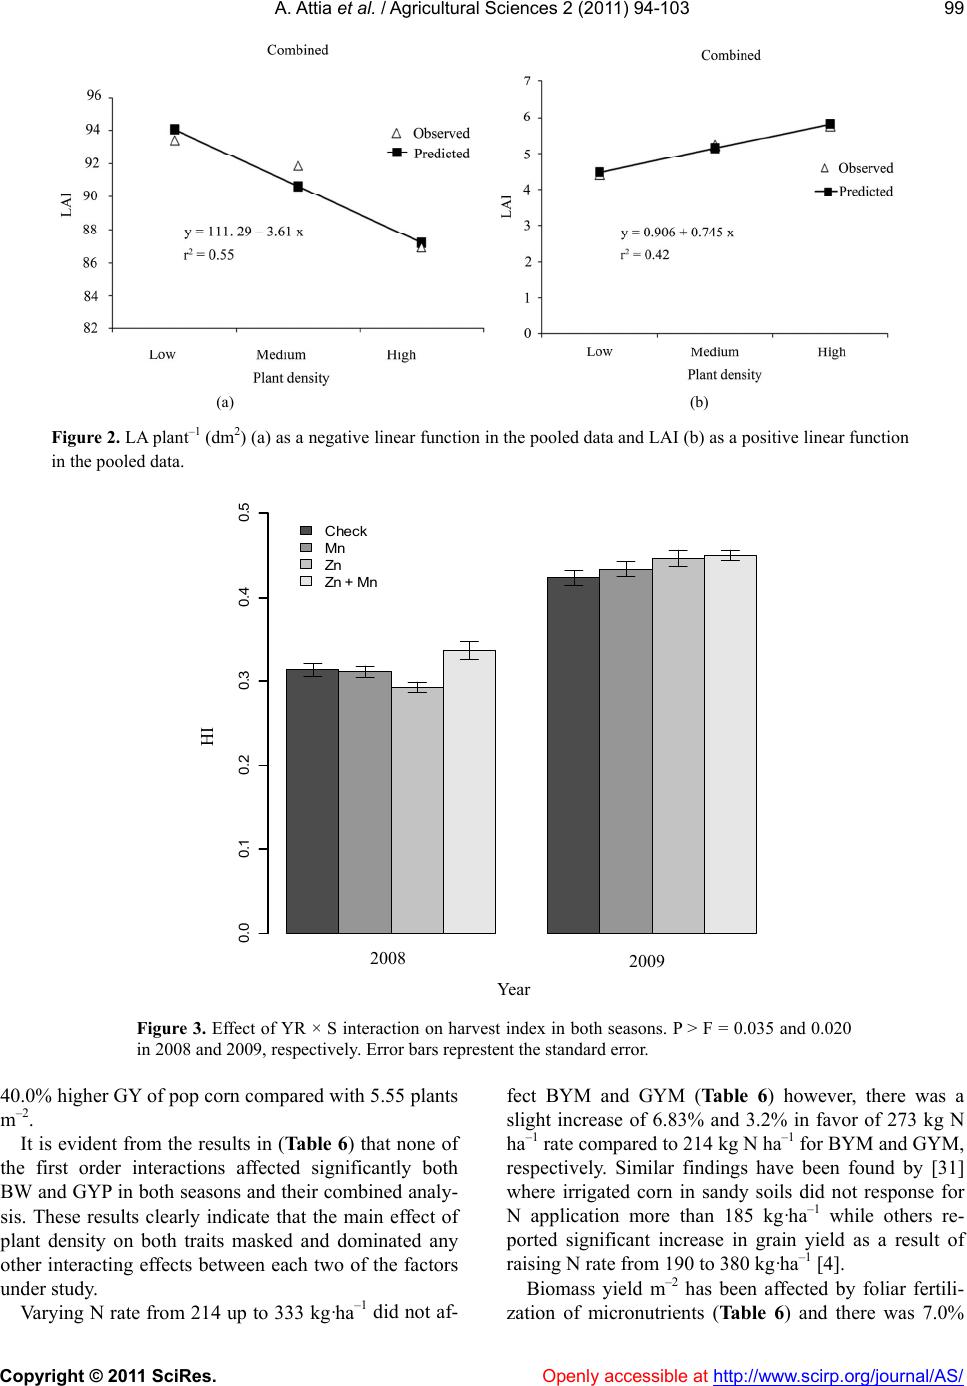 A. Attia et al. / Agricultural Sciences 2 (2 011) 94-103 Copyright © 2011 SciRes. Openly accessible at http://www.scirp.org/journal/AS/ 99 (a) (b) Figure 2. LA plant–1 (dm2) (a) as a negative linear function in the pooled data and LAI (b) as a positive linear function in the pooled data. 2008 2009 Year HI 0.00.1 0.2 0.3 0.40.5 Check Mn Zn Zn + Mn Figure 3. Effect of YR × S interaction on harvest index in both seasons. P > F = 0.035 and 0.020 in 2008 and 2009, respectively. Error bars represtent the standard error. 40.0% higher GY of pop corn compared with 5.55 plants m–2. It is evident from the results in (Table 6) that none of the first order interactions affected significantly both BW and GYP in both seasons and their combined analy- sis. These results clearly indicate that the main effect of plant density on both traits masked and dominated any other interacting effects between each two of the factors under study. Varying N rate from 214 up to 333 kg·ha–1 did not af- fect BYM and GYM (Table 6) however, there was a slight increase of 6.83% and 3.2% in favor of 273 kg N ha–1 rate compared to 2 14 kg N ha–1 for BYM and GYM, respectively. Similar findings have been found by [31] where irrigated corn in sandy soils did not response for N application more than 185 kg·ha–1 while others re- ported significant increase in grain yield as a result of raising N rate from 190 to 380 kg·ha–1 [4]. Biomass yield m–2 has been affected by foliar fertili- zation of micronutrients (Table 6) and there was 7.0% HI 2008 2009 Year 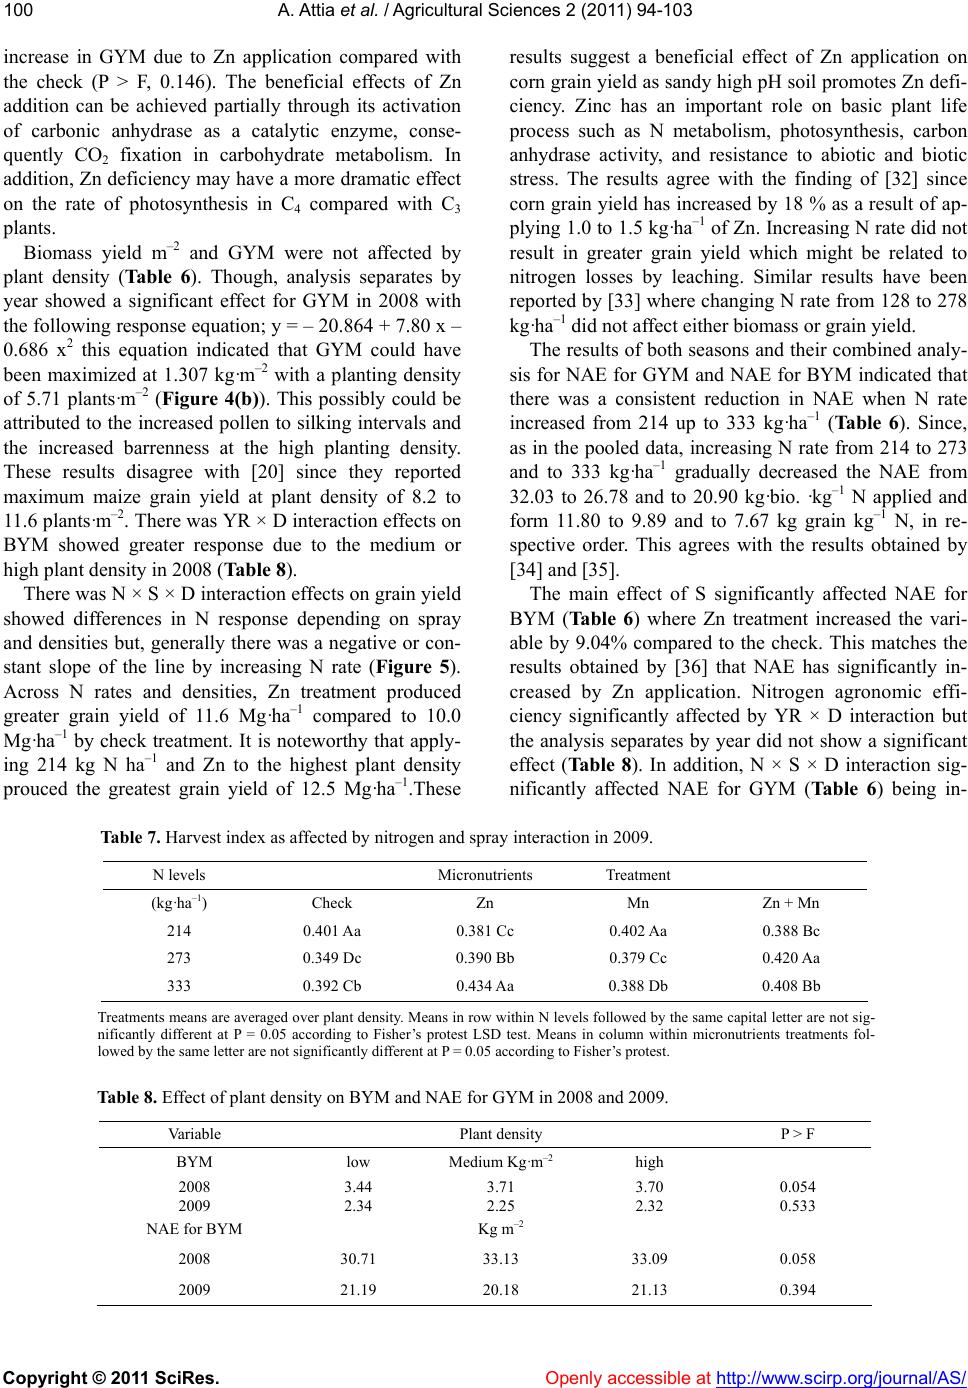 A. Attia et al. / Agricultural Sciences 2 (2 011) 94-103 Copyright © 2011 SciRes. Openly accessible at http://www.scirp.org/journal/AS/ 100 increase in GYM due to Zn application compared with the check (P > F, 0.146). The beneficial effects of Zn addition can be achieved partially through its activation of carbonic anhydrase as a catalytic enzyme, conse- quently CO2 fixation in carbohydrate metabolism. In addition, Zn deficiency may have a more dramatic effect on the rate of photosynthesis in C4 compared with C3 plants. Biomass yield m–2 and GYM were not affected by plant density (Table 6). Though, analysis separates by year showed a significant effect for GYM in 2008 with the following respon se equ ation; y = – 20.864 + 7.80 x – 0.686 x2 this equation indicated that GYM could have been maximized at 1.307 kg·m–2 with a planting density of 5.71 plants·m–2 (Figure 4(b)). This possibly could be attributed to the increased po llen to silk ing interv als and the increased barrenness at the high planting density. These results disagree with [20] since they reported maximum maize grain yield at plant density of 8.2 to 11.6 p lants·m–2. There was YR × D interaction effects on BYM showed greater response due to the medium or high plant density in 2008 (Table 8). There was N × S × D interaction effects on grain yield showed differences in N response depending on spray and densities but, generally there was a negative or con- stant slope of the line by increasing N rate (Figure 5). Across N rates and densities, Zn treatment produced greater grain yield of 11.6 Mg·ha–1 compared to 10.0 Mg·ha–1 by check treatment. It is noteworthy that apply- ing 214 kg N ha–1 and Zn to the highest plant density prouced the greatest grain yield of 12.5 Mg·ha–1.These results suggest a beneficial effect of Zn application on corn grain yield as sandy high pH soil promotes Zn defi- ciency. Zinc has an important role on basic plant life process such as N metabolism, photosynthesis, carbon anhydrase activity, and resistance to abiotic and biotic stress. The results agree with the finding of [32] since corn grain yield has increased by 18 % as a result of ap- plying 1.0 to 1.5 kg·ha–1 of Zn. Increasing N rate did not result in greater grain yield which might be related to nitrogen losses by leaching. Similar results have been reported by [33] where changing N rate from 128 to 278 kg·ha–1 did not affect either biomass or grain yield. The results of both seasons and their combined analy- sis for NAE for GYM and NAE for BYM indicated that there was a consistent reduction in NAE when N rate increased from 214 up to 333 kg·ha–1 (Tabl e 6 ). Since, as in the pooled data, increasing N rate from 214 to 273 and to 333 kg·ha–1 gradually decreased the NAE from 32.03 to 26.78 and to 20.90 kg·bio. ·kg–1 N applied and form 11.80 to 9.89 and to 7.67 kg grain kg–1 N, in re- spective order. This agrees with the results obtained by [34] and [35]. The main effect of S significantly affected NAE for BYM (Ta b le 6 ) where Zn treatment increased the vari- able by 9.04% compared to the check. This matches the results obtained by [36] that NAE has significantly in- creased by Zn application. Nitrogen agronomic effi- ciency significantly affected by YR × D interaction but the analysis separates by year did not show a significant effect (Ta bl e 8 ). In addition, N × S × D interaction sig- nificantly affected NAE for GYM (Table 6) being in- Table 7. Harvest index as affected by nitrogen and spray interaction in 2009. N levels Micronutrients Treatment (kg·ha–1) Check Zn Mn Zn + Mn 214 0.401 Aa 0.381 Cc 0.402 Aa 0.388 Bc 273 0.349 Dc 0.390 Bb 0.379 Cc 0.420 Aa 333 0.392 Cb 0.434 Aa 0.388 Db 0. 40 8 Bb Treatments means are averaged over plant density. Means in row within N levels followed by the same capital letter are not sig- nificantly different at P = 0.05 according to Fisher’s protest LSD test. Means in column within micronutrients treatments fol- lowed by the same letter are not significantly different at P = 0.05 according to Fisher’s protest. Table 8. Effect of plant density on BYM and NAE for GYM in 2008 and 2009. Variable Plant density P > F BYM low Medium Kg·m–2 high 2008 2009 3.44 2.34 3.71 2.25 3.70 2.32 0.054 0.533 NAE for BYM Kg m –2 2008 30.71 33.13 33.09 0.058 2009 21.19 20.18 21.13 0.394 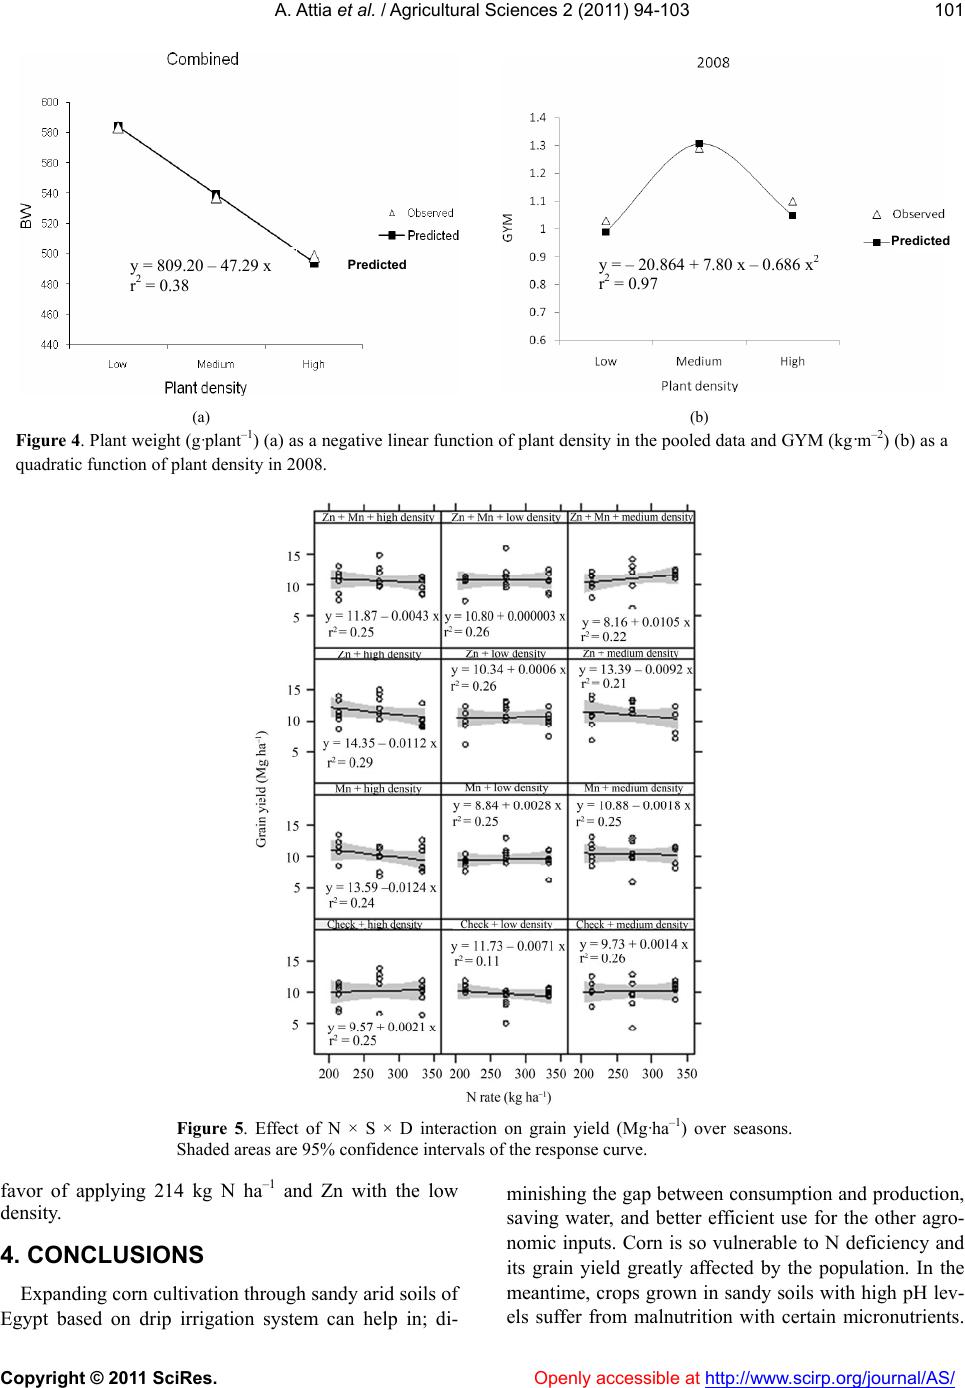 A. Attia et al. / Agricultural Sciences 2 (2 011) 94-103 Copyright © 2011 SciRes. Openl y accessible at http://www.scirp.org/journal/AS/ 101 (a) (b) Figure 4. Plant weight (g·plant–1) (a) as a negative linear function of plant density in the pooled data and GYM (kg·m–2) (b) as a quadratic function of plant density in 2008. Figure 5. Effect of N × S × D interaction on grain yield (Mg·ha–1) over seasons. Shaded areas are 95% confidence intervals of the response curve. favor of applying 214 kg N ha–1 and Zn with the low density. 4. CONCLUSIONS Expanding corn cultivatio n through sandy arid soils of Egypt based on drip irrigation system can help in; di- minishing the ga p between consumption and productio n, saving water, and better efficient use for the other agro- nomic inputs. Corn is so vulnerable to N deficiency and its grain yield greatly affected by the population. In the meantime, crops grown in sandy soils with high pH lev- els suffer from malnutrition with certain micronutrients. y = 809.20 – 47.29 x r2 = 0.38 y = – 20.864 + 7.80 x – 0.686 x 2 r2 = 0.97 Predicted Predicted 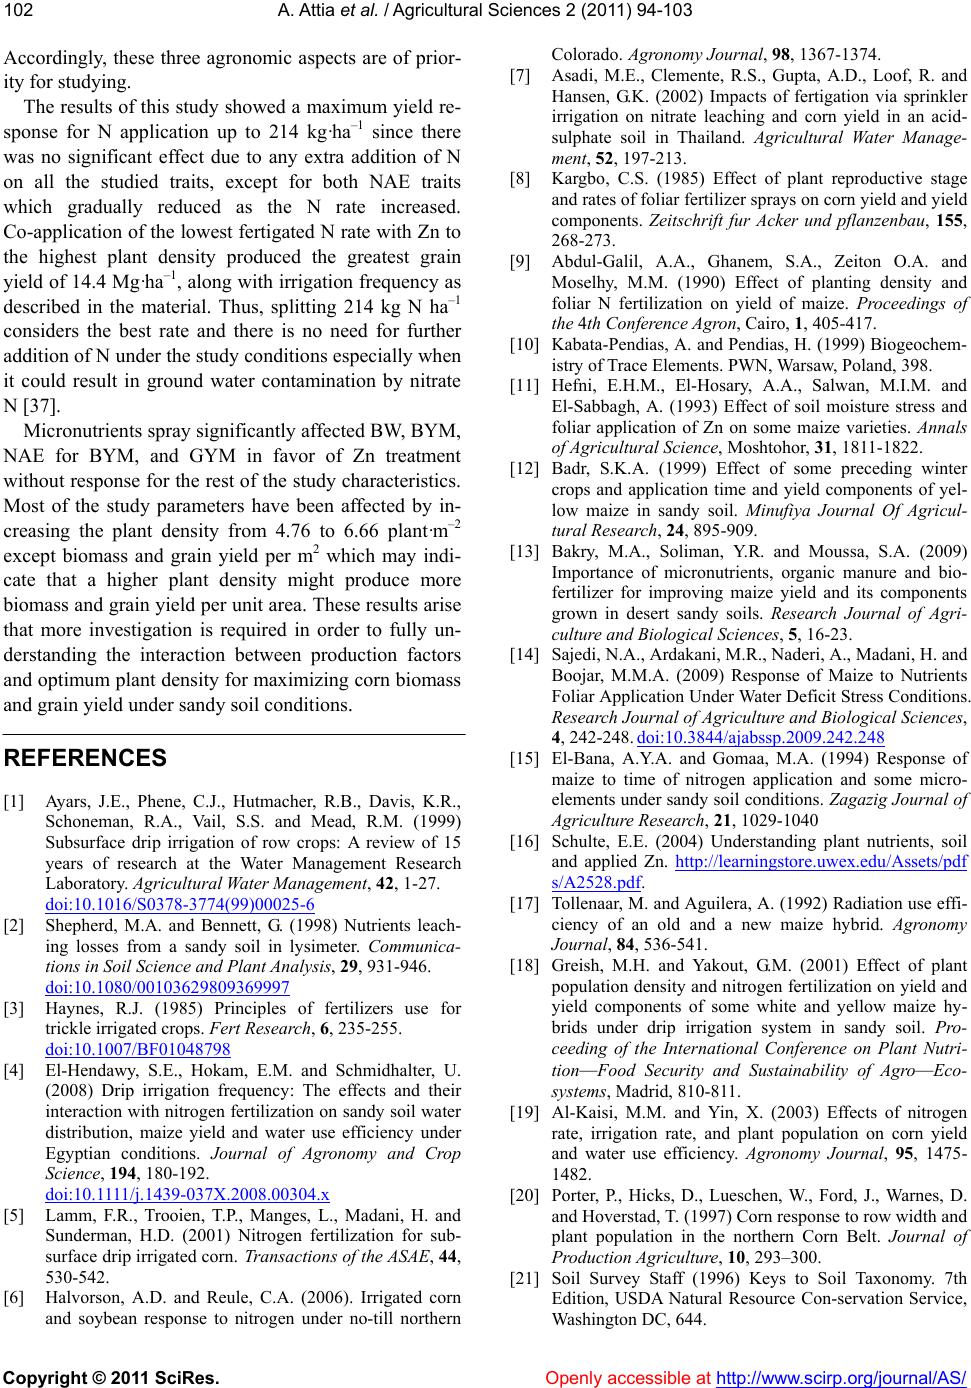 A. Attia et al. / Agricultural Sciences 2 (2 011) 94-103 Copyright © 2011 SciRes. Openly accessible at http://www.scirp.org/journal/AS/ 102 Accordingly, these three agronomic aspects are of prior- ity for studying. The results of this study showed a maximum yield re- sponse for N application up to 214 kg·ha–1 since there was no significant effect due to any extra addition of N on all the studied traits, except for both NAE traits which gradually reduced as the N rate increased. Co-application of the lowest fertigated N rate with Zn to the highest plant density produced the greatest grain yield of 14.4 Mg·ha–1, along with irrig ation frequency as described in the material. Thus, splitting 214 kg N ha–1 considers the best rate and there is no need for further addition of N under the study conditio ns especially when it could result in ground water contamination by nitrate N [37]. Micronutrients spray significantly affected BW, BYM, NAE for BYM, and GYM in favor of Zn treatment without response for the rest of the study characteristics. Most of the study parameters have been affected by in- creasing the plant density from 4.76 to 6.66 plant·m–2 except biomass and grain yield per m2 which may indi- cate that a higher plant density might produce more biomass and grain yield per unit area. These results arise that more investigation is required in order to fully un- derstanding the interaction between production factors and optimum plant density for maximizing corn biomass and grain yield under sandy so il conditions. REFERENCES [1] Ayars, J.E., Phene, C.J., Hutmacher, R.B., Davis, K.R., Schoneman, R.A., Vail, S.S. and Mead, R.M. (1999) Subsurface drip irrigation of row crops: A review of 15 years of research at the Water Management Research Laboratory. Agricultural Wa ter Managemen t, 42, 1-27. doi:10.1016/S0378-3774(99)00025-6 [2] Shepherd, M.A. and Bennett, G. (1998) Nutrients leach- ing losses from a sandy soil in lysimeter. Communica- tions in Soil Science and Plant Analysis, 29, 931-946. doi:10.1080/00103629809369997 [3] Haynes, R.J. (1985) Principles of fertilizers use for trickle irrigated crops. Fert Research, 6, 235-255. doi:10.1007/BF01048798 [4] El-Hendawy, S.E., Hokam, E.M. and Schmidhalter, U. (2008) Drip irrigation frequency: The effects and their interaction with nitrogen fertilization on sandy soil water distribution, maize yield and water use efficiency under Egyptian conditions. Journal of Agronomy and Crop Science, 194, 180-192. doi:10.1111/j.1439-037X.2008.00304.x [5] Lamm, F.R., Trooien, T.P., Manges, L., Madani, H. and Sunderman, H.D. (2001) Nitrogen fertilization for sub- surface drip irrigated corn. Transactions of the ASAE, 44, 530-542. [6] Halvorson, A.D. and Reule, C.A. (2006). Irrigated corn and soybean response to nitrogen under no-till northern Colorado. Agronomy Journal, 98, 1367-1374. [7] Asadi, M.E., Clemente, R.S., Gupta, A.D., Loof, R. and Hansen, G.K. (2002) Impacts of fertigation via sprinkler irrigation on nitrate leaching and corn yield in an acid- sulphate soil in Thailand. Agricultural Water Manage- ment, 52, 197-213. [8] Kargbo, C.S. (1985) Effect of plant reproductive stage and rates of foliar fertilizer sprays on corn yield and yield components. Zeitschrift fur Acker und pflanzenbau, 155, 268-273. [9] Abdul-Galil, A.A., Ghanem, S.A., Zeiton O.A. and Moselhy, M.M. (1990) Effect of planting density and foliar N fertilization on yield of maize. Proceedings of the 4th Conference Agron, Cairo, 1, 405-417. [10] Kabata-Pendias, A. and Pendias, H. (1999) Biogeochem- istry of Trace Elements. PWN, Warsaw, Poland, 398. [11] Hefni, E.H.M., El-Hosary, A.A., Salwan, M.I.M. and El-Sabbagh, A. (1993) Effect of soil moisture stress and foliar application of Zn on some maize varieties. Annals of Agricultural Science, Moshtohor, 31, 1811-1822. [12] Badr, S.K.A. (1999) Effect of some preceding winter crops and application time and yield components of yel- low maize in sandy soil. Minufiya Journal Of Agricul- tural Research, 24, 895-909. [13] Bakry, M.A., Soliman, Y.R. and Moussa, S.A. (2009) Importance of micronutrients, organic manure and bio- fertilizer for improving maize yield and its components grown in desert sandy soils. Research Journal of Agri- culture and Biological Sciences, 5, 16-23. [14] Sajedi, N.A., Ardakani, M.R., Naderi, A., Madani, H. and Boojar, M.M.A. (2009) Response of Maize to Nutrients Foliar Application Under Water Deficit Stress Conditions. Research Journal of Agriculture and Biological Sciences, 4, 242-248. doi:10.3844/ajabssp.2009.242.248 [15] El-Bana, A.Y.A. and Gomaa, M.A. (1994) Response of maize to time of nitrogen application and some micro- elements under sandy soil conditions. Zagazig Journal of Agriculture Research, 21, 1029-1040 [16] Schulte, E.E. (2004) Understanding plant nutrients, soil and applied Zn. http://learningstore.uwex.edu/Assets/pdf s/A2528.pdf. [17] Tollenaar, M. and Aguilera, A. (1992) Radiation use effi- ciency of an old and a new maize hybrid. Agronomy Journal, 84, 536-541. [18] Greish, M.H. and Yakout, G.M. (2001) Effect of plant population density and nitrogen fertilization on yield and yield components of some white and yellow maize hy- brids under drip irrigation system in sandy soil. Pro- ceeding of the International Conference on Plant Nutri- tion—Food Security and Sustainability of Agro—Eco- systems, Madrid, 810-811. [19] Al-Kaisi, M.M. and Yin, X. (2003) Effects of nitrogen rate, irrigation rate, and plant population on corn yield and water use efficiency. Agronomy Journal, 95 , 1475- 1482. [20] Porter, P., Hicks, D., Lueschen, W., Ford, J., Warnes, D. and Hoverstad, T. (1997) Corn response to row width and plant population in the northern Corn Belt. Journal of Production Agriculture, 10, 293–300. [21] Soil Survey Staff (1996) Keys to Soil Taxonomy. 7th Edition, USDA Natural Resource Con-servation Service, Washington DC, 644.  A. Attia et al. / Agricultural Sciences 2 (2 011) 94-103 Copyright © 2011 SciRes. http://www.scirp. org/journal/AS/Openly accessible at 103 [22] Ritchie, S.W., Hanway, J.J., Benson, G.O., Herman, J.C. and Lupkes, S.J. (1993) How a corn plant develops. Ext Services Ames, Special report, Iowa State university of Science and Technology Coop, Iowa, 48. [23] Palamiswamy, K.M. and Gomex, K.A. (1974) Length- width method for estimating leaf area of rice. Agronomy Journal, 66, 430-433. [24] Vidovic, J. and Pokorny, V. (1973) The effect of different sowing densities and nutrients levels in LAI, production and distribution of dry matter in maize. Biologia planta, 15, 374-382. [25] Little, R.C., Milliken, G.A., Stroup, W.W. and Wolfinger, R.D. (1996) SAS system for mixed models. SAS Institute, Cary. [26] Subedi, K.D., Ma, B.L. and Smith, D.L. (2006) Response of leafy and non-leafy maize hybrid to population densi- ties and fertilizer nitrogen levels. Crop Science, 46, 1860- 1869. [27] Berzsenyi, Z. (2009) Studies on the effect of N fertiliza- tion on the growth of maize (Zea mays, L.) hybrids I. Dynamic of drymatter accumulation in whole plants and plant organs. Acta Agr onomy Hung, 57, 97-110. [28] Uribe, E., Martens, C. and Brann, D.E. (1988) Response of corn (Zea mays, L.) to manganese application on At- tantic Coast al Plain soils. Plant and Soil, 112, 83-88. doi:10.1007/BF02181756 [29] Yakout, G.M., Greish, G.H. and Atta-All, R.A. (2001) Effect of foliar nutrition with some micronutrients on growth and yield of some white maize cultivars. Egypt Journal of Applied Science, 16, 521-532. [30] Ashok, K. (2008) Productivity, economics and nitrogen use efficiency of specialty corn (Zea mays, L) as influ- enced by planting density and nitrogen fertilization. In- dian Journal of Agronomy, 53, 306-309. [31] Gehl, R.J., Schmidt, J.P., Maddux, L.D. and Gordon, W.B. (2005) Corn yield response to nitrogen rate and timing in sandy irrigated soils. Agronomy Journal, 7, 1230-1238. [32] Potarzycki, J. and Grzebisz, W. (2009) Effect of zinc foliar application on grain yield of maize and its yielding components. Plant and Soil Environment Journal, 55, 519-527. [33] Tarkalson, D.D. and Payero, J.O. (2008) Comparison of nitrogen fertilization methods and rates for subsurface drip irrigated corn in the semi-arid great plains. Soil and Water Division of ASABE, 51, 1633-1643. [34] Shapiro, C.A. and Wortmann, C.S. (2006) Corn response to nitrogen rate, row spacing, and plant density in Eastern Nebraska. Agronomy Journal, 98, 529-535. [35] El-Gizawy, N.K. (2009) Effect of nitrogen rate and plant density on agronomic nitrogen efficiency and maize yields following wheat and faba bean. American Eura- sian Journal of agriculture and Environment Science, 5, 378-386. [36] Osman, A.S., Allam, S.M.M., El-Sherbiny, G.M. and Gebraiel, M.Y. (2001) Influence of nitrogen and micro- nutrient sources on maize plants. Egypt Journal of Ap- plied Science, 16, 150-160. [37] Wang, Y.P., Tan, C.C. and Huang, W.B. (1996) Effect of chemical fertilization on the quality of percolation water. Journal of the Chinese Agricultural Chemical Society, 34, 406-416. |