

Paper Menu >>
Journal Menu >>
 Vol.2, No.2, 61-67 (2011) doi:10.4236/as.2011.2 2010 Copyright © 2011 SciRes. Openly accessible at http://www.scirp.org/journal/AS/ Agricultural Sciences Influence of low light intensity on growth and yield of four soybean cultivars during wet and dry seasons of Northeast Thailand Anan Polthanee*, Khanistha Promsaena, Anucha Laoken Department of Plant Science and Agricultural Resources, Faculty of Agriculture, Khon Kaen University, Khon Kaen, Thailand; *Corresponding Aut hor: [email protected] Received 28 September 2010; revised 23 February 2011; accepted 2 March 2011. ABSTRACT Crop is commonly grown in intercrop combina- tions of which cereal/legumes are the most widespread in tropical countries . The availability of low light intensity due to shading is the critical factor in determining legume yield in intercrop- ping. The experiment searches of better soybean cultivar for intercropping. A field experiment was conducted at the experimental farm of Khon Kaen University in 2005. The objectives of this study were to determine the influence of light regimes (30% of normal light, 50% of normal light and normal light) o n the grow th and yield of four soybean cultivars (early, medium and late matur- ity) under art ificial shadin g at 35 da ys after seed- ing until harvest in the w et and dr y seasons. The results showed that grain yield was significantly (p < 0.05) decreased und er the low light intensit y at 30% of natural light both in wet and dry season. This was mainl y due to lo w light intensit y at 30% of natural light decreasing the number of pods per plant in the dry season. For cultivars, grain yield was significantly difference (p < 0.05) among cultivars both in the wet and dry seasons. The cultivar KKU 74 (medium maturity) gave maximum grain yield both in w et and dr y season under the low light at 30% of natural light. The KKU 74 cultivar is better adapted to shading en- vironment than other cultivars. This was due to the KKU 74 cultivar produced higher chlorophyll b concentration in leaves after the plant experi- enced to shading. This physiological character can be used for soybean breeding program in shading tolerance. Therefore, the cultivar KKU 74 had a higher potential yield advantage in inter- cropping systems in which low light intensity is a major l imi ti ng fa ct or on gra i n y i eld. Keywords: Chlorophyll Concentration; Shading; Soybean 1. INTRODUCTION Intercropping can be used by small farmers primarily to increase the diversity of their products and the stabil- ity of their annual output through effective use of land and other resources [1,2]. Grain yield of soybean decreasing, when inter cropped with maize has been reported [3-5]. The low yield in in- tercropped soybean as compared to monoculture is mainly due to shading resulting in weak plant growth [6-8]. The reduction in light reaching the legume canopy when intercropped with maize was about 30% - 50% of the total incoming radiation and began around 30 - 35 days after maize seeding [9-11]. The grain yield of soybean reduced under the low light because of reduction in dry matter production [12], total pod number per plant [8,12,13] and thousand grains weight [5]. To obtain the maximum yield of the intercrop soybean under low light stress, selection of suitable soybean cultivar plays an important role for intercrop- ping systems. The cultivars may respond to shading stress di- fferently in terms of growth and yield. The objectives of this study were to determine the in- fluence of light regimes (30% of normal light, 50% of normal light and normal light) on the growth and yield of 4 soybean cu ltivars under artificial shading in the wet and dry seasons. 2. MATERIALS AND METHODS 2.1. Establishment and Management The experiments were conducted in a field on well- drained (Oxic Paleustult) sandy loam soil at the experi- mental farm, Faculty of Agriculture, Khon Kaen Univer- sity in the wet season (June-October 2005) and dry sea- son (November 2005-February 2006). The four soybean cultivars (determined by growth habit) were; Nakhon- sawan 1 (NKS 1), Chiangmai 60 (CM 60), Khon Kaen 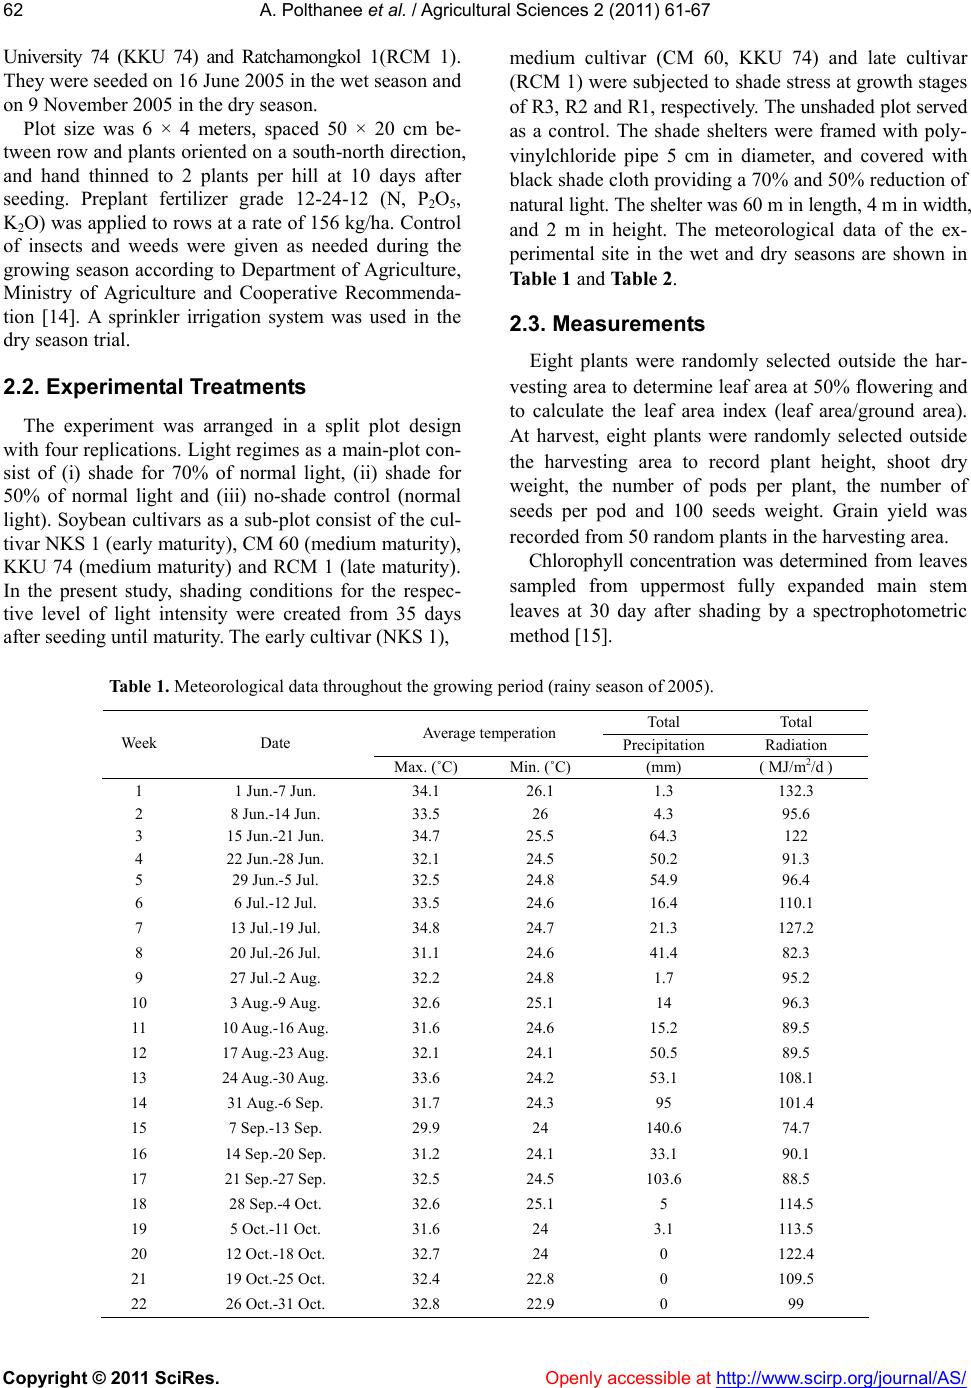 A. Polthanee et al. / Agricultural Sciences 2 (2011) 61-67 Copyright © 2011 SciRes. Openly accessible at http://www.scirp.org/journal/AS/ 62 University 74 (KKU 74) and Ratchamongkol 1(RCM 1). They were seeded on 16 June 2005 in the wet season and on 9 November 2005 in the dry season. Plot size was 6 × 4 meters, spaced 50 × 20 cm be- tween row and plants oriented on a south-north direction, and hand thinned to 2 plants per hill at 10 days after seeding. Preplant fertilizer grade 12-24-12 (N, P2O5, K2O) was applied to rows at a rate of 156 kg/ha. Control of insects and weeds were given as needed during the growing season according to Department of Agriculture, Ministry of Agriculture and Cooperative Recommenda- tion [14]. A sprinkler irrigation system was used in the dry season trial. 2.2. Experimental Treatments The experiment was arranged in a split plot design with four replications. Light regimes as a main-plot con- sist of (i) shade for 70% of normal light, (ii) shade for 50% of normal light and (iii) no-shade control (normal light). Soybean cultivars as a sub -plot consist of the cul- tivar NKS 1 (early maturity), CM 60 (medium maturity), KKU 74 (medium maturity) and RCM 1 (late maturity). In the present study, shading conditions for the respec- tive level of light intensity were created from 35 days after seeding until maturity. The early cultivar (NKS 1), medium cultivar (CM 60, KKU 74) and late cultivar (RCM 1) were subjected to shade stress at growth stages of R3, R2 and R1, respectively. The unshaded plot served as a control. The shade shelters were framed with poly- vinylchloride pipe 5 cm in diameter, and covered with black shade cloth prov iding a 70% and 50% reductio n of natural light. The shelter was 60 m in length, 4 m in width, and 2 m in height. The meteorological data of the ex- perimental site in the wet and dry seasons are shown in Table 1 and Table 2. 2.3. Measurements Eight plants were randomly selected outside the har- vesting area to determine leaf area at 50% flowering and to calculate the leaf area index (leaf area/ground area). At harvest, eight plants were randomly selected outside the harvesting area to record plant height, shoot dry weight, the number of pods per plant, the number of seeds per pod and 100 seeds weight. Grain yield was recorded from 50 random plants in the harvesting area. Chlorophyll concentration was determined from leaves sampled from uppermost fully expanded main stem leaves at 30 day after shading by a spectrophotometric met hod [15]. Table 1. Meteorological data throughout the growing period (rainy season of 2005). Total Total Average temperation Precipitation Radiation Week Date Max. (˚C) Min. (˚C) (mm) ( MJ/m2/d ) 1 1 Jun.-7 Jun. 34.1 26.1 1.3 132.3 2 8 Jun.-14 Jun. 33.5 26 4.3 95.6 3 15 Jun.-21 Jun. 34.7 25.5 64.3 122 4 22 Jun.-28 Jun. 32.1 24.5 50.2 91.3 5 29 Jun.-5 Jul. 32.5 24.8 54.9 96.4 6 6 Jul.-12 Jul. 33.5 24.6 16.4 110.1 7 13 Jul.-19 Jul. 34.8 24.7 21.3 127.2 8 20 Jul.-26 Jul. 31.1 24.6 41.4 82.3 9 27 Jul.-2 Aug. 32.2 24.8 1.7 95.2 10 3 Aug.-9 Aug. 32.6 2 5.1 14 96.3 1 1 10 Aug. -16 Aug. 31.6 2 4.6 15.2 8 9.5 12 1 7 Aug.-2 3 Aug. 32.1 24. 1 50.5 89. 5 13 2 4 Aug.-3 0 Aug. 33.6 24. 2 53.1 1 08.1 14 31 Aug.-6 Sep. 31.7 24.3 95 101.4 15 7 Sep.-13 Sep. 29.9 24 140.6 74.7 16 14 Sep.-20 Sep. 31.2 24.1 33.1 90.1 17 21 Sep.-27 Sep. 32.5 24.5 103.6 88.5 18 28 Sep.-4 Oct. 32.6 25.1 5 114.5 19 5 Oct.-11 Oct. 31.6 24 3.1 113.5 20 12 Oct.-18 Oct. 32.7 24 0 122.4 21 19 Oct.-25 Oct. 32.4 22.8 0 109.5 22 26 Oct.-31 Oct. 32.8 22.9 0 99 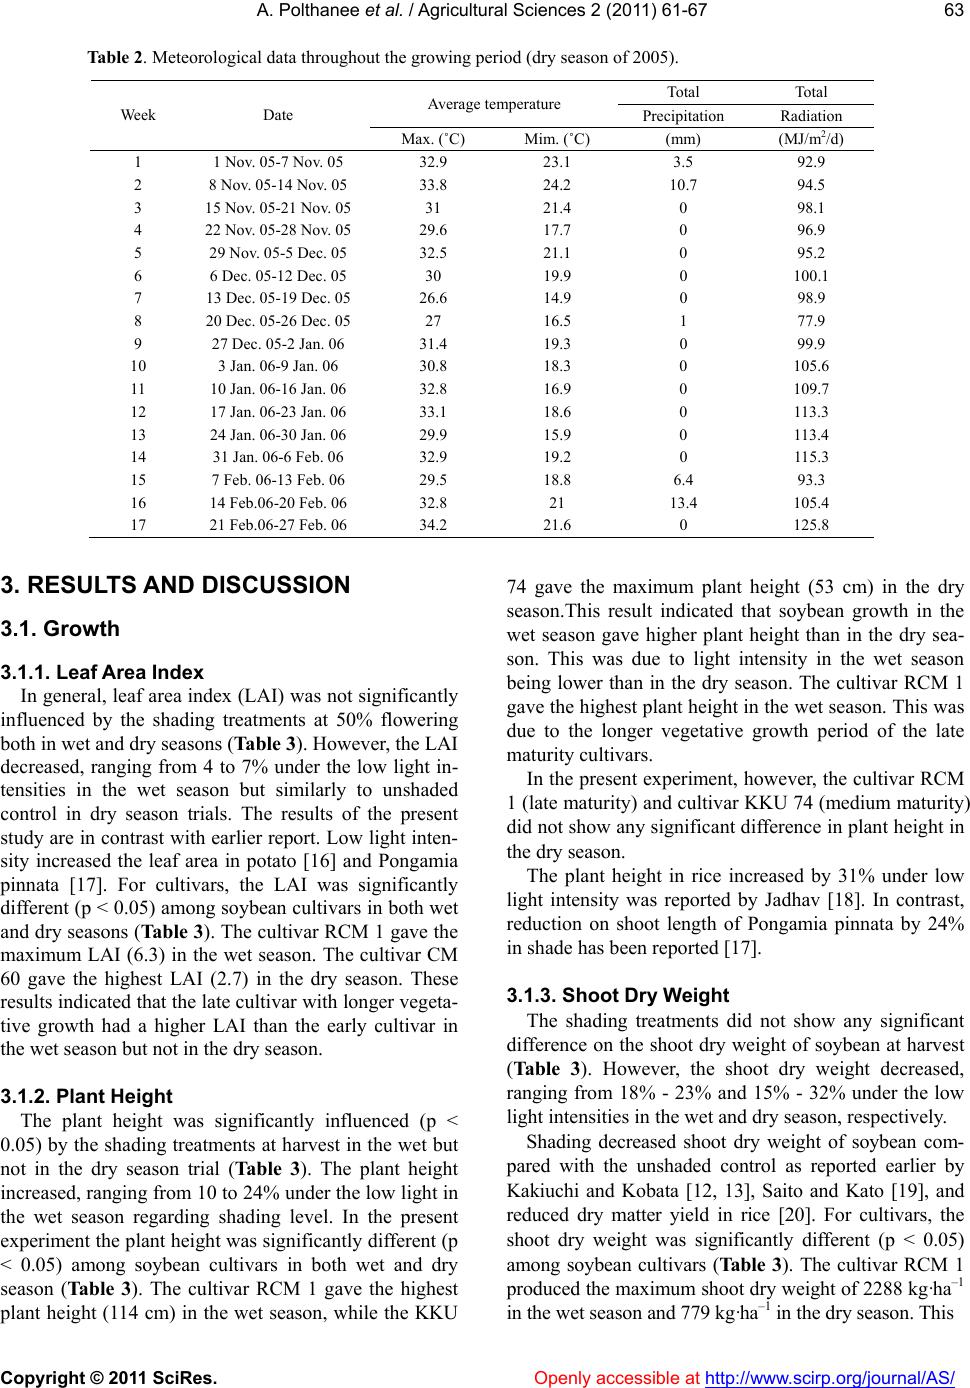 A. Polthanee et al. / Agricultural Sciences 2 (2011) 61-67 Copyright © 2011 SciRes. Openly accessible at http://www.scirp. org/journal/AS/ 63 Table 2. Meteorological data throughout the growing period (dry season of 2005). Total Total Average temperature Precipitation Radiation Week Date Max. (˚C) Mim. (˚C) (mm) (MJ/m2/d) 1 1 Nov. 05-7 Nov. 05 32.9 23.1 3.5 92.9 2 8 Nov. 05-14 Nov. 05 33.8 24.2 10.7 94.5 3 15 Nov. 05-21 Nov. 05 31 21.4 0 98.1 4 22 Nov. 05-28 Nov. 05 29.6 17.7 0 96.9 5 29 Nov. 05-5 Dec. 05 32.5 21.1 0 95.2 6 6 Dec. 05-12 Dec. 05 30 19.9 0 100.1 7 13 Dec. 05-19 Dec. 05 26.6 14.9 0 98.9 8 20 Dec. 05-26 Dec. 05 27 16.5 1 77.9 9 27 Dec. 05-2 Jan. 06 31.4 19.3 0 99.9 10 3 Jan. 06-9 Jan. 06 30.8 18.3 0 105.6 11 10 Jan. 06-16 Jan. 06 32.8 16.9 0 109.7 12 17 Jan. 06-23 Jan. 06 33.1 18.6 0 113.3 13 24 Jan. 06-30 Jan. 06 29.9 15.9 0 113.4 14 31 Jan. 06-6 Feb. 06 32.9 19.2 0 115.3 15 7 Feb. 06-13 Feb. 06 29.5 18.8 6.4 93.3 16 14 Feb.06-20 Feb. 06 32.8 21 13.4 105.4 17 21 Feb.06-27 Feb. 06 34.2 21.6 0 125.8 3. RESULTS AND DIS CUS SION 3.1. Growth 3.1.1. Leaf Area Index In general, leaf area index (LAI) was not significantly influenced by the shading treatments at 50% flowering both in wet and dry seasons (Table 3). However, the LAI decreased, ranging from 4 to 7% under the low light in- tensities in the wet season but similarly to unshaded control in dry season trials. The results of the present study are in contrast with earlier report. Low lig ht inten- sity increased the leaf area in potato [16] and Pongamia pinnata [17]. For cultivars, the LAI was significantly different (p < 0.05) among soybean cultivars in both wet and dry seasons ( Table 3). The cultivar RCM 1 gave the maximum LAI (6.3) in the wet season. The cultivar CM 60 gave the highest LAI (2.7) in the dry season. These results indicated that the late cultivar with longer vegeta- tive growth had a higher LAI than the early cultivar in the wet season but not in the dry season. 3.1.2. Plant Height The plant height was significantly influenced (p < 0.05) by the shading treatments at harvest in the wet but not in the dry season trial (Table 3). The plant height increased, ranging from 10 to 24% under the low light in the wet season regarding shading level. In the present experiment the plant height was significan tly different (p < 0.05) among soybean cultivars in both wet and dry season (Ta b l e 3 ). The cultivar RCM 1 gave the highest plant height (114 cm) in the wet season, while the KKU 74 gave the maximum plant height (53 cm) in the dry season.This result indicated that soybean growth in the wet season gave higher plant height than in the dry sea- son. This was due to light intensity in the wet season being lower than in the dry season. The cultivar RCM 1 gave the highest plant height in the wet season. This was due to the longer vegetative growth period of the late maturity cultivars. In the present experiment, however, the cultivar RCM 1 (late maturity) and cultivar KKU 74 (medium maturity) did not show any significant difference in plant height in the dry season. The plant height in rice increased by 31% under low light intensity was reported by Jadhav [18]. In contrast, reduction on shoot length of Pongamia pinnata by 24% in shade has been reported [17]. 3.1.3. Shoot Dry W eight The shading treatments did not show any significant difference on the shoot dry weight of soybean at harvest (Table 3). However, the shoot dry weight decreased, ranging from 18% - 23% and 15% - 32% under the low light intensities in the wet and dry season, respectiv ely. Shading decreased shoot dry weight of soybean com- pared with the unshaded control as reported earlier by Kakiuchi and Kobata [12, 13], Saito and Kato [19], and reduced dry matter yield in rice [20]. For cultivars, the shoot dry weight was significantly different (p < 0.05) among soybean cultivars (Ta ble 3). The cultivar RCM 1 produced the maximum shoot dry weight of 2288 kg·ha–1 in the wet season and 77 9 kg·ha–1 in the dry season. This 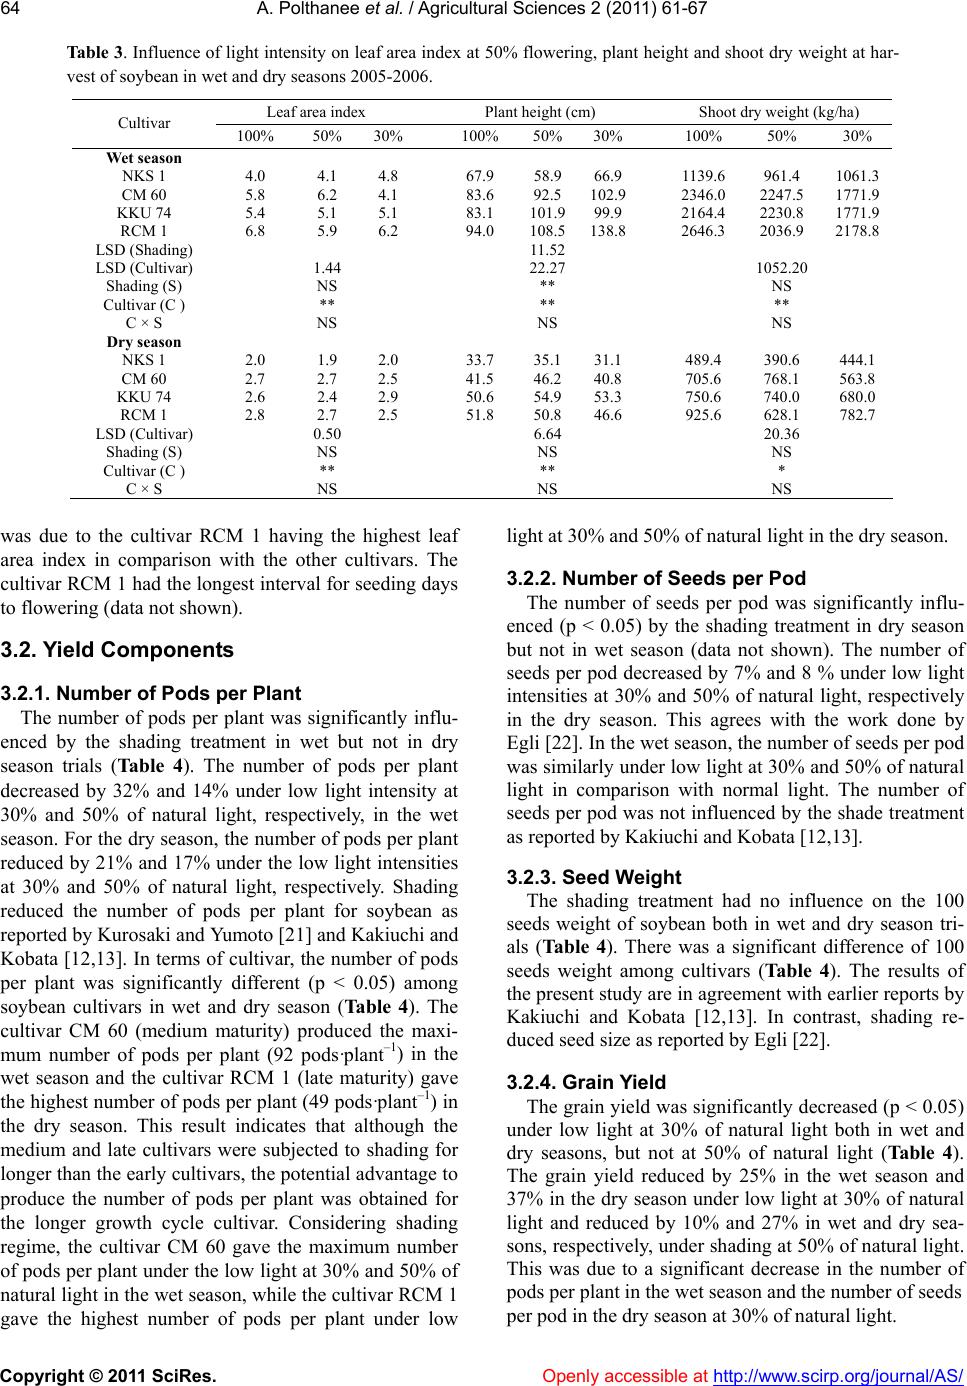 A. Polthanee et al. / Agricultural Sciences 2 (2011) 61-67 Copyright © 2011 SciRes. Openly accessible at http://www.scirp.org/journal/AS/ 64 Table 3. Influence of light intensity on leaf area index at 50% flowering, plant height and shoot dry weight at har- vest of soybean in wet and dry seasons 2005-2006. Leaf area index Plant height (cm) Shoot dry weight (kg/ha) Cultivar 100% 50% 30%100% 50%30% 100% 50% 30% Wet season NKS 1 4.0 4.1 4.8 67.9 58.966.9 1139.6 961.4 1061.3 CM 60 5.8 6.2 4.1 83.6 92.5102.92346.0 2247.5 1771.9 KKU 74 5.4 5.1 5.1 83.1 101.999.9 2164.4 2230.8 1771.9 RCM 1 6.8 5.9 6.2 94.0 108.5138.82646.3 2036.9 2178.8 LSD (Shading) 11.52 LSD (Cultivar) 1.44 22.27 1052.20 Shading (S) NS ** NS Cultivar (C ) ** ** ** C × S NS NS NS Dry season NKS 1 2.0 1.9 2.0 33.7 35.131.1 489.4 390.6 444.1 CM 60 2.7 2.7 2.5 41.5 46.240.8 705.6 768.1 563.8 KKU 74 2.6 2.4 2.9 50.6 54.953.3 750.6 740.0 680.0 RCM 1 2.8 2.7 2.5 51.8 50.846.6 925.6 628.1 782.7 LSD (Cultivar) 0.50 6.64 20.36 Shading (S) NS NS NS Cultivar (C ) ** ** * C × S NS NS NS was due to the cultivar RCM 1 having the highest leaf area index in comparison with the other cultivars. The cultivar RCM 1 had the longest interval for seeding days to flowering (data not shown). 3.2. Yield Components 3.2.1. Number of Pods per Plant The number of pods per plant was significantly influ- enced by the shading treatment in wet but not in dry season trials (Table 4). The number of pods per plant decreased by 32% and 14% under low light intensity at 30% and 50% of natural light, respectively, in the wet season. For the dry season , the number of pods per plant reduced by 21% and 17% under the low light intensities at 30% and 50% of natural light, respectively. Shading reduced the number of pods per plant for soybean as reported by Kurosaki and Yumoto [21] and Kakiuchi and Kobata [12,13]. In terms of cultivar, the number of pods per plant was significantly different (p < 0.05) among soybean cultivars in wet and dry season (Ta b l e 4 ). The cultivar CM 60 (medium maturity) produced the maxi- mum number of pods per plant (92 pods·plant–1) in the wet season and the cultivar RCM 1 (late maturity) gave the highest number of pods per plant (49 pods·plant–1) in the dry season. This result indicates that although the medium and late cultivars were subjected to shading for longer than the early cultiv ars, the potential adv antage to produce the number of pods per plant was obtained for the longer growth cycle cultivar. Considering shading regime, the cultivar CM 60 gave the maximum number of pods per plant under the low light at 30% and 50% of natural light in the wet season, while the cultiv ar RCM 1 gave the highest number of pods per plant under low light at 30% and 50% of natural light in the dry season. 3.2.2. Number of Seeds per Pod The number of seeds per pod was significantly influ- enced (p < 0.05) by the shading treatment in dry season but not in wet season (data not shown). The number of seeds per pod decreased by 7% and 8 % under low light intensities at 30% and 50% of natural light, respectively in the dry season. This agrees with the work done by Egli [22]. In the wet season, the number of seed s per pod was similarly under low light at 30 % and 50% of natural light in comparison with normal light. The number of seeds per pod w as not influenced by the shade treatment as reported by Kakiuchi and Kobata [12,13]. 3.2.3. Seed Weight The shading treatment had no influence on the 100 seeds weight of soybean both in wet and dry season tri- als (Ta b l e 4 ). There was a significant difference of 100 seeds weight among cultivars (Table 4 ). The results of the present study are in agreement with earlier reports by Kakiuchi and Kobata [12,13]. In contrast, shading re- duced seed size as reported by Egli [22]. 3.2.4. Grain Yield The grain yield was significantly decreased (p < 0.05) under low light at 30% of natural light both in wet and dry seasons, but not at 50% of natural light (Table 4). The grain yield reduced by 25% in the wet season and 37% in the dry season under low light at 30% of natural light and reduced by 10% and 27% in wet and dry sea- sons, respectively, under shading at 50% of natural light. This was due to a significant decrease in the number of pods per plant i n the wet seas on and t he nu mber of seeds per pod in the dry season at 30% of natural light. 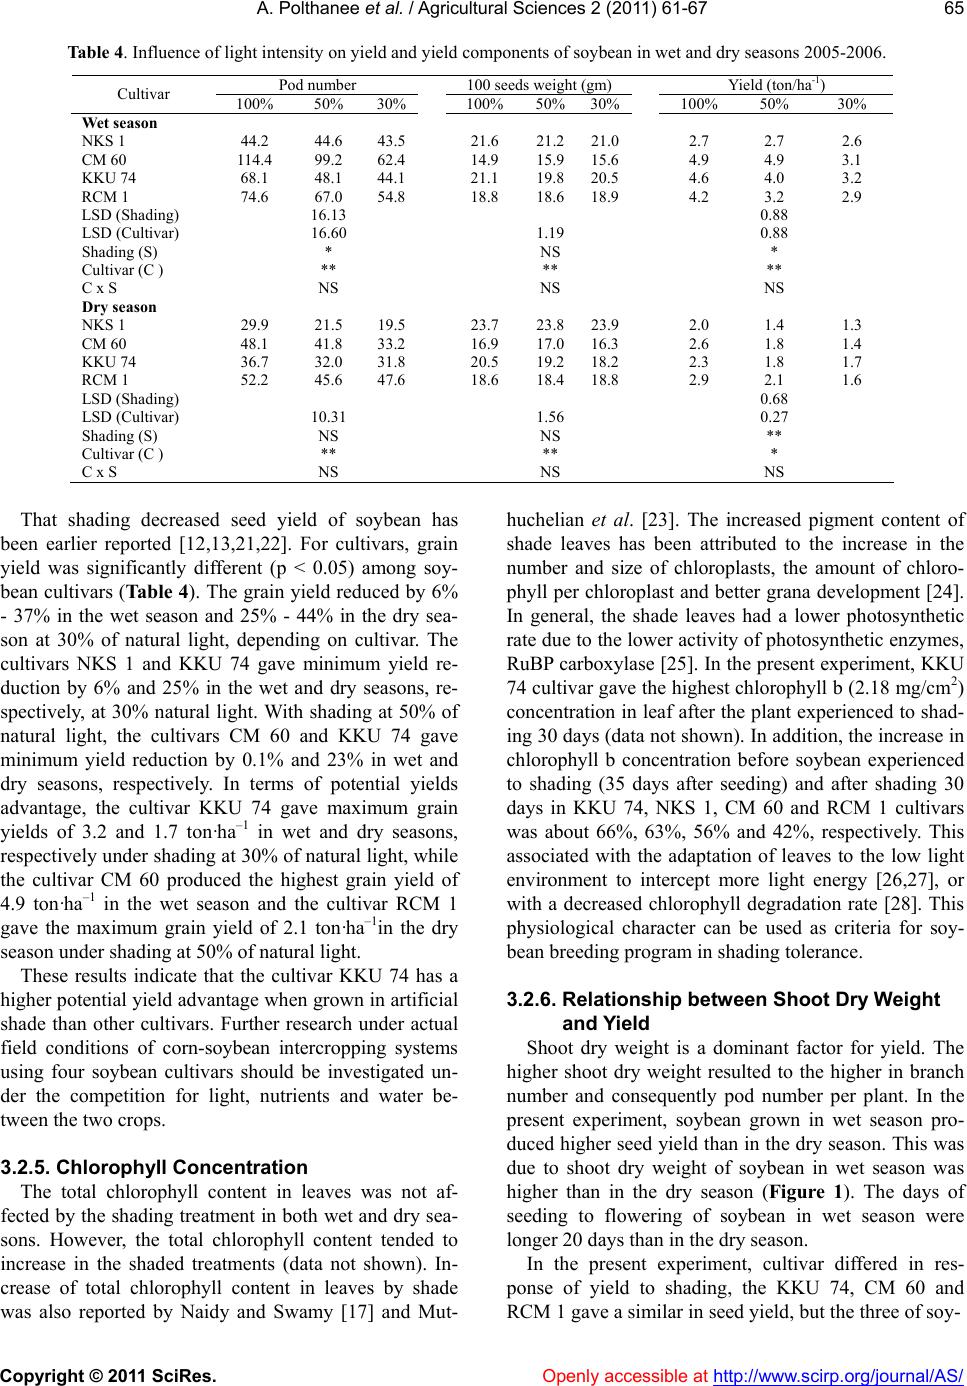 A. Polthanee et al. / Agricultural Sciences 2 (2011) 61-67 Copyright © 2011 SciRes. Openly accessible at http://www.scirp.org/journal/AS/ 65 Table 4. Influence of light intensity on yield and yield components of soybean in wet and dry seasons 2005-2006. Pod number 100 seeds weight (gm) Yield (ton/ha-1) Cultivar 100% 50% 30%100% 50%30%100% 50% 30% Wet season NKS 1 44.2 44.6 43.521.6 21.221.02.7 2.7 2.6 CM 60 114.4 99.2 62.414.9 15.915.64.9 4.9 3.1 KKU 74 68.1 48.1 44.121.1 19.820.54.6 4.0 3.2 RCM 1 74.6 67.0 54.818.8 18.618.94.2 3.2 2.9 LSD (Shading) 16.13 0.88 LSD (Cultivar) 16.60 1.19 0.88 Shading (S) * NS * Cultivar (C ) ** ** ** C x S NS NS NS Dry season NKS 1 29.9 21.5 19.523.7 23.823.92.0 1.4 1.3 CM 60 48.1 41.8 33.216.9 17.016.32.6 1.8 1.4 KKU 74 36.7 32.0 31.820.5 19.218.22.3 1.8 1.7 RCM 1 52.2 45.6 47.618.6 18.418.82.9 2.1 1.6 LSD (Shading) 0.68 LSD (Cultivar) 10.31 1.56 0.27 Shading (S) NS NS ** Cultivar (C ) ** ** * C x S NS NS NS That shading decreased seed yield of soybean has been earlier reported [12,13,21,22]. For cultivars, grain yield was significantly different (p < 0.05) among soy- bean cultivars (Table 4). The grain yield reduced by 6% - 37% in the wet season and 25% - 44% in the dry sea- son at 30% of natural light, depending on cultivar. The cultivars NKS 1 and KKU 74 gave minimum yield re- duction by 6% and 25% in the wet and dry seasons, re- spectively, at 30% natural light. With shading at 50% of natural light, the cultivars CM 60 and KKU 74 gave minimum yield reduction by 0.1% and 23% in wet and dry seasons, respectively. In terms of potential yields advantage, the cultivar KKU 74 gave maximum grain yields of 3.2 and 1.7 ton·ha–1 in wet and dry seasons, respectively under shading at 30% of natural light, while the cultivar CM 60 produced the highest grain yield of 4.9 ton·ha–1 in the wet season and the cultivar RCM 1 gave the maximum grain yield of 2.1 ton·ha–1in the dry season under shading at 50% of natural light. These results indicate that the cultivar KKU 74 has a higher potential yield advantage when grown in artificial shade than other cultivars. Further research under actual field conditions of corn-soybean intercropping systems using four soybean cultivars should be investigated un- der the competition for light, nutrients and water be- tween the two crops. 3.2.5. Chlorophyll Concentration The total chlorophyll content in leaves was not af- fected by the shading treatment in both wet and dry sea- sons. However, the total chlorophyll content tended to increase in the shaded treatments (data not shown). In- crease of total chlorophyll content in leaves by shade was also reported by Naidy and Swamy [17] and Mut- huchelian et al. [23]. The increased pigment content of shade leaves has been attributed to the increase in the number and size of chloroplasts, the amount of chloro- phyll per chloroplast and better grana development [24]. In general, the shade leaves had a lower photosynthetic rate due to the lower activity of photosynthetic enzy mes, RuBP carbox ylase [25]. In the present exper iment, KKU 74 cultivar gave the high est chlorophyll b (2.18 mg/c m2) concentration in leaf after the p lant experienced to shad- ing 30 days (data not shown). In additio n, the increase in chlorophyll b concentration before soybean experienced to shading (35 days after seeding) and after shading 30 days in KKU 74, NKS 1, CM 60 and RCM 1 cultivars was about 66%, 63%, 56% and 42%, respectively. This associated with the adaptation of leaves to the low light environment to intercept more light energy [26,27], or with a decreased chlorophyll degradation rate [28]. This physiological character can be used as criteria for soy- bean breeding program in shading tolerance. 3.2.6. Relationship between Shoot Dry Weight and Y ield Shoot dry weight is a dominant factor for yield. The higher shoot dry weight resulted to the higher in branch number and consequently pod number per plant. In the present experiment, soybean grown in wet season pro- duced higher seed yield than in the dry season. This was due to shoot dry weight of soybean in wet season was higher than in the dry season (Figure 1). The days of seeding to flowering of soybean in wet season were longer 20 days than in the dry season. In the present experiment, cultivar differed in res- ponse of yield to shading, the KKU 74, CM 60 and RCM 1 gave a similar in seed yield, but the three of so y- 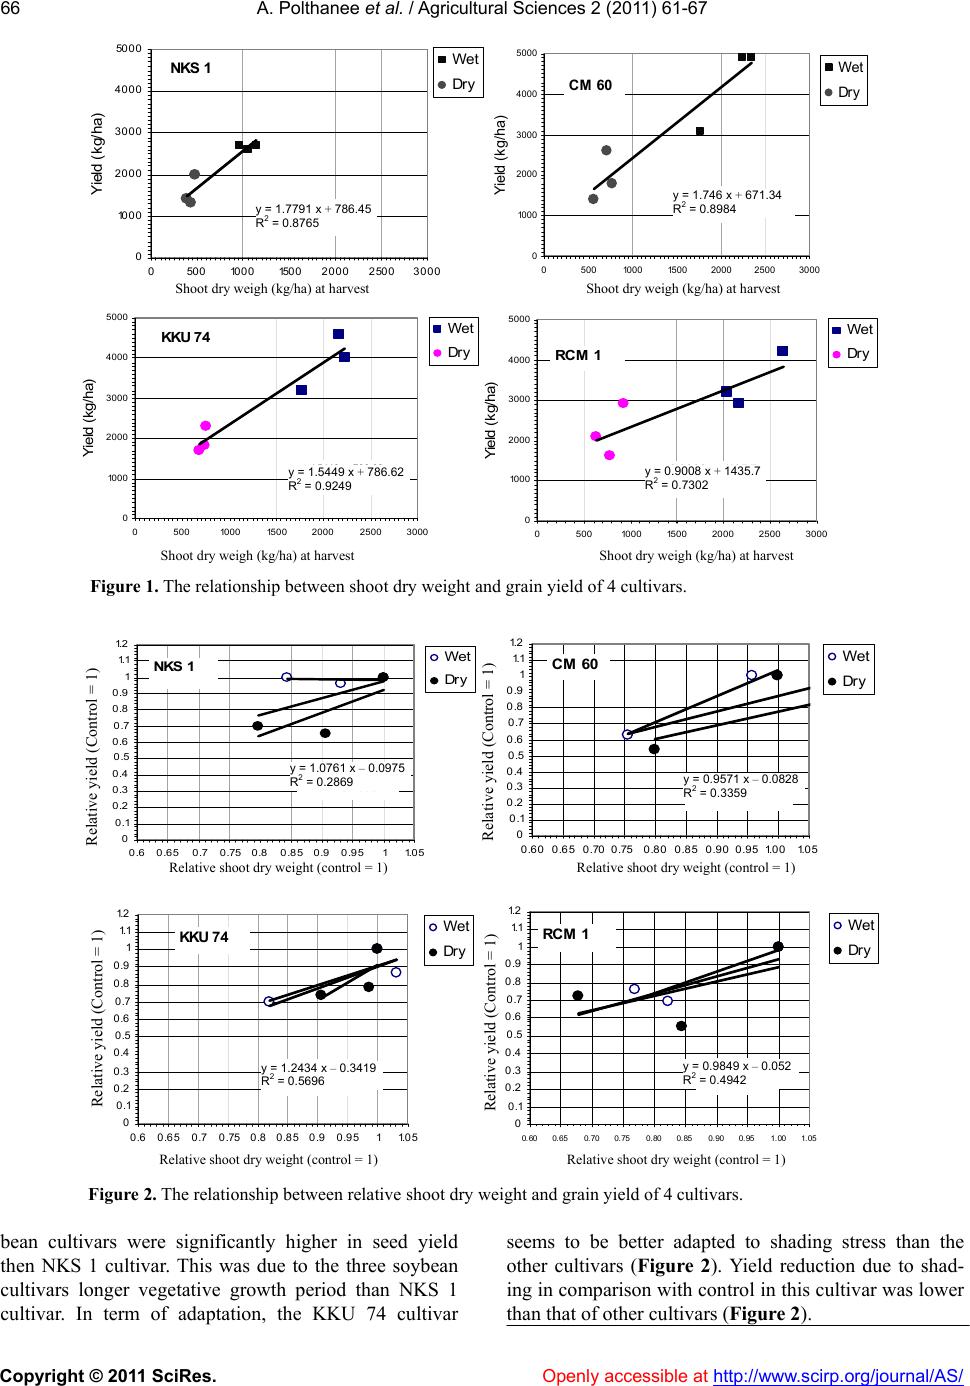 A. Polthanee et al. / Agricultural Sciences 2 (2011) 61-67 Copyright © 2011 SciRes. Openly accessible at http://www.scirp.org/journal/AS/ 66 y = 1.7791x + 786.45 2 = 0.8765 0 1000 2000 3000 4000 5000 050010001500 2000 25003000 Yield (kg/ha) R Wet Dry NKS 1 y4 = 1 .746x + 671 .3 2 = 0.8984 0 1000 2000 3000 4000 5000 050010001500 20002500 3000 Yield (kg/ha) R Wet Dry CM 60 Shoot dry weigh (kg/ha) at harvest Shoot dry weigh (kg/ha) at harvest y = 1 .5449x + 786.62 R 2 = 0.9249 0 1000 2000 3000 4000 5000 050010001500 20002500 3000 Yiel d (kg/ha) Wet Dry KKU 74 y = 0. 9008x + 1435.7 R 2 = 0. 7302 0 1000 2000 3000 4000 5000 05001000 1500 2000 2500 3000 Yield (kg/ha) Wet Dry RCM 1 Shoot dry weigh (kg/ha) at harvest Shoot dry weigh (kg/ha) at harvest Figure 1. The relationship between shoot dry weight and grain yield of 4 cultivars. y = 1.0761x - 0. 0975 R 2 = 0.2869 0 0.1 0.2 0.3 0.4 0.5 0.6 0.7 0.8 0.9 1 1.1 1.2 0.60.650.70.750.80.85 0.90.9511.05 Relative yield (Control=1) Wet Dry NKS 1 y = 0.9571x - 0.0828 R2 = 0 .3359 0 0.1 0.2 0.3 0.4 0.5 0.6 0.7 0.8 0.9 1 1.1 1.2 0.600.650.70 0.750.800.850.90 0.95 1.001.05 Relative yield (Control= 1) Wet Dry CM 60 Relative shoot dry weight (control = 1) Relative shoot dry weight (control = 1) y = 1. 2 434x - 0.3419 R 2 = 0.5696 0 0.1 0.2 0.3 0.4 0.5 0.6 0.7 0.8 0.9 1 1.1 1.2 0.6 0.65 0.7 0.750.80.850.9 0.9511.05 Relative yield (Control= 1) Wet Dry KKU 74 y = 0.9849x - 0.052 R 2 = 0.4942 0 0.1 0.2 0.3 0.4 0.5 0.6 0.7 0.8 0.9 1 1.1 1.2 0.600.65 0.700.75 0.800.85 0.900.95 1.001.05 Relative yiel d (Control=1) Wet Dry RCM 1 Relative shoot dry weight (control = 1) Relative shoot dry weight (control = 1) Figure 2. The relationship between relative shoot dry weight and grain yield of 4 cultivars. bean cultivars were significantly higher in seed yield then NKS 1 cultivar. This was due to the three soybean cultivars longer vegetative growth period than NKS 1 cultivar. In term of adaptation, the KKU 74 cultivar seems to be better adapted to shading stress than the other cultivars (Figure 2). Yield reduction due to shad- ing in comparison with control in this cu ltivar was lower an that of other cultivars (Figure 2). th y = 1.2434 x – 0.3419 R2 = 0.5696 y = 0.9849 x – 0.052 R2 = 0.4942 y = 1.7791 x + 786.45 R2 = 0.8765 y = 1.746 x 71.34 + 6 84 R2 = 0.89 y =6.62 1.5449 x R2 = 0.9249 + 78y =7 0.9008 x + 1435. .7302 R2 = 0 y = 1.0761 x – 0.0975 R2 = 0.2869 y28 = 0.9571 x – 0.08 R2 = 0.3359 Relative yield (Control = 1) Relative yield (Control = 1) Relative yield (Control = 1) Relative yield (Control = 1) 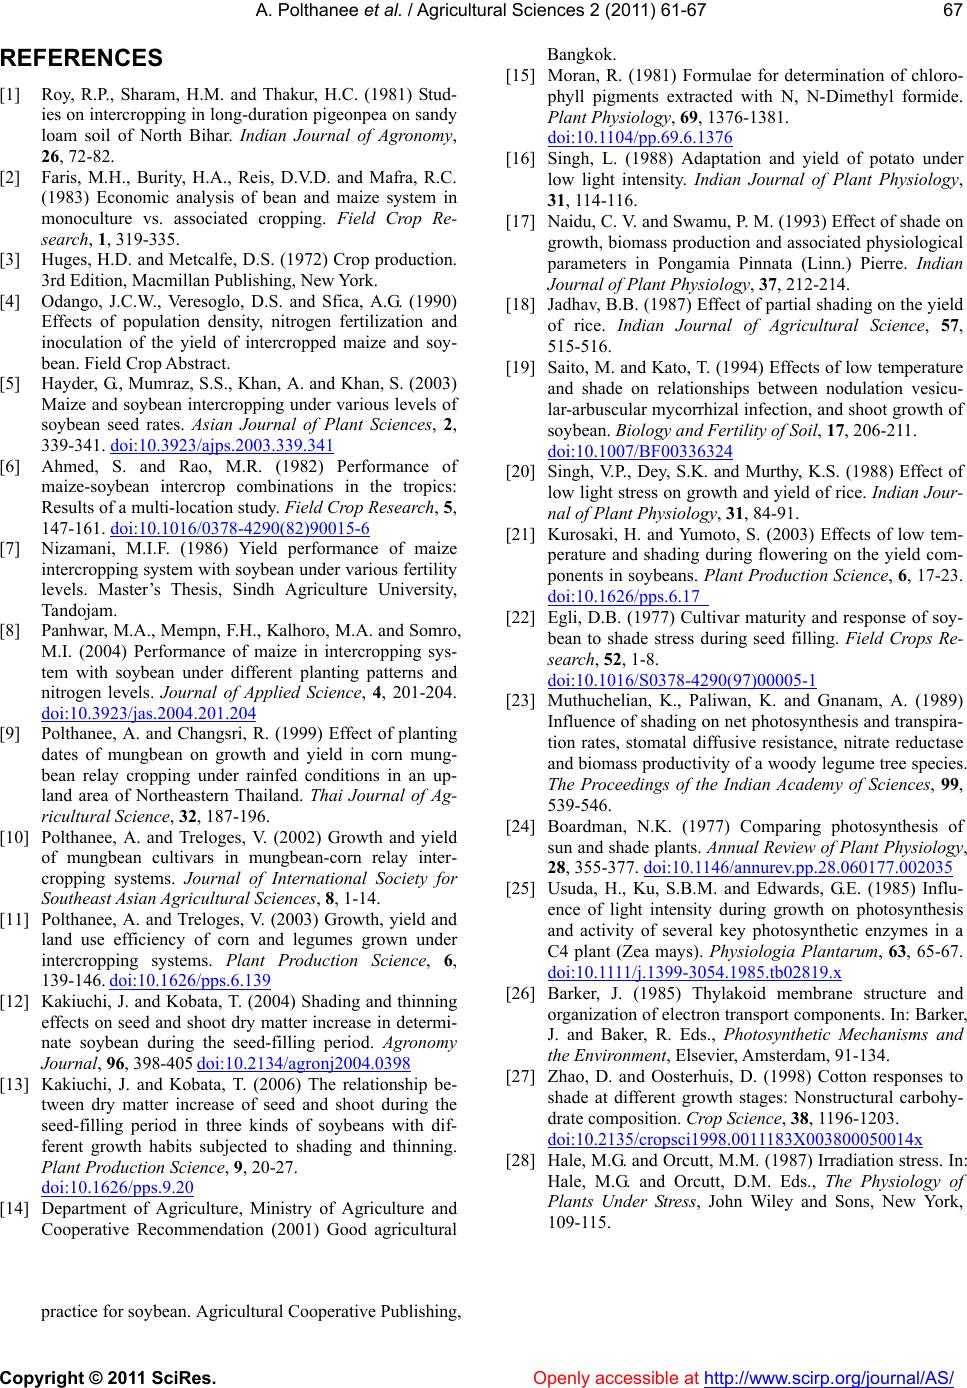 A. Polthanee et al. / Agricultural Sciences 2 (2011) 61-67 Copyright © 2011 SciRes. Openly accessible at http://www.scirp. org/journal/AS/ 67 REFERENCES [1] Roy, R.P., Sharam, H.M. and Thakur, H.C. (1981) Stud- ies on intercropping in long-duration pigeonpea on sandy loam soil of North Bihar. Indian Journal of Agronomy, 26, 72-82. [2] Faris, M.H., Burity, H.A., Reis, D.V.D. and Mafra, R.C. (1983) Economic analysis of bean and maize system in monoculture vs. associated cropping. Field Crop Re- search, 1, 319-335. [3] Huges, H.D. and Metcalfe, D.S. (1972) Crop production. 3rd Edition, Macmillan Publishing, New York. [4] Odango, J.C.W., Veresoglo, D.S. and Sfica, A.G. (1990) Effects of population density, nitrogen fertilization and inoculation of the yield of intercropped maize and soy- bean. Field Crop Abstract. [5] Hayder, G., Mumraz, S.S., Khan, A. and Khan, S. (2003) Maize and soybean intercropping under various levels of soybean seed rates. Asian Journal of Plant Sciences, 2, 339-341. doi:10.3923/ajps.2003.339.341 [6] Ahmed, S. and Rao, M.R. (1982) Performance of maize-soybean intercrop combinations in the tropics: Results of a multi-location study. Field Crop Research, 5, 147-161. doi:10.1016/0378-4290(82)90015-6 [7] Nizamani, M.I.F. (1986) Yield performance of maize intercropping system with soybean under various fertility levels. Master’s Thesis, Sindh Agriculture University, Tandojam. [8] Panhwar, M.A., Mempn, F.H., Kalhoro, M.A. and Somro, M.I. (2004) Performance of maize in intercropping sys- tem with soybean under different planting patterns and nitrogen levels. Journal of Applied Science, 4, 201-204. doi:10.3923/jas.2004.201.204 [9] Polthanee, A. and Changsri, R. (1999) Effect of planting dates of mungbean on growth and yield in corn mung- bean relay cropping under rainfed conditions in an up- land area of Northeastern Thailand. Thai Journal of Ag- ricultural Scienc e, 32, 187-196. [10] Polthanee, A. and Treloges, V. (2002) Growth and yield of mungbean cultivars in mungbean-corn relay inter- cropping systems. Journal of International Society for Southeast Asian Agricu ltural Sciences, 8, 1-14. [11] Polthanee, A. and Treloges, V. (2003) Growth, yield and land use efficiency of corn and legumes grown under intercropping systems. Plant Production Science, 6, 139-146. doi:10.1626/pps.6.139 [12] Kakiuchi, J. and Kobata, T. (2004) Shading and thinning effects on seed and shoot dry matter increase in determi- nate soybean during the seed-filling period. Agronomy Journal, 96, 398-405 doi:10.2134/agronj2004.0398 [13] Kakiuchi, J. and Kobata, T. (2006) The relationship be- tween dry matter increase of seed and shoot during the seed-filling period in three kinds of soybeans with dif- ferent growth habits subjected to shading and thinning. Plant Production Science, 9, 20-27. doi:10.1626/pps.9.20 [14] Department of Agriculture, Ministry of Agriculture and Cooperative Recommendation (2001) Good agricultural practice for soybean. Agricultural Cooperative Publishing, Bangkok. [15] Moran, R. (1981) Formulae for determination of chloro- phyll pigments extracted with N, N-Dimethyl formide. Plant Physiology, 69, 1376-1381. doi:10.1104/pp.69.6.1376 [16] Singh, L. (1988) Adaptation and yield of potato under low light intensity. Indian Journal of Plant Physiology, 31, 114-116. [17] Naidu, C. V. and Swamu, P. M. (1993) Effect of shade on growth, biomass production and associated physiological parameters in Pongamia Pinnata (Linn.) Pierre. Indian Journal of Plant Physiology, 37, 212-214. [18] Jadhav, B.B. (1987) Effect of partial shading on the yield of rice. Indian Journal of Agricultural Science, 57, 515-516. [19] Saito, M. and Kato, T. (1994) Effects of low temperature and shade on relationships between nodulation vesicu- lar-arbuscular mycorrhizal infection, and shoot growth of soybean. Biology and Fertility of Soil, 17, 206-211. doi:10.1007/BF00336324 [20] Singh, V.P., Dey, S.K. and Murthy, K.S. (1988) Effect of low light stress on growth and yield of rice. Indian Jour- nal of Plant Physiology, 31, 84-91. [21] Kurosaki, H. and Yumoto, S. (2003) Effects of low tem- perature and shading during flowering on the yield com- ponents in soybeans. Plant Production Science, 6, 17-23. doi:10.1626/pps.6.17 [22] Egli, D.B. (1977) Cultivar maturity and response of soy- bean to shade stress during seed filling. Field Crops Re- search, 52, 1-8. doi:10.1016/S0378-4290(97)00005-1 [23] Muthuchelian, K., Paliwan, K. and Gnanam, A. (1989) Influence of shading on net photosy nthesis and transpira- tion rates, stomatal diffusive resistance, nitrate reductase and biomass productivity of a woody legume tree species. The Proceedings of the Indian Academy of Sciences, 99, 539-546. [24] Boardman, N.K. (1977) Comparing photosynthesis of sun and shade plants. Annual Review of Plant Physiology, 28, 355-377. doi:10.1146/annurev.pp.28.060177.002035 [25] Usuda, H., Ku, S.B.M. and Edwards, G.E. (1985) Influ- ence of light intensity during growth on photosynthesis and activity of several key photosynthetic enzymes in a C4 plant (Zea mays). Physiologia Plantarum, 63, 65-67. doi:10.1111/j.1399-3054.1985.tb02819.x [26] Barker, J. (1985) Thylakoid membrane structure and organization of electron transport components. In: Barker, J. and Baker, R. Eds., Photosynthetic Mechanisms and the Environment, Elsevier, Amsterdam, 91-134. [27] Zhao, D. and Oosterhuis, D. (1998) Cotton responses to shade at different growth stages: Nonstructural carbohy- drate composition. Crop Science, 38, 1196-1203. doi:10.2135/cropsci1998.0011183X003800050014x [28] Hale, M.G. and Orcutt, M.M. (1987) Irradiation stress. In: Hale, M.G. and Orcutt, D.M. Eds., The Physiology of Plants Under Stress, John Wiley and Sons, New York, 109-115. |