

Paper Menu >>
Journal Menu >>
 Vol.3, No.5, 292-299 (2011) doi:10.4236/health.2011.35051 C opyright © 2011 SciRes. Openly accessible at http://www.scirp.org/journal/HEALTH/ Health Exploring the useful exposure range limits of three intraoral image receptors for various tube potential, tube current and exposure time settings Elli Katsoni1*, Ioannis A. Tsalafoutas2, Panagiotis Gritzalis3, Evripides Stefanou3, Evangelos Georgiou1, Emmanouel Yakoumakis1 1Department of Medical Physics, Medical School, University of Athens, Athens, Greece; *Corresponding Author: [email protected] 2Medical Physics Department, Agios Savvas Hospital, Athens, Greece; 3Department of Oral Diagnosis and Radiology, Dental School, University of Athens, Athens, Greece. Received 28 February 2011; revised 20 April 2011; accepted 4 May 2011. ABSTRACT Objectives: To determine the useful exposure range limit s of three intraoral image r eceptors of different technology when exposed to different X-ray beam spectra, dose and dose rate levels. Study Design: A dental X-r ay unit offering a wide range of tube potential, tube current and expo- sure time settings was used to expose a dental quality control phantom. The receptors that were used to capture the radiogr aphic im ages of the phantom were: the Kodak Insight, the Koda k RVG-6000 and the Duerr Vistascan system. The images that were produced over a wide range of exposure factor settings were evaluated in terms of dia gnostic qual ity by three e xperienc ed radiologists. Results: The number of images with acceptable diagnostic quality was in total 1257; 310 with Insight, 331 with RVG 6000 and 616 with Vistascan. At 60 kV, diagnosable im- ages were produced with doses ranging from 0.44 - 1.56 mGy for the Insight film 0.44 - 2.82 mGy for the RVG 6000 and 0.22 - 4.93 mGy for the Vistascan system. At 70 kV, the respective ranges were 0.39 - 1.28 mGy for the Insight film 0.31 - 2.55 mGy for the RVG6000 and 0.30 - 3.46 mGy for the Vistascan system. Conclusions: The Vistascan exhibited the widest useful ex- posure rang e an d r equ ir ed th e l eas t ex pos ur e to produce a diagnosable image at almost all tube potential settings. The RVG 6000 exhibited a slightly wider useful exposure range than the Insight film, with almost the same dose re- quirements especially in higher Kv settings. Keywords: Radiography, Dental, Digital; Dosage 1. INTRODUCTION According to the UNSCEAR 2000 Report, dental in- traoral radiography is among the most frequently per- formed radiological procedures [1]. Although the patient exposure associated with dental radiography is relatively low, intraoral radiography should be optimised in order to keep the radiation risk “as low as reasonably achiev- able”, something that is widely known as the ALARA principle [2]. Over the past 20 years both the X-ray units and the X-ray receptors used in dental radiology have been evolved. Modern dental X-ray units incorporate high frequency generators, operate at higher tube potentials and produce X-ray spectra that have higher mean energy and therefore are more penetrating compared to those produced by older dental X-ray units. These improve- ments have contributed in the reduction of the radiation dose to the entrance skin surface of the patient and the enhancement of image quality. Concerning the X-ray receptors, new digital systems have been introduced in to the clinical practice and nowadays digital radiography is considered an accepted imaging technique in dentistry. Currently, solid-state detectors based on CCD or CMOS technology, photostimulable storage phosphor (PSP) systems, along with the old-fashioned but still widely used silver halide based films, are commercially avail- able for intraoral radiography. In the international literature many remarkable articles can be found describing digital receptor systems and presenting comparisons among various systems with regard to their diagnostic performance [3-7]. Their re- sults, however, have been derived using a limited range of exposure factors, despite the fact that the response of films and solid state or PSP receptors is dependent on the energy spectrum of the X-ray beam used and the  E. Katsoni et al. / Health 3 (2011) 292-299 Copyright © 2011 SciRes. Openly accessible at http://www.scirp.org/journal/HEALTH/ 293293 dose levels to which they are exposed. The influence of the exposure factors on the performance of dental re- ceptors of different technologies has not yet been inves- tigated extensively. The purpose of this study was to comparatively evalu- ate, in a systematic inter-equipment manner, the useful exposure range of three intraoral image receptors which are representative of the currently available technologies, when exposed to different X-ray beam spectra, dose and dose rate levels. 2. MATERIAL AND METHODS A modern dental X-ray unit (Prostyle Intra DC, Plan- meca Oy, Helsinki, Finland) was used, offering eight tube potential settings (ranging from 50 to 70 kVp), seven tube current settings (ranging from 2 - 8 mA) and 26 exposure time settings (ranging from 0.01 to 3.2 sec). The nominal total filtration was 2 mm Al and the focus to collimator end distance was 30 cm. A calibrated ion chamber dosimeter (Dosimeter 9010, ionization chamber type 90x6-6; Radcal Corporation, Monrovia, USA) positioned at 30 cm from the tube fo- cus was used to measure the dose in free air and deter- mine the tube output at that distance. These measure- ments were carried out for all the available tube potential, tube current and exposure time selections, in order to identify possible variations in output with different tube loading values. The tube potential accuracy and repro- ducibility were checked using a calibrated kilovolt peak meter (Gammex RMI 245, Gammex Inc., Middleton, USA). The intraoral radiographic receptors evaluated in this study were: the Kodak Insight F speed class film (East- man Kodak Company, Rochester, NY), the Kodak RVG 6000 (Eastman Kodak Company, Rochester, NY), and the Duerr Vistascan Combi PSP system (Duerr Dental, Bietingsheim-Bissingen, Germany). The main technical characteristics of the systems tested are summarized in Table 1. A cylindrical Perspex based phantom (Dental Image Quality Test Tool, model 76025; Nuclear Associates, Division of Victoreen, Inc, Carle Place, NY) was used for the evaluation of image quality [8]. This phantom contains a real human tooth in the centre and around it three cylindrical air filled holes of different height. In the periphery of the phantom four wire meshes of different wire thickness are included. Finally, the phantom has a slot in order to fit in the various image receptors. A pho- tograph and a radiographic image of the phantom are shown in Figure 1 and Figure 2, respectively. The phantom was attached to the collimator end and the image to receptor distance was kept constant at 35 cm. The phantom was radiographed using all the image re- ceptors and for each receptor all the tube potential, tube current and exposure time combinations possible. Thus, 1456 exposures were required for each image receptor in total. The films were processed immediately after exposure, with an automatic processor (Velopex Extra-X, Medivance Instuments, England) using the Readymatic dental de- veloper and Readymatic dental fixer solutions (Eastman Kodak, Rochester NY), at a temperature of 27˚C. This processor features an automatic replenishment system, however, in order to ensure that the processing condi- tions remain fairly constant during the experiments, the processing stability was repeatedly tested every 50 films using sensitometry (Pehamed densitometer Densinorm 21, PEHA med. Geräte GmbH Sulzbach, Germany). The acquired film radiographs were mounted in opaque plas- tic holders and coded for later use. The film radiographs were evaluated on a viewing box, with all extraneous light masked. For the Vistascan the PSP image plates were unpacked in a dimly lit room and scanned immediately after expo- sure, using the Vistascan Combi system [9,10]. The scanner’s resolution pitch settings were adjusted to 12.5 μm (corresponding to a theoretical resolution of 40 line pairs per mm). Concerning the RVG 6000 the original software of the system was used for image capture. No image processing was performed to enhance image qual- ity other than the system’s default pre-process. All digital images were viewed in fit to screen mode Table 1. Specifications of the systems. Model ManufacturerPixel Size (μm) Technology Software Size Bit/PixelWidth (Pixel) Height (Pixel) File Size (MB) INSIGHT KODAK N/A SILVER HALIDE N/A 2 N/A 3.1 (cm) 4.1 (cm)N/A RVG 6000 KODAK 18.5 × 18.5 CMOS KODAK WINDOWS 6.0.1 1 8 1200 1600 1.8 PSP VISTASCAN DUERR SCAN PITCH 12.5 IMAGE PLATEDBSWIN V.3.32 16 2476 3195 Up to 9.3 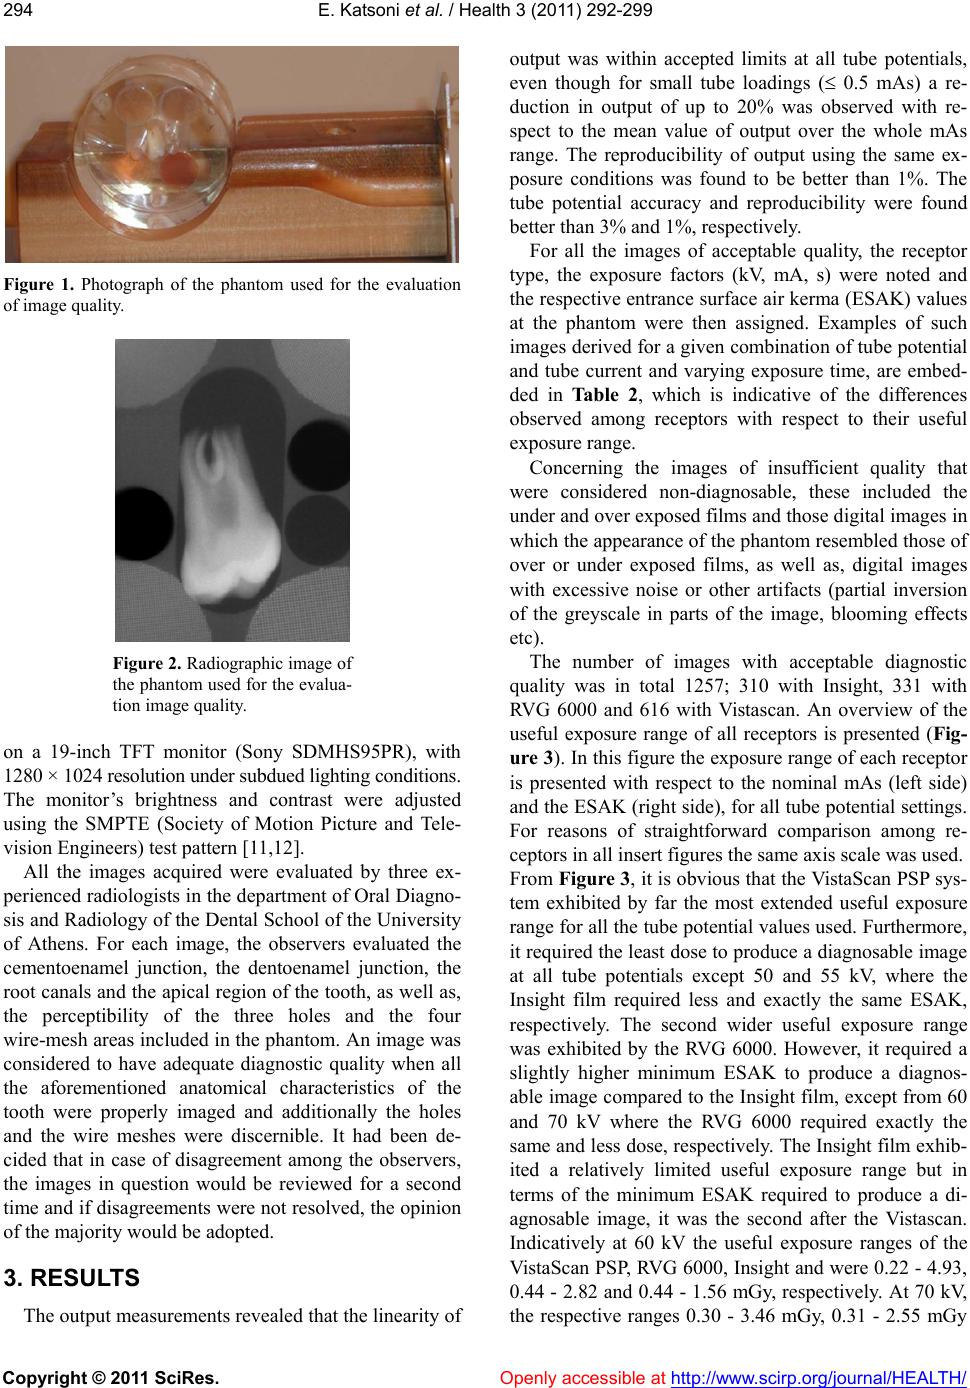 E. Katsoni et al. / Health 3 (2011) 292-299 Copyright © 2011 SciRes. Openly accessible at http://www.scirp.org/journal/HEALTH/ 294 Figure 1. Photograph of the phantom used for the evaluation of image quality. Figure 2. Radiographic image of the phantom used for the evalua- tion image quality. on a 19-inch TFT monitor (Sony SDMHS95PR), with 1280 × 1024 resolution under subdued lighting conditions. The monitor’s brightness and contrast were adjusted using the SMPTE (Society of Motion Picture and Tele- vision Engineers) test pattern [11,12]. All the images acquired were evaluated by three ex- perienced radiologists in the department of Oral Diagno- sis and Radiology of the Dental School of the University of Athens. For each image, the observers evaluated the cementoenamel junction, the dentoenamel junction, the root canals and the apical region of the tooth, as well as, the perceptibility of the three holes and the four wire-mesh areas included in the phantom. An image was considered to have adequate diagnostic quality when all the aforementioned anatomical characteristics of the tooth were properly imaged and additionally the holes and the wire meshes were discernible. It had been de- cided that in case of disagreement among the observers, the images in question would be reviewed for a second time and if disagreements were not resolved, the opinion of the majority would be adopted. 3. RESULTS The output measurements revealed that the linearity of output was within accepted limits at all tube potentials, even though for small tube loadings ( 0.5 mAs) a re- duction in output of up to 20% was observed with re- spect to the mean value of output over the whole mAs range. The reproducibility of output using the same ex- posure conditions was found to be better than 1%. The tube potential accuracy and reproducibility were found better than 3% and 1%, respectively. For all the images of acceptable quality, the receptor type, the exposure factors (kV, mA, s) were noted and the respective entrance surface air kerma (ESAK) values at the phantom were then assigned. Examples of such images derived for a given combination of tube potential and tube current and varying exposure time, are embed- ded in Table 2, which is indicative of the differences observed among receptors with respect to their useful exposure range. Concerning the images of insufficient quality that were considered non-diagnosable, these included the under and over exposed films and those digital images in which the appearance of the phantom resembled those of over or under exposed films, as well as, digital images with excessive noise or other artifacts (partial inversion of the greyscale in parts of the image, blooming effects etc). The number of images with acceptable diagnostic quality was in total 1257; 310 with Insight, 331 with RVG 6000 and 616 with Vistascan. An overview of the useful exposure range of all receptors is presented (Fig- ure 3). In this figure the exposure range of each receptor is presented with respect to the nominal mAs (left side) and the ESAK (right side), for all tube potential settings. For reasons of straightforward comparison among re- ceptors in all insert figures the same axis scale was used. From Figure 3, it is obvious that the VistaScan PSP sys- tem exhibited by far the most extended useful exposure range for all the tube potential values used. Furthermore, it required the least dose to produce a diagnosable image at all tube potentials except 50 and 55 kV, where the Insight film required less and exactly the same ESAK, respectively. The second wider useful exposure range was exhibited by the RVG 6000. However, it required a slightly higher minimum ESAK to produce a diagnos- able image compared to the Insight film, except from 60 and 70 kV where the RVG 6000 required exactly the same and less dose, respectively. The Insight film exhib- ited a relatively limited useful exposure range but in terms of the minimum ESAK required to produce a di- agnosable image, it was the second after the Vistascan. Indicatively at 60 kV the useful exposure ranges of the VistaScan PSP, RVG 6000, Insight and were 0.22 - 4.93, 0.44 - 2.82 and 0.44 - 1.56 mGy, respectively. At 70 kV, the respective ranges 0.30 - .46 mGy, 0.31 - 2.55 mGy 3 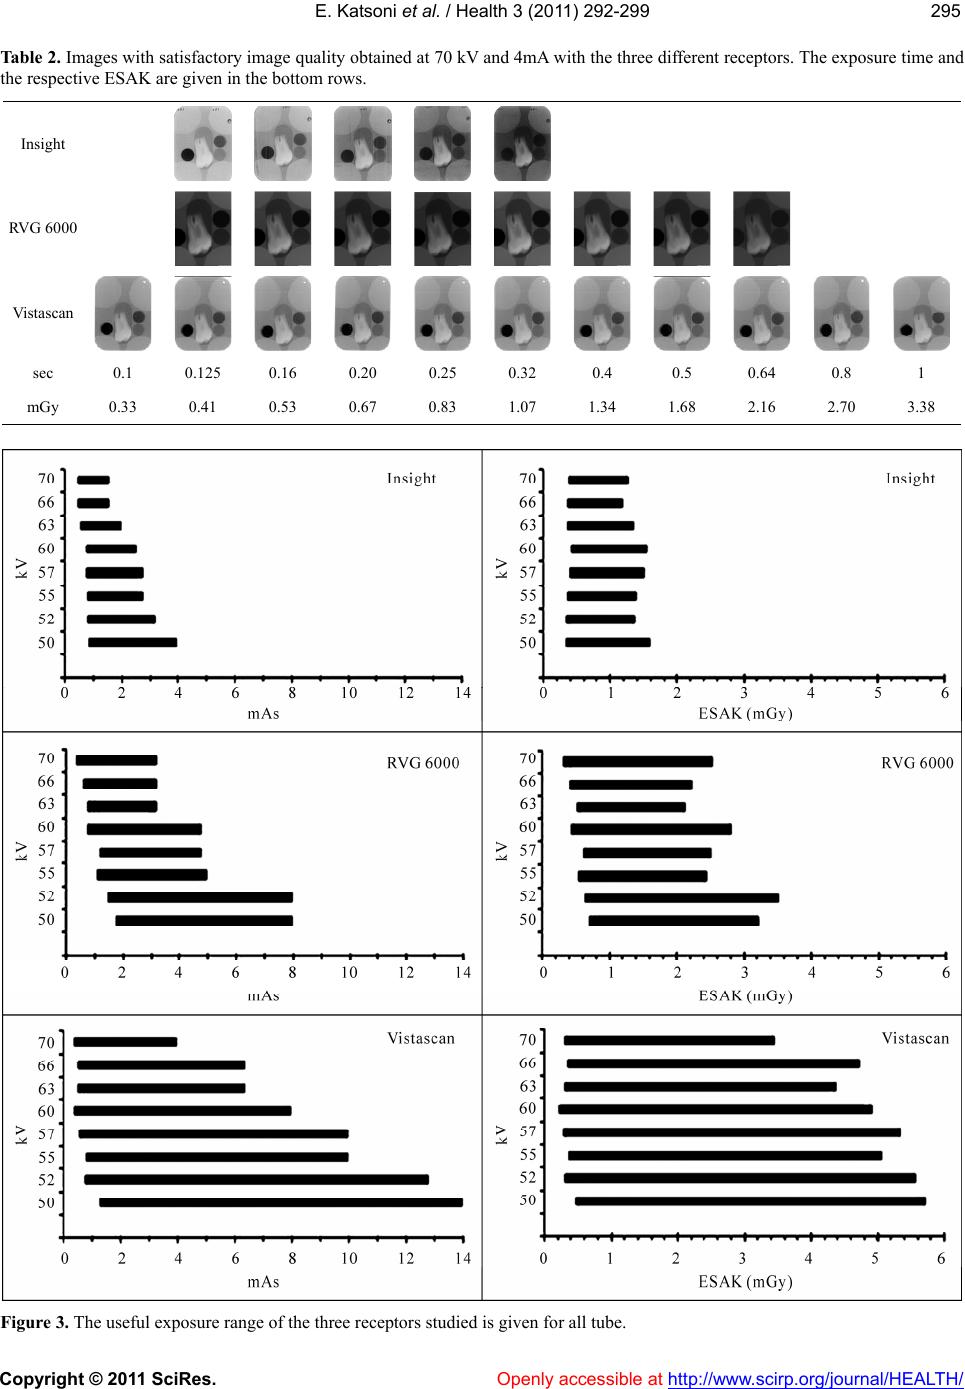 E. Katsoni et al. / Health 3 (2011) 292-299 Copyright © 2011 SciRes. Openly accessible at http://www.scirp.org/journal/HEALTH/ 295295 Table 2. Images with satisfactory image quality obtained at 70 kV and 4mA with the three different receptors. The exposure time and the respective ESAK are given in the bottom rows. Insight RVG 6000 Vistascan sec 0.1 0.125 0.16 0.20 0.25 0.32 0.4 0.5 0.64 0.8 1 mGy 0.33 0.41 0.53 0.67 0.83 1.07 1.34 1.68 2.16 2.70 3.38 Figure 3. The useful exposure range of the three receptors studied is given for all tube. 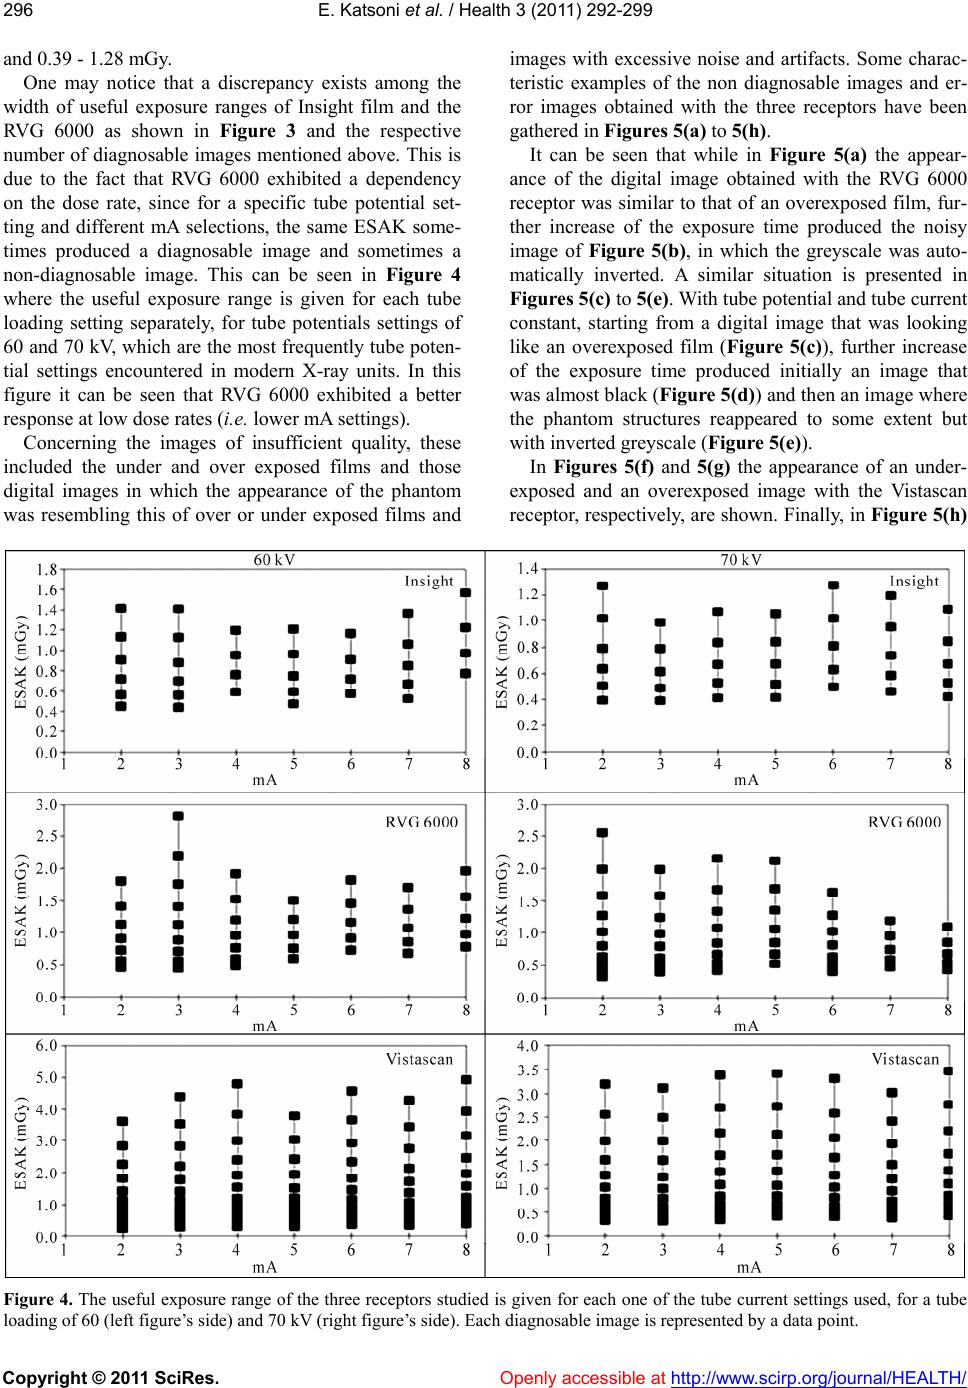 E. Katsoni et al. / Health 3 (2011) 292-299 Copyright © 2011 SciRes. Openly accessible at http://www.scirp.org/journal/HEALTH/ 296 and 0.39 - 1.28 mGy. One may notice that a discrepancy exists among the width of useful exposure ranges of Insight film and the RVG 6000 as shown in Figure 3 and the respective number of diagnosable images mentioned above. This is due to the fact that RVG 6000 exhibited a dependency on the dose rate, since for a specific tube potential set- ting and different mA selections, the same ESAK some- times produced a diagnosable image and sometimes a non-diagnosable image. This can be seen in Figure 4 where the useful exposure range is given for each tube loading setting separately, for tube potentials settings of 60 and 70 kV, which are the most frequently tube poten- tial settings encountered in modern X-ray units. In this figure it can be seen that RVG 6000 exhibited a better response at low dose rates (i.e. lower mA settings). Concerning the images of insufficient quality, these included the under and over exposed films and those digital images in which the appearance of the phantom was resembling this of over or under exposed films and images with excessive noise and artifacts. Some charac- teristic examples of the non diagnosable images and er- ror images obtained with the three receptors have been gathered in Figures 5(a) to 5(h). It can be seen that while in Figure 5(a) the appear- ance of the digital image obtained with the RVG 6000 receptor was similar to that of an overexposed film, fur- ther increase of the exposure time produced the noisy image of Figure 5(b), in which the greyscale was auto- matically inverted. A similar situation is presented in Figures 5(c) to 5(e). With tube potential and tube current constant, starting from a digital image that was looking like an overexposed film (Figure 5(c)), further increase of the exposure time produced initially an image that was almost black (Figure 5(d)) and then an image where the phantom structures reappeared to some extent but with inverted greyscale (Figure 5(e)). In Figures 5(f) and 5(g) the appearance of an under- exposed and an overexposed image with the Vistascan receptor, respectively, are shown. Finally, in Figure 5(h) Figure 4. The useful exposure range of the three receptors studied is given for each one of the tube current settings used, for a tube loading of 60 (left figure’s side) and 70 kV (right figure’s side). Each diagnosable image is represented by a data point. 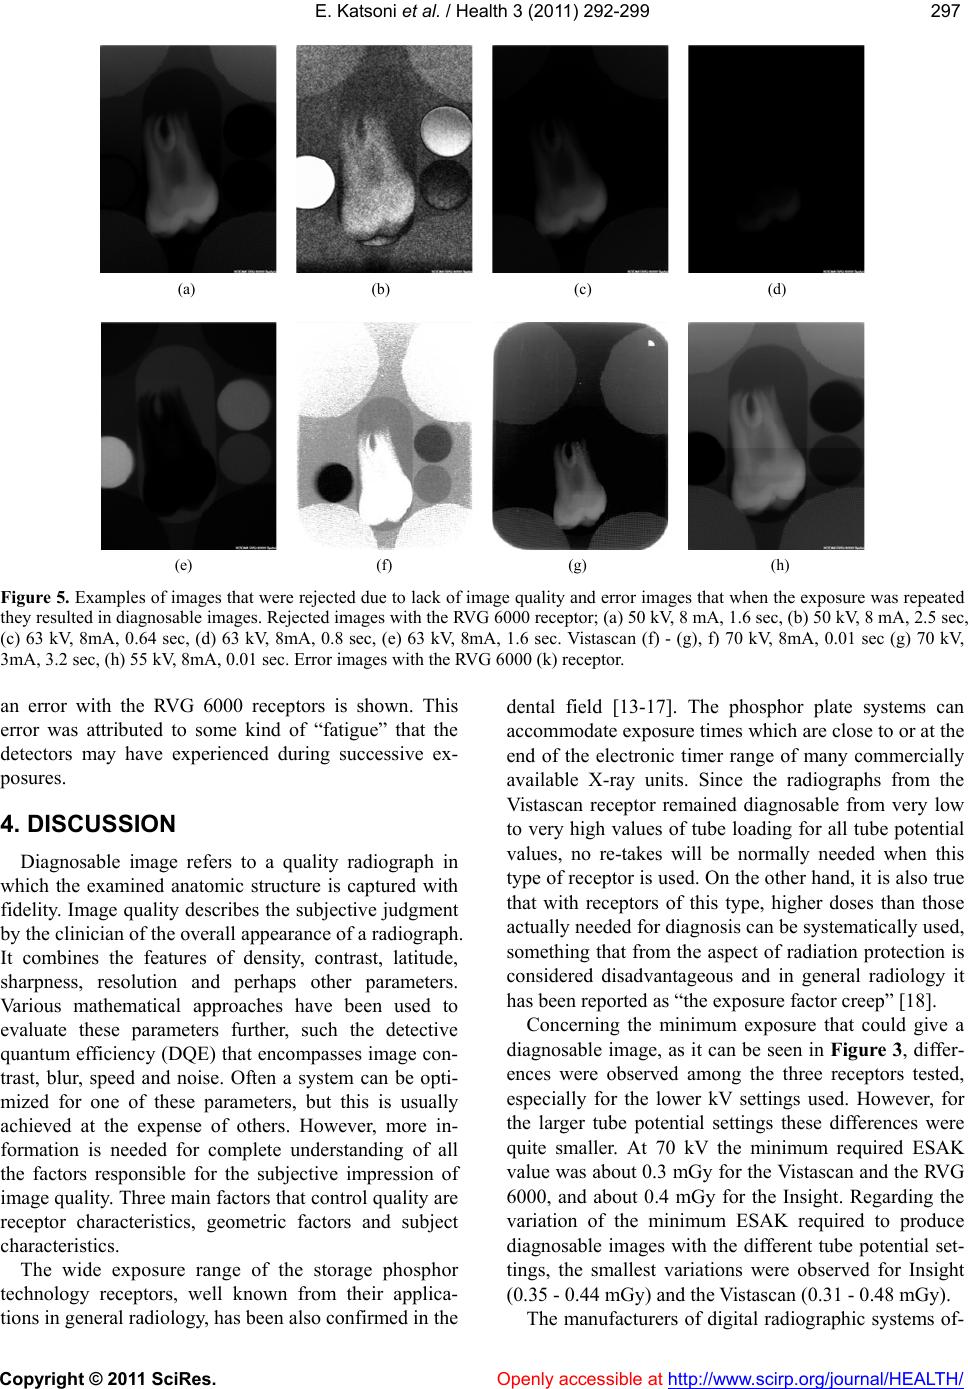 E. Katsoni et al. / Health 3 (2011) 292-299 Copyright © 2011 SciRes. Openly accessible at http://www.scirp.org/journal/HEALTH/ 297297 (a) (b) (c) (d) (e) (f) (g) (h) Figure 5. Examples of images that were rejected due to lack of image quality and error images that when the exposure was repeated they resulted in diagnosable images. Rejected images with the RVG 6000 receptor; (a) 50 kV, 8 mA, 1.6 sec, (b) 50 kV, 8 mA, 2.5 sec, (c) 63 kV, 8mA, 0.64 sec, (d) 63 kV, 8mA, 0.8 sec, (e) 63 kV, 8mA, 1.6 sec. Vistascan (f) - (g), f) 70 kV, 8mA, 0.01 sec (g) 70 kV, 3mA, 3.2 sec, (h) 55 kV, 8mA, 0.01 sec. Error images with the RVG 6000 (k) receptor. an error with the RVG 6000 receptors is shown. This error was attributed to some kind of “fatigue” that the detectors may have experienced during successive ex- posures. 4. DISCUSSION Diagnosable image refers to a quality radiograph in which the examined anatomic structure is captured with fidelity. Image quality describes the subjective judgment by the clinician of the overall appearance of a radiograph. It combines the features of density, contrast, latitude, sharpness, resolution and perhaps other parameters. Various mathematical approaches have been used to evaluate these parameters further, such the detective quantum efficiency (DQE) that encompasses image con- trast, blur, speed and noise. Often a system can be opti- mized for one of these parameters, but this is usually achieved at the expense of others. However, more in- formation is needed for complete understanding of all the factors responsible for the subjective impression of image quality. Three main factors that control quality are receptor characteristics, geometric factors and subject characteristics. The wide exposure range of the storage phosphor technology receptors, well known from their applica- tions in general radiology, has been also confirmed in the dental field [13-17]. The phosphor plate systems can accommodate exposure times which are close to or at the end of the electronic timer range of many commercially available X-ray units. Since the radiographs from the Vistascan receptor remained diagnosable from very low to very high values of tube loading for all tube potential values, no re-takes will be normally needed when this type of receptor is used. On the other hand, it is also true that with receptors of this type, higher doses than those actually needed for diagnosis can be systematically used, something that from the aspect of radiation protection is considered disadvantageous and in general radiology it has been reported as “the exposure factor creep” [18]. Concerning the minimum exposure that could give a diagnosable image, as it can be seen in Figure 3, differ- ences were observed among the three receptors tested, especially for the lower kV settings used. However, for the larger tube potential settings these differences were quite smaller. At 70 kV the minimum required ESAK value was about 0.3 mGy for the Vistascan and the RVG 6000, and about 0.4 mGy for the Insight. Regarding the variation of the minimum ESAK required to produce diagnosable images with the different tube potential set- tings, the smallest variations were observed for Insight (0.35 - 0.44 mGy) and the Vistascan (0.31 - 0.48 mGy). The manufacturers of digital radiographic systems of- 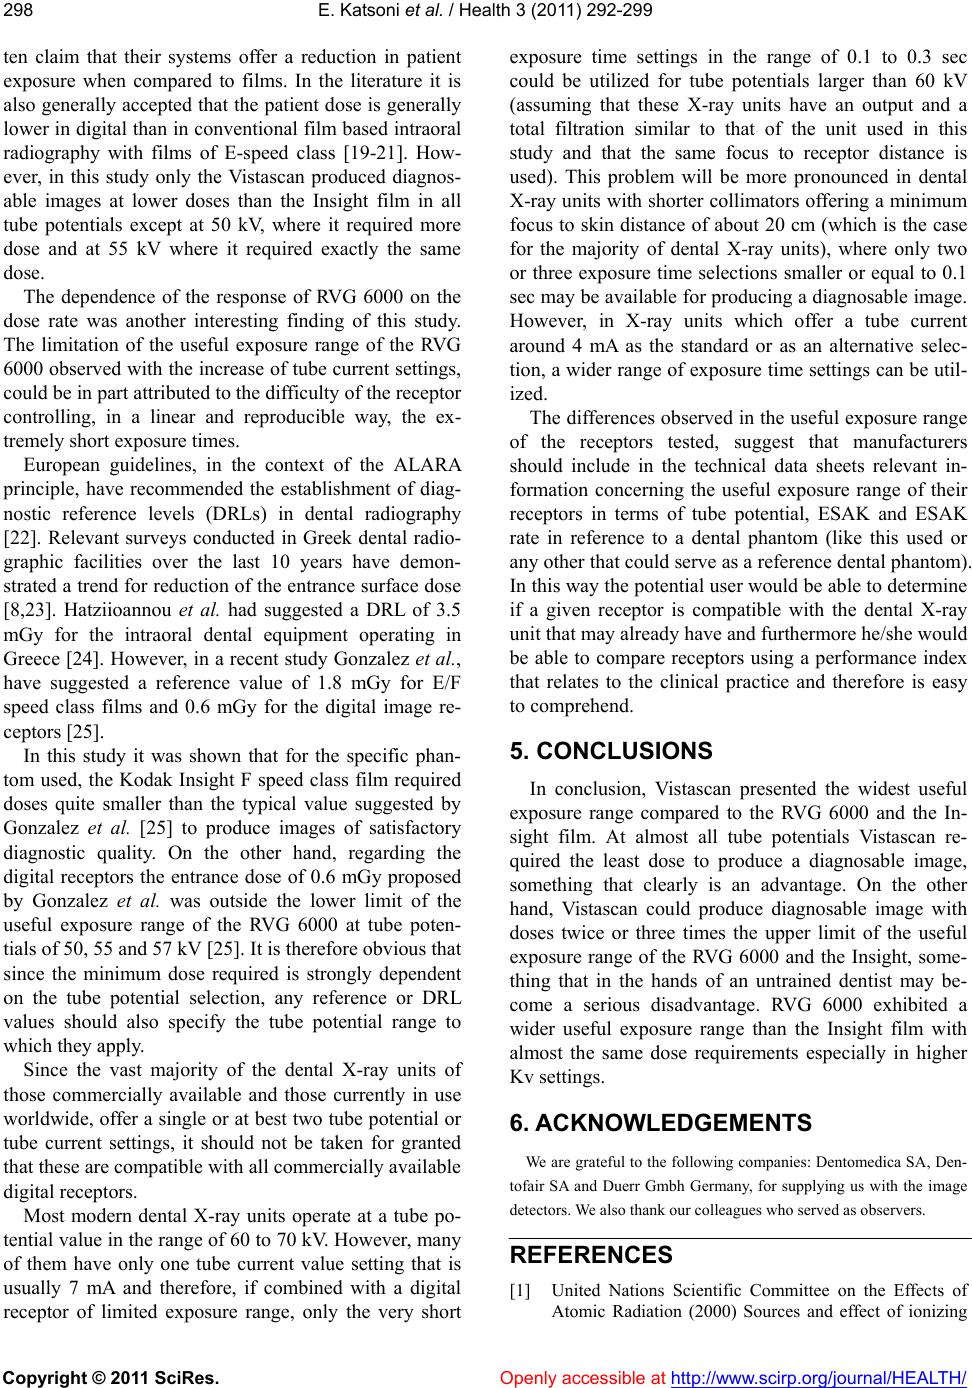 E. Katsoni et al. / Health 3 (2011) 292-299 Copyright © 2011 SciRes. Openly accessible at http://www.scirp.org/journal/HEALTH/ 298 ten claim that their systems offer a reduction in patient exposure when compared to films. In the literature it is also generally accepted that the patient dose is generally lower in digital than in conventional film based intraoral radiography with films of E-speed class [19-21]. How- ever, in this study only the Vistascan produced diagnos- able images at lower doses than the Insight film in all tube potentials except at 50 kV, where it required more dose and at 55 kV where it required exactly the same dose. The dependence of the response of RVG 6000 on the dose rate was another interesting finding of this study. The limitation of the useful exposure range of the RVG 6000 observed with the increase of tube current settings, could be in part attributed to the difficulty of the receptor controlling, in a linear and reproducible way, the ex- tremely short exposure times. European guidelines, in the context of the ALARA principle, have recommended the establishment of diag- nostic reference levels (DRLs) in dental radiography [22]. Relevant surveys conducted in Greek dental radio- graphic facilities over the last 10 years have demon- strated a trend for reduction of the entrance surface dose [8,23]. Hatziioannou et al. had suggested a DRL of 3.5 mGy for the intraoral dental equipment operating in Greece [24]. However, in a recent study Gonzalez et al., have suggested a reference value of 1.8 mGy for E/F speed class films and 0.6 mGy for the digital image re- ceptors [25]. In this study it was shown that for the specific phan- tom used, the Kodak Insight F speed class film required doses quite smaller than the typical value suggested by Gonzalez et al. [25] to produce images of satisfactory diagnostic quality. On the other hand, regarding the digital receptors the entrance dose of 0.6 mGy proposed by Gonzalez et al. was outside the lower limit of the useful exposure range of the RVG 6000 at tube poten- tials of 50, 55 and 57 kV [25]. It is therefore obvious that since the minimum dose required is strongly dependent on the tube potential selection, any reference or DRL values should also specify the tube potential range to which they apply. Since the vast majority of the dental X-ray units of those commercially available and those currently in use worldwide, offer a single or at best two tube potential or tube current settings, it should not be taken for granted that these are compatible with all commercially available digital receptors. Most modern dental X-ray units operate at a tube po- tential value in the range of 60 to 70 kV. However, many of them have only one tube current value setting that is usually 7 mA and therefore, if combined with a digital receptor of limited exposure range, only the very short exposure time settings in the range of 0.1 to 0.3 sec could be utilized for tube potentials larger than 60 kV (assuming that these X-ray units have an output and a total filtration similar to that of the unit used in this study and that the same focus to receptor distance is used). This problem will be more pronounced in dental X-ray units with shorter collimators offering a minimum focus to skin distance of about 20 cm (which is the case for the majority of dental X-ray units), where only two or three exposure time selections smaller or equal to 0.1 sec may be available for producing a diagnosable image. However, in X-ray units which offer a tube current around 4 mA as the standard or as an alternative selec- tion, a wider range of exposure time settings can be util- ized. The differences observed in the useful exposure range of the receptors tested, suggest that manufacturers should include in the technical data sheets relevant in- formation concerning the useful exposure range of their receptors in terms of tube potential, ESAK and ESAK rate in reference to a dental phantom (like this used or any other that could serve as a reference dental phantom). In this way the potential user would be able to determine if a given receptor is compatible with the dental X-ray unit that may already have and furthermore he/she would be able to compare receptors using a performance index that relates to the clinical practice and therefore is easy to comprehend. 5. CONCLUSIONS In conclusion, Vistascan presented the widest useful exposure range compared to the RVG 6000 and the In- sight film. At almost all tube potentials Vistascan re- quired the least dose to produce a diagnosable image, something that clearly is an advantage. On the other hand, Vistascan could produce diagnosable image with doses twice or three times the upper limit of the useful exposure range of the RVG 6000 and the Insight, some- thing that in the hands of an untrained dentist may be- come a serious disadvantage. RVG 6000 exhibited a wider useful exposure range than the Insight film with almost the same dose requirements especially in higher Kv settings. 6. ACKNOWLEDGEMENTS We are grateful to the following companies: Dentomedica SA, Den- tofair SA and Duerr Gmbh Germany, for supplying us with the image detectors. We also thank our colleagues who served as observers. REFERENCES [1] United Nations Scientific Committee on the Effects of Atomic Radiation (2000) Sources and effect of ionizing  E. Katsoni et al. / Health 3 (2011) 292-299 Copyright © 2011 SciRes. http://www.scirp.org/journal/HEALTH/Openly accessible at 299299 radiation. Report, 1, UNSCEAR publications, Vienna. [2] European Union. (1997) Council Directive 97/43 Eura- tom, on health protection of individuals against the dan- gers of ionizing radiation in relation to medical expo- sures, and repealing Directive 84/466 Euratom. Official Journal of the European Communities, Legislation 180, 22. [3] Kitagawa, H. and Farman, A.G. (2004) Effect of beam energy and filtration on the signal-to-noise ratio of the Dexis intraoral X-ray detector. Dentomaxillofacial Radi- ology, 33, 21-24. doi:10.1259/dmfr/26493631 [4] Wenzel, A. (2006) A review of dentists’ use of digital radiography and caries diagnosis with digital systems. Dentomaxillofacial R a d i o l o gy, 35 , 307-314. doi:10.1259/dmfr/64693712 [5] Hellen-Halme, K. (2007) Quality aspects of digital radi- ography in general dental practice. Swedish Dental Journal. Supplement, 184, 9-60. [6] Cowen, A.R., Kengyelics, S.M. and Davies, A.G. (2008) Solid-state, flat-panel, digital radiography detectors and their physical imaging characteristics. Clinical Radiology, 63, 487-498. doi:10.1016/j.crad.2007.10.014 [7] Hintze, H. (2006) Diagnostic accuracy of two software modalities for detection of caries lesions in digital radio- graphs from four dental systems. Dentomaxillofacial Ra- diology, 35, 78-82. doi:10.1259/dmfr/50356588 [8] Yakoumakis, E.N., Tierris, C.E., Stefanou, E.P., Phanoura- kis, I.G. and Proukakis. C.C. (2001) Image quality as- sessment and radiation doses in intraoral radiography. Oral Surgery, Oral Medicine, Oral Pathology, Oral Ra- diology, and Endodontics, 91, 362-368. doi:10.1067/moe.2001.111940 [9] Ang, D.B., Angelopoulos, C. and Katz, J.O. (2006) How does signal fade on photo-stimulable storage phosphor imaging plates when scanned with a delay and what is the effect on image quality? Oral Surgery, Oral Medicine, Oral Pathology, Oral Radiology, and Endodontics, 102, 673-679. doi:10.1016/j.tripleo.2005.11.002 [10] Ramamurthy, R., Canning, C.F., Scheetz, J.P. and Farman, A.G. (2004) Impact of ambient lighting intensity and du- ration on the signal-to-noise ratio of images from photo- stimulable phosphor plates processed using DenOptix and ScanX systems. Dentomaxillofacial Radiology, 33, 307-311. doi:10.1259/dmfr/91373164 [11] Parsons, D.M., Kim, Y. and Haynor, D.R. (1995) Quality control of cathode-ray tube monitors for medical imaging using a simple photometer. Journal of Digital Imaging, 8, 10-20. doi:10.1007/BF03168051 [12] Jervis, S.E. and Brettle, D.S. (2003) A practical approach to soft-copy display consistency for PC-based review workstations. The British Journal of Radiology, 76, 648-652. doi:10.1259/bjr/25693100 [13] Berkhout, W.E.R., Beuger, D.A., Sanderink, G.C.H. and Stelt, van der P.F. (2004) The dynamic range of digital radiographic systems: Dose reduction or risk of overex- posure? Dentomaxillofacial Radiology, 33, 1-5. doi:10.1259/dmfr/40677472 [14] Borg, E. and Grondahl, H.G. (1996) On the dynamic range of different X-ray photon detectors in intra-oral ra- diography. A comparison of image quality in film, charge-coupled device and storage phosphor systems. Dentomaxillofacial R a d i o l o gy, 25 , 82-88. [15] Borg, E., Attaelmanan, A. and Grondahl, H.G. (2000) Image plate systems differ in physical performance. Oral Surgery, Oral Medicine, Oral Pathology, Oral Radiology, and Endodontics, 89, 118-124. doi:10.1016/S1079-2104(00)80026-8 [16] Farman, A.G. and Farman, T.T. (2005) A comparison of 18 different x-ray detectors currently used in dentistry. Oral Surgery, Oral Medicine, Oral Pathology, Oral Ra- diology, and Endodontics, 99, 485-489. doi:10.1016/j.tripleo.2004.04.002 [17] Kitagawa, H., Farman, A.G., Scheetz, J.P., Brown, W.P., Lewis, J., Benefiel, M., et al. (2000) Comparison of three intra-oral storage phosphor systems using subjective im- age quality. Dentomaxillofacial Radiology, 29, 272-276. doi:10.1038/sj.dmfr.4600532 [18] Willis, C.E. (2004) Strategies for dose reduction in ordi- nary radiographic examinations using CR and DR. Pedi- atric Radiology, 34, Supplement 3, S196-200, discussion, S34-41. [19] Bhaskaran, V., Qualtrough, A.J.E., Rushton, V.E., Wor- thington, H.V. and Horner, K. (2005) A laboratory com- parison of three imaging systems for image quality and radiation exposure characteristics. International Endo- dontic Journal, 38, 645-652. doi:10.1111/j.1365-2591.2005.00998.x [20] Hayakawa, Y., Shibuya, H., Ota, Y. and Kuroyanagi, K. (1997) Radiation dosage reduction in general dental prac- tice using digital intraoral radiographic systems. The Bulletin of Tokyo Dental College, 38, 21-25. [21] Yoshiura, K., Welander, U., McDavid, W.D., Li, G., Shi, X.Q., Nakayama, E., et al. (2004) Comparison of the psychophysical properties of various intraoral film and digital systems by means of the perceptibility curve test. Dentomaxillofacial R a d i o l o gy, 33 , 98-102. doi:10.1259/dmfr/29102849 [22] Radiation Protection (2004) European guidelines on ra- diation protection in dental radiology: The safe use of ra- diographs in dental practice. 136. [23] Syriopoulos, K., Velders, X.L., Stelt, van der P.F., Ginkel, van F.C. and Tsiklakis, K. (1998) Mail survey of dental radiographic techniques and radiation doses in Greece. Dentomaxillofacial R a d i o l o gy, 27 , 321-328. doi:10.1038/sj.dmfr.4600385 [24] Hatziioannou, K., Psarouli, E., Papanastassiou, E., Bous- bouras, P., Kodona, H., Kimoundri, O., et al. (2005) Quality control and diagnostic reference levels in in- traoral dental radiographic facilities. Dentomaxillofacial Radiology, 34, 304-307. doi:10.1259/dmfr/38802780 [25] Gonzalez, L. and Moro, J. (2007) Patient radiation dose management in dental facilities according to the X-ray focal distance and the image receptor type. Dentomaxil- lofacial Radiology, 36, 282-284. doi:10.1259/dmfr/67494525 |