

Paper Menu >>
Journal Menu >>
 Energy and Power En gi neering, 2011, 3, 190-193 doi:10.4236/epe.2011.32024 Published Online May 2011 (http://www.SciRP.org/journal/epe) Copyright © 2011 SciRes. EPE A Hybrid Short Term Load Forecasting Model of an Indian Grid Rabindra Behera1, Bibhu Prasad Panigrahi1, Bibhuti Bhusan Pati2 1Department of Electrical Engineering I. G. I. T. Sarang, Orissa, India 2Department of Electrical Engineering VSSUT Burla, Orissa, India E-mail: [email protected], bibhu89@yahoo.com, [email protected] Received March 21, 20 1 1; revised March 28, 2011; accepted April 8, 2011 Abstract This paper describes an application of combined model of extrapolation and correlation techniques for short term load forecasting of an Indian substation. Here effort has been given to improvise the accuracy of elec- trical load forecasting considering the factors, past data of the load, respective weather condition and finan- cial growth of the people. These factors are derived by curve fitting technique. Then simulation has been conducted using MATLAB tools. Here it has been suggested that consideration of 20 years data for a devel- oping country should be ignored as the development of a country is highly unpredictable. However, the im- portance of the past data should not be ignored. Here, just previous five years data are used to determine the above factors. Keywords: Short Term Load Forecasting, Parameter Estimation, Trending Technique, Co-Relation 1. Introduction Electrical energy is a superior form of energy for all types of consumer needs. The close tracking of system generation at all time is the basic requirement in the op- eration of power system. There is a 3% - 7% of increase of electrical load per year for many years. Short-term load forecasting (STLF) is essential for an effective en- ergy management in a deregulated power open market. However, the electric power load forecasting problem is not easy to handle due to nonlinear and random-like be- haviors of system loads, weather conditions, and varia- tions of social and economic environments. A wide variety of models have been proposed in the last two decades for STLF due to its importance etc. A wide variety of models have been proposed in the last two decades for STLF due to its importance, such as Functional clustering and linear regression for peak load forecasting [1], Mixed price and load forecasting of elec- tricity markets by a new iterative prediction method [2] and univariate modeling and forecasting of monthly en- ergy demand time series using abductive and neural networks [3] etc. Moreover, the electrical load forecast- ing depends on many known and unknown variables. These variables can be considered to have steady values within a specified reg ion under one electricity regulatory authority. This type of load forecasting is being termed as spatial load forecasting. Aldo Goia, Caterina May and Gianluca Fusai in their paper “Functional clustering and linear regression for peak load forecasting” suggested a new approach using past heating demand data in a district-heating system. Nima Amjadya, Ali Daraeepour in their paper “Mixed price and load forecasting of electricity markets by a new iterative prediction method” suggested real conditions of an electricity market and short-term load forecasting. R. E. Abdel-Aalin’s paper “Univariate modeling and Fore- casting of Monthly Energy Demand Time Series Using Abductive and Neural Networks” suggested univariate modeling of the monthly demand time series based only on data for 6 years to forecast the demand for the seventh year contrary to multivariate models. Here the load and weather data of Bhubaneswar (India) power grid has been collected for six consecutive years. Also the economic gr owth of the people is studied. It has been observed that economic growth in short term can be considered as neglig ible. A Case study has been conducted on an Indian grid located at Bhubaneswar, Orissa based on previous load and weather data. 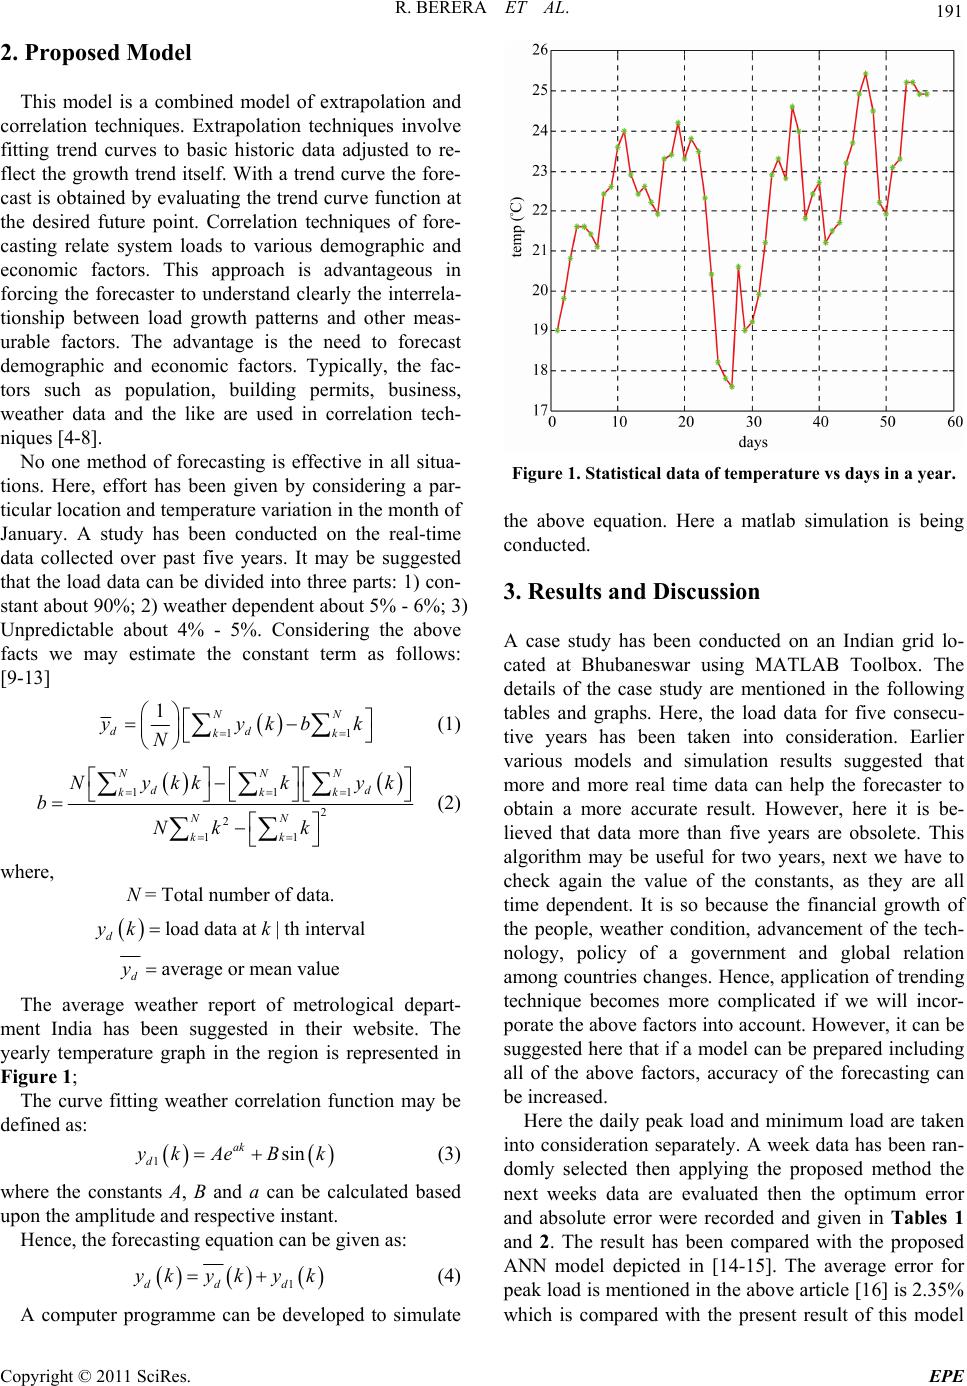 R. BERERA ET AL. 191 2. Proposed Model This model is a combined model of extrapolation and correlation techniques. Extrapolation techniques involve fitting trend curves to basic historic data adjusted to re- flect the growth trend itself. With a trend curve the fore- cast is obtained by evaluating the trend curve function at the desired future point. Correlation techniques of fore- casting relate system loads to various demographic and economic factors. This approach is advantageous in forcing the forecaster to understand clearly the interrela- tionship between load growth patterns and other meas- urable factors. The advantage is the need to forecast demographic and economic factors. Typically, the fac- tors such as population, building permits, business, weather data and the like are used in correlation tech- niques [4-8]. No one method of forecasting is effective in all situa- tions. Here, effort has been given by considering a par- ticular location and temperature variation in the month of January. A study has been conducted on the real-time data collected over past five years. It may be suggested that the load data can be divided into three parts: 1) con- stant about 90%; 2) weather dependent about 5% - 6%; 3) Unpredictable about 4% - 5%. Considering the above facts we may estimate the constant term as follows: [9-13] 1 1N dd k1 N k y yk bk N (1) 111 2 2 11 NNN d kkk NN kk Nykkkyk bNk k d (2) where, N = Total number of data. load data at |th interval d yk k average or mean value d y The average weather report of metrological depart- ment India has been suggested in their website. The yearly temperature graph in the region is represented in Figure 1; The curve fitting weather correlation function may be defined as: 1sin ak d yk AeBk (3) where the constants A, B and a can be calculated based upon the amplitude and respective instant. Hence, the forecasting equation can be given as: 1ddd ykyky k (4) A computer programme can be developed to simulate Figure 1. Statistical data of temperature vs days in a year. the above equation. Here a matlab simulation is being conducted. 3. Results and Discussion A case study has been conducted on an Indian grid lo- cated at Bhubaneswar using MATLAB Toolbox. The details of the case study are mentioned in the following tables and graphs. Here, the load data for five consecu- tive years has been taken into consideration. Earlier various models and simulation results suggested that more and more real time data can help the forecaster to obtain a more accurate result. However, here it is be- lieved that data more than five years are obsolete. This algorithm may be useful for two years, next we have to check again the value of the constants, as they are all time dependent. It is so because the financial growth of the people, weather condition, advancement of the tech- nology, policy of a government and global relation among countries changes. Hence, application of trending technique becomes more complicated if we will incor- porate the above factors into account. However, it can be suggested here that if a model can be prepared including all of the above factors, accuracy of the forecasting can be increased. Here the daily peak load and minimum load are taken into consideration separately. A week data has been ran- domly selected then applying the proposed method the next weeks data are evaluated then the optimum error and absolute error were recorded and given in Tables 1 and 2. The result has been compared with the proposed ANN model depicted in [14-15]. The average error for peak load is mentio ned in the above article [1 6] is 2.35% which is compared with the present result of this model Copyright © 2011 SciRes. EPE 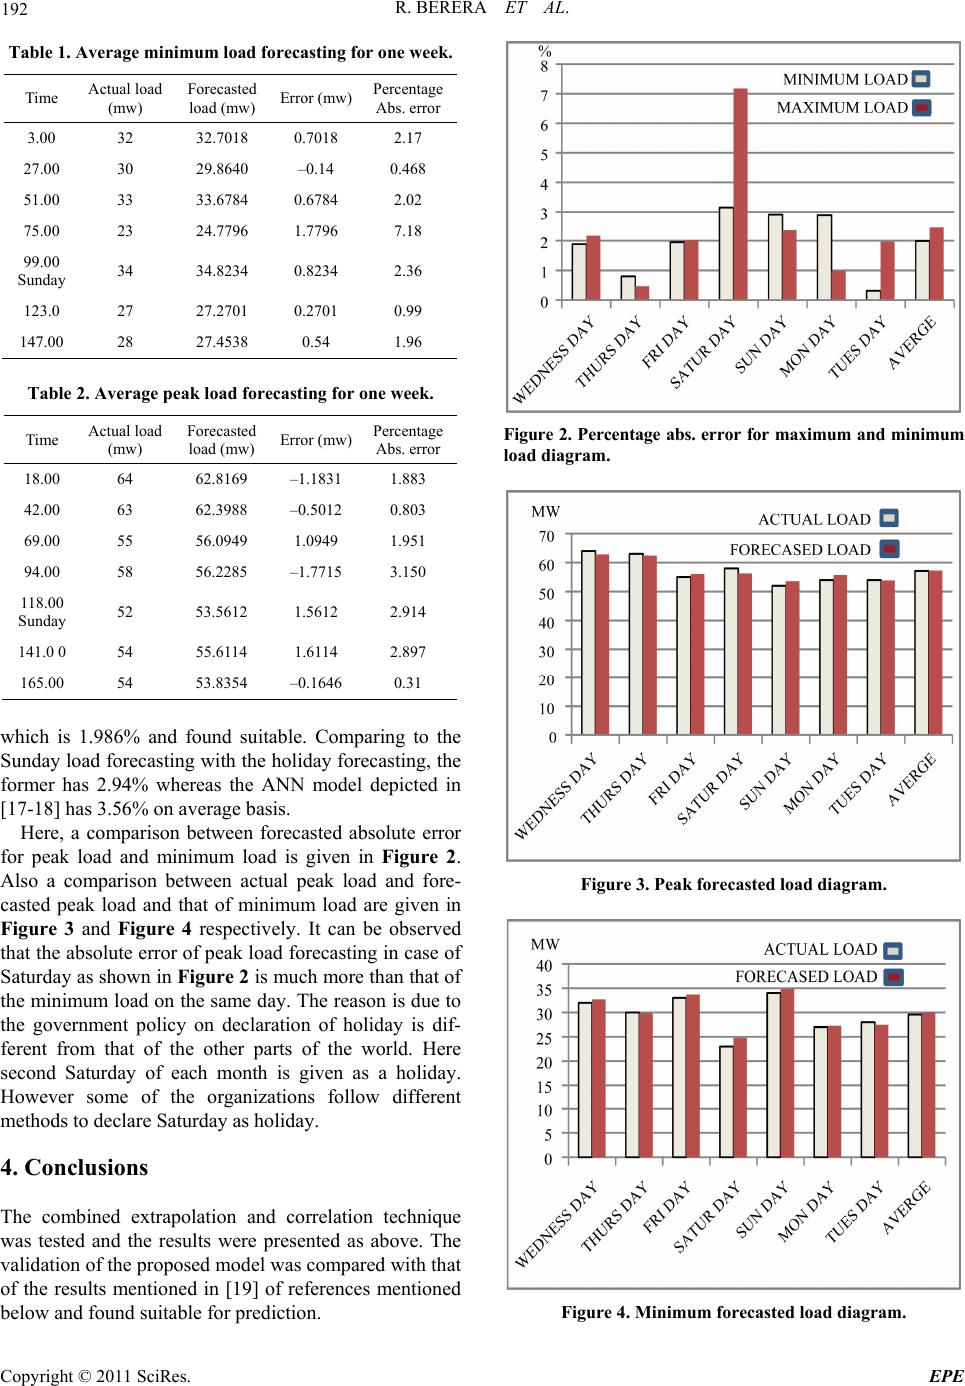 192 R. BERERA ET AL. Table 1. Average minimum load forecasting for one week. Time Actual load (mw) Forecasted load (mw) Error (mw) Percentage Abs. error 3.00 32 32.7018 0.7018 2.17 27.00 30 29.8640 –0.14 0.468 51.00 33 33.6784 0.6784 2.02 75.00 23 24.7796 1.7796 7.18 99.00 Sunday 34 34.8234 0.8234 2.36 123.0 27 27.2701 0.2701 0.99 147.00 28 27.4538 0.54 1.96 Table 2. Average peak load forecasting for one week. Time Actual load (mw) Forecasted load (mw) Error (mw) Percentage Abs. error 18.00 64 62.8169 –1.1831 1.883 42.00 63 62.3988 –0.5012 0.803 69.00 55 56.0949 1.0949 1.951 94.00 58 56.2285 –1.7715 3.150 118.00 Sunday 52 53.5612 1.5612 2.914 141.0 0 54 55.6114 1.6114 2.897 165.00 54 53.8354 –0.1646 0.31 which is 1.986% and found suitable. Comparing to the Sunday load forecasting with the holiday forecasting, the former has 2.94% whereas the ANN model depicted in [17-18] has 3.56% on average b a sis. Here, a comparison between forecasted absolute error for peak load and minimum load is given in Figure 2. Also a comparison between actual peak load and fore- casted peak load and that of minimum load are given in Figure 3 and Figure 4 respectively. It can be observed that the absolute error of peak load forecasting in case of Saturday as shown in Figure 2 is much more than that of the mini mum lo ad on the s ame day. The reason is due to the government policy on declaration of holiday is dif- ferent from that of the other parts of the world. Here second Saturday of each month is given as a holiday. However some of the organizations follow different methods to declare Saturday as holiday. 4. Conclusions The combined extrapolation and correlation technique was tested and the results were presented as above. The validation of the proposed model was compared with that of the results mentioned in [19] of references mentioned below and found su itable for predictio n. Figure 2. Percentage abs. error for maximum and minimum load diagram. Figure 3. Peak forecasted load diagram. Figure 4. Minimum forecasted load diagram. Copyright © 2011 SciRes. EPE  R. BERERA ET AL. Copyright © 2011 SciRes. EPE 193 5. References [10] H. Mori and M. Ohmi, “Probabilistic Short-Term Load Forecasting with Gaussian Processes,” Proceedings of the 13th International Conference on Intelligent Systems Application to Power Systems, Arlington, 6-10 November 2005, p. 6. doi:10.1109/ISAP.2005.1599306 [1] A. Goia, C. May and G. Fusai, “Functional Clustering and Linear Regression for Peak Load Forecasting,” In- ternational Journal of Forecasting, Vol. 26, No. 4, 2010, pp. 700-711. doi:10.1016/j.ijforecast.2009.05.015 [11] H. Chen, C. A. Canizares and A. Singh, “ANN Based Short-Term Load Forecasting in Electricity Markets,” IEEE Proceedings of Power Engineering Society Winter Meeting, Columbus, 28 January-1 February 2001, pp. 411-415. doi: 10.1109/PESW.2001.916876 [2] N. Amjady and A. Daraeepour, “Mixed Price and Load Forecasting of Electricity Markets by a New Iterative Prediction Method,” Electric Power Systems Research, Vol. 79, No. 9, 2009, pp. 1329-1336. doi:10.1016/j.epsr.2009.04.006 [12] H. S. Hippert, C. E. Pedreira and R. C. Souza, “Neural Networks for Short-Term Load Forecasting: A Review and Evaluation,” IEEE Transactions on Power Systems, Vol. 16, No. 1, 2011, pp. 44-55. doi: 10.1109/59.910780 [3] A. D. Papalexopoulos and T. C. Hesterberg, “A Regres- sion-Based Approach to Short-Term System Load Fore- casting,” IEEE Transactions on Power Systems, Vol. 5, No. 4, 1990, pp. 1535-1547. doi: 10.1109/59.99410 [13] W. Wang, C. Cheng and L. Qui, “Genetic Programming with Rough Sets Theory for Modeling Short Term Load Forecasting,” Fourth International Conference on Natural Computational, Jinan, 18-20 October 2008, pp. 306-310. doi: 10.1109/ICNC.2008.141 [4] S. Rahman and I. Moghram, “Application of Knowledge Based Algorithms in Electric Utility Load Forecasting,” IEEE Southeastern Conference on Energy and Informa- tion Technologies, Richmond, March 1989, pp. 380-385. doi:10.1109/SECON.1989.132399 [14] E. A. Feinberg, J. T. Hajagos and D. Genethliou, “Load Pocket Modeling,” Proceedings of the 2nd IASTED In- ternational Conference: Power and Energy Systems, Crete, 25-28 June 2002, pp. 50-54. [5] N. Kamel and Z. Baharudin, “Short-Term Load Forecast Using Burg Autoregressive Technique,” MIT Press, Cambridge, 1992. [15] D. Genethliou, “Statistical Load Modeling,” Proceedings of the 7th IASTED International Multi-Conference: Power and Energy Systems, Palm Springs, 2003, pp. 88-91. [6] S. Fan, L. Chen and W. J. Lee, “Short-Term Load Fore- casting Using Comprehensive Combination Based on Multi-Meteorological Information,” IEEE Industrial and Commercial Power Systems Technical Conference, Vol. 9, No. 2, 1994, pp. 1-7. [16] K.-B. Song, Y.-S. Baek, D. H. Hong and G. Jang, “Short-Term Load Forecasting for Holidays Using Fuzzy Linear Regression Method,” IEEE Transactions on Power Systems, Vol. 20, No. 1, 2005, pp. 96-101. doi: 10.1109/TPWRS.2004.835632 [7] C. S. Chen, J. C. Hwang, Y. M Tzeng, C. W. Huang and M. Y. Cho, “Determination of Customer Load Character- istics by Load Survey System,” IEEE Transactions on Power Delivery, Vol. 11, No. 3, pp. 1430-1436. doi: 10.1109/61.517501 [17] L. Vehviläinen and T. Pyykkönen, “Stochastic Factor Model for Electricity Spot Price—The Case of the Nordic Market,” Energy Economics, Vol. 27, No. 2, 2005, pp. 351-367. doi:10.1016/j.eneco.2005.01.002 [8] T. W. S Chow and C. T. Leung, “Nonlinear Autoregres- sive Integrated Neural Network Model for Short-Term Load Forecasting,” IEE Proceedings of Generation, Transmission and Distribution, Vol. 143, No. 5, 1996, pp. 500-506. doi: 10.1049/ip-gtd:19960600 [18] A. G. Baklrtzis, V. Petrldis, S. J. Klartzls, M. C. Alex- ladls and A. H. Malssls, “A Neural Network Short Term Load Forecasting Model for The Greek Power System” IEEE Transaction on Power Systems, Vol. 11, No. 2, 1996, pp. 858-863. doi: 10.1109/59.496166 [9] S. Rahman and O. Hazim, “Load Forecasting for Multiple Sites: Development of an Expert System-Based Tech- nique,” Electric Power Systems Research, Vol. 39, No. 3, 1996, pp. 161-169. doi:10.1016/S0378-7796(96)01114-5 [19] R. L. Sullivan, “Power System Planning,” McGraw-Hill International Book Company, New York, 1997. |