

Paper Menu >>
Journal Menu >>
 Energy and Power En gi neering, 2011, 3, 181-189 doi:10.4236/epe.2011.32023 Published Online May 2011 (http://www.SciRP.org/journal/epe) Copyright © 2011 SciRes. EPE Investigation on Numerical Modeling of Water Vapour Condensation from a Flue Gas with High CO2 Content Hamid Nabati School of Sustainable Development of Society and Technology, Mälardalen University, Västerås, Sweden E-mail: [email protected] Received February 2, 2011; revised April 7, 2011; accepted April 11, 2011 Abstract In this paper, condensation of water vapor from a mixture of CO2/H2O is studied numerically. To simplify the study and focus on the physical model, a simple vertical plate was chosen. Two condensation models are developed and numerical approach is considered to implement these models. The main objective in the cur- rent paper was to study the capability of numerical modeling in prediction of complex process. Results showed that developed condensation models in combination with numerical approach can predict the trends in condensation behavior of binary mixture very well. Results from this study can be developed further to be used in design of condensers which are suitable for oxy-fuel power plants. Keywords: Condensation, Two Phase Flow, Numerical Modeling, CO2 Capturing, Oxy-Fuel Power Plants 1. Introduction Oxy-fuel power plants are one of the recently promising processes for clean energy production with CO2 captur- ing and condensers for separation of water vapour from flue gas are essential components in these new proposed power plants. As the combustion process in the oxy-fuel power plants is performed with fuel and pure oxygen, the re- sulting flue gas consists mostly of H2O and CO2.The water vapour separation process from the flue gas im- pacts the thermal efficiency of the plant and the opera- tional cost; thus the precise design of such CO2/H2O condenser systems is a vital demand in the industry [1-3]. Currently there are commercialized condensers in the market that most of them are installed for separation of air and water or for condensation of nearly pure water steams and thus far the condensers for separation of wa- ter vapor and CO2 are not off the shelf products yet. Considering the specific characteristics of such condens- ers for application in the CO2/H2O separation, makes them as special process heat exchangers in the industry. Despite of wide referring to this kind of condenser in different proposed Oxy fuel cycles, the required design data are not available yet and there is a demand for more studies to achieve the desired efficiency for CO2 captur- ing and steam separation and basic studies on condensa- tion of water vapour from a flue gas with high CO2 con- centration could provide such useful technical data for designers. Naturally, condensation happens whenever the vapour temperature is decreased by cooling until it reaches the saturation temperature Tsat at the operational pressure and usually this takes place when vapor is brought into con- tact with a solid surface whose temperature Ts is less than saturation temperature of the vapor. However condensa- tion can also occur in a gas or on the interface of a liquid and a gas. When condensation occurs in a gas, the liquid droplets usually suspend in the gas. As it is more com- mon in the industry to operate and control surface con- tacts condensers and also based on what is shown for oxy-fuel CO2 capturing, in the current study the conden- sation on solid surfaces with focus on film condensation is considered. It is a common practice in the literatures to accept film condensation in heat exchanger design [4-6]. In this process, the condensate forms a liquid film is formed on the solid surface. This liquid film slips down under the influence of gravity. The thickness of the liquid film in- creases gradually with more vapors condensation on the film in the flow direction. Liquid covers the surface and eventually a liquid film takes place between vapour and solid surface. This liquid film resists against heat transfer flow. It means that released heat from vapour condensa- 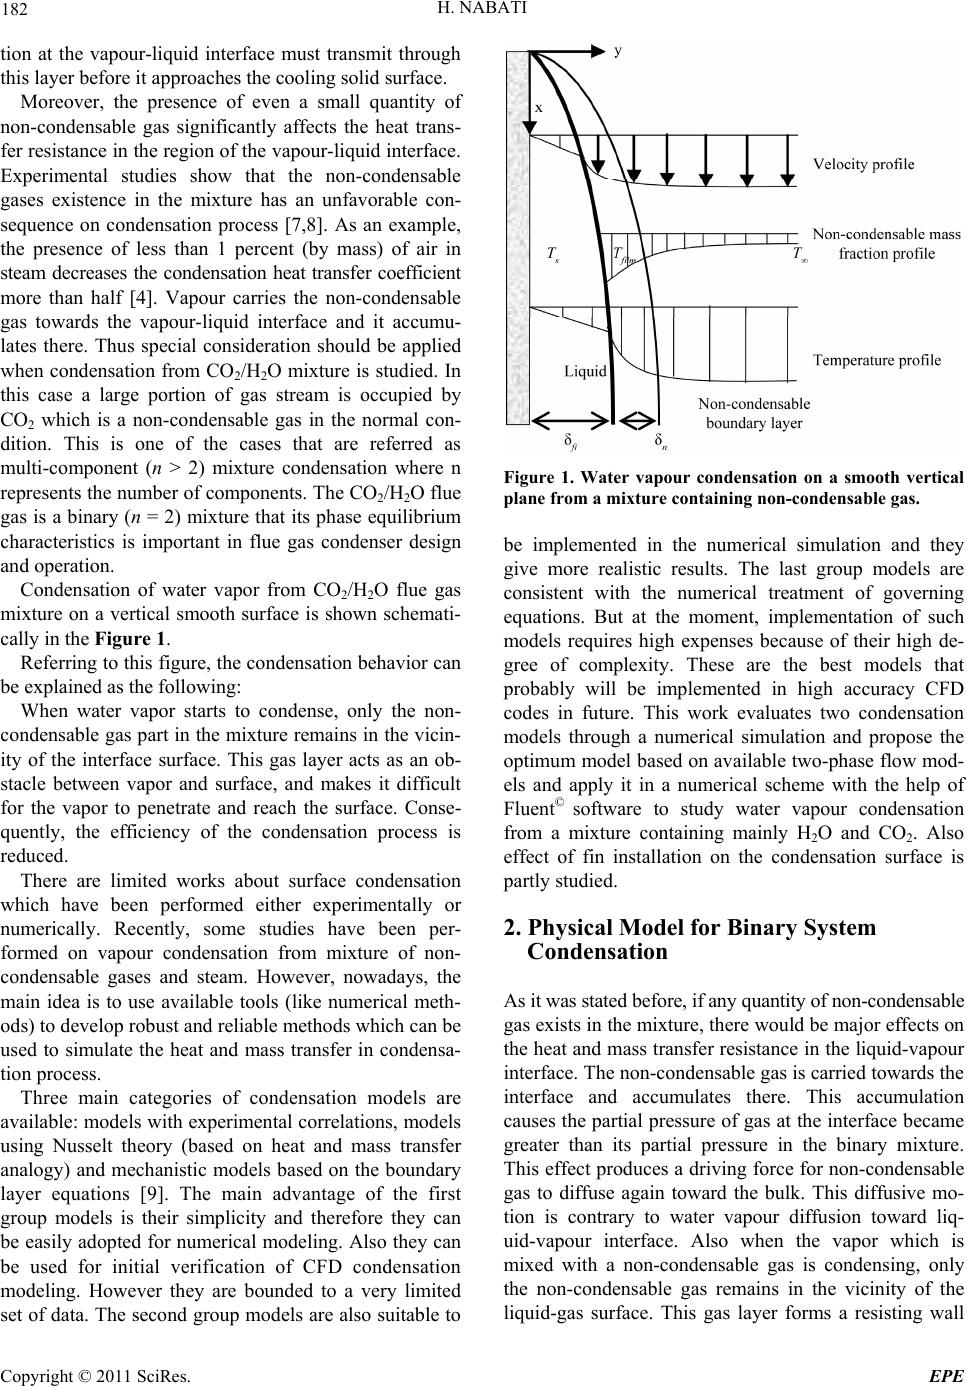 182 H. NABATI tion at the vapour-liquid interface must transmit through this layer before it approaches the cooling solid surface. Moreover, the presence of even a small quantity of non-condensable gas significantly affects the heat trans- fer resistance in the region of the vapour-liquid interface. Experimental studies show that the non-condensable gases existence in the mixture has an unfavorable con- sequence on condensation process [7,8]. As an example, the presence of less than 1 percent (by mass) of air in steam decreases the condensation heat transfer coefficient more than half [4]. Vapour carries the non-condensable gas towards the vapour-liquid interface and it accumu- lates there. Thus special consideration should be applied when condensation from CO2/H2O mixture is studied. In this case a large portion of gas stream is occupied by CO2 which is a non-condensable gas in the normal con- dition. This is one of the cases that are referred as multi-component (n > 2) mixture condensation where n represents the number of components. The CO2/H2O flue gas is a binary (n = 2) mixture that its phase equilibrium characteristics is important in flue gas condenser design and operation. Condensation of water vapor from CO2/H2O flue gas mixture on a vertical smooth surface is shown schemati- cally in the Figure 1. Referring to this figure, the condensation behavior can be explained as the following: When water vapor starts to condense, only the non- condensable gas part in the mixture remains in the vicin- ity of the interface surface. This gas layer acts as an ob- stacle between vapor and surface, and makes it difficult for the vapor to penetrate and reach the surface. Conse- quently, the efficiency of the condensation process is reduced. There are limited works about surface condensation which have been performed either experimentally or numerically. Recently, some studies have been per- formed on vapour condensation from mixture of non- condensable gases and steam. However, nowadays, the main idea is to use available tools (like numerical meth- ods) to develop robust and reliable methods which can be used to simulate the heat and mass transfer in condensa- tion process. Three main categories of condensation models are available: models with experimental correlations, models using Nusselt theory (based on heat and mass transfer analogy) and mechanistic models based on the boundary layer equations [9]. The main advantage of the first group models is their simplicity and therefore they can be easily adopted for numerical modeling. Also they can be used for initial verification of CFD condensation modeling. However they are bounded to a very limited set of data. The second group models are also suitable to Figure 1. Water vapour condensation on a smooth vertical plane from a mixture containing non-condensa ble gas. be implemented in the numerical simulation and they give more realistic results. The last group models are consistent with the numerical treatment of governing equations. But at the moment, implementation of such models requires high expenses because of their high de- gree of complexity. These are the best models that probably will be implemented in high accuracy CFD codes in future. This work evaluates two condensation models through a numerical simulation and propose the optimum model based on available two-phase flow mod- els and apply it in a numerical scheme with the help of Fluent© software to study water vapour condensation from a mixture containing mainly H2O and CO2. Also effect of fin installation on the condensation surface is partly studied. 2. Physical Model for Binary System Condensation As it was stated before, if any quantity of non-condensable gas exists in the mixture, there would be major effects on the heat and mass transfer resistance in the liquid-vapour interface. The non-condensable gas is carried towards the interface and accumulates there. This accumulation causes the partial pressure of gas at the interface became greater than its partial pressure in the binary mixture. This effect produces a driving force for non-condensable gas to diffuse again toward the bulk. This diffusive mo- tion is contrary to water vapour diffusion toward liq- uid-vapour interface. Also when the vapor which is mixed with a non-condensable gas is condensing, only the non-condensable gas remains in the vicinity of the liquid-gas surface. This gas layer forms a resisting wall Copyright © 2011 SciRes. EPE  H. NABATI 183 between condensing liquid and vapor and makes it hard for the vapor to contact with the surface. Therefore vapor should diffuse through this layer first before reaching the surface. These effects reduce the condensation process efficiency. These conditions are worse for the CO2/H2O condenser, where the concentration of CO2 is much higher than water vapour. The accumulation of CO2 in the vicinity of condensation layer makes a barrier to re- maining water vapour in the flue gas stream and de- creases the effectiveness of condensation process. In the mixture of CO2/H2O, the partial pressure PA, of component H2O is that pressure which would be exerted by H2O alone in the mixture appropriate to the concen- tration of H2O in the flue gas at the same temperature. Here A represents H2O to simplify the proceeding equa- tions. Since P = ΣPA, then the partial pressure, PA, is proportional to the mole fraction of H2O in the vapour phase. s at AAA PxP (1) The most known correlation that is used to relate the partial pressure in the vapour phase to the concentration of component A in the liquid phase is the Rault’s law. This law states that the partial pressure PA is related to the mole fraction xA and saturation pressure of pure component A at the same temperature: s at AAA PxP (2) where xA represents mole fraction of component A in the liquid phase. During mass transfer process, water vapour travels from high concentration region to region where it has a low concentration. Just as thermal energy diffuses from region of high temperature to low temperature re- gion (following the temperature gradient), the mass transfer follows the concentration gradient. Fick’s law of diffusion represents that diffusion mass flux of any spe- cies in a multi-components stream has direct proportion to the species concentration gradient. This law can be expressed as: i iim m Dm J (3) i J is the total mass flux of species i and gets the unit of (kg/m2·s). Effective diffusivity, Dim is an indicator of diffusion intensity of species i into a mixture. Diffusivity coefficient is a function of composition, temperature and pressure and for gases is typically on the order of 10–5 near the room temperature. The Chapman-Enskog corre- lation is one of the known formulas which is based on kinetic theory and takes into account all the molecular effects precisely [9]. The correlation is: 3 72 2 1.8583 1011 AB AB AB D T D M M p (4) AB is the average molecular diameter in Å and is equal to ( A + B)/2. MA and MB are molecular components A and B. D can be obtained from cor l weight of available reations in literatures [4,10,11]. Table 1 shows the required data for diffusivity calculation. Considering the steady state behavior at the all loca- tion in the flow field and referring to Figure 1, the en- ergy balance implies that the heat transfer from the flue gas to the condensation film plus the latent heat of con- densation should be equal to the heat which is passing through the condensation film. As the temperature level is the place that condenser is going to be used is some- thing about 100˚C (more or less), the radiation from flue gas to the film can be neglected. The first attempt to analyze the film condensation process was done by Nusselt with some simplifying as- sumptions like laminar film flow, stationary vapour and conduction heat transfer trough the film. Based on the analysis, he proposed the following correlation for the mean value of heat transfer coefficient over the whole vertical surface [12]: 1 34 0.943 ff gfgf film ghk h f filmS TT L A number of attempts have made to improve the Nus- selt theory and modify it to suit the real pro condensate in a real condensation process always is co (5) cess. The oled down further to a temperature which is less than saturation temperature and higher than the cooling wall temperature. Rohsenow [13] showed that this effect can be accounted by using modified latent heat defined as: For the water vapour content in the flue gas, there is superheat state and the vapor should be cooled down to Tsat before the condensation occurs. In this case the modified latent heat can be written as: , 0.63 1 , P film filmS fg fg fg CTT hh h Ps at fg CTT h (7) Considering the definition for modified late convective heat transfer coefficient through the con- densing film (hfilm) can be written as [4]: M (kg/kmol) nt heat, the Table 1. Required data for diffusivity calculation [10]. Species /kB (K) (Å) Air 78.6 3.711 28.96 HO 363 2.655 18.02 2 CO2 195.2 3.941 44.01 Copyright © 2011 SciRes. EPE  184 H. NABATI 1 4 3 0.94 ff fgf ilm f k TTL (8) All the liquid properties should be calculated at aver- age temperature (Tsat + Ts)/2. The heat transfer from flue gas to interface tween flue gas and condensing film consists of two parts: fir 3gh g f h s at S layer be- stly, heat which passes the diffusion layer directly and reach to the interface (sensible heat) and secondly the latent heat of the vapour which reaches the interface and condenses. With an assumption that the liquid-vapor interface has a temperature between saturation and sur- face temperatures and also considering the constant temperature for the liquid film interface, the energy bal- ance equation is written as following: or totfilmconv condens totsff s f cond f hT T hTT qqq q hTThTT (9) And condensation film flow rate is given by: condfgfsfs mhhATT (10) sfer coef- fic der- ing the mass transfer and is calculated automatically using wall functions. So it is he 2] and is simple to be implemented in the numerical our atmos- here using the saturation condition is calculated and h∞ in (9) represents the convective heat tran ient between flue gas and condensation film consi in the CFD code not explained re and details can be found in the user guide [13]. The last coefficient in (9) is the most challenging part in condensation modeling. In the current paper, two differ- ent condensation models are implemented and compared together which are explained in the following sections. 2.1. Model I: Based on Nusselt Theory The first condensation model is based on Nusselt theory [1 code Firstly, the heat transfer in a pure vap p then effect of non-condensable gas is introduced by a degradation factor. The following formula is derived with this methodology: 1 34 1 ff gfg condncsat f f ghk qf TT TTL (11) 23 1 0.9464.9894.135 1 1 15.48 ncncnc nc nc nc f yy y y y (12) The condensation flow rate is calculated using the modified latent heat, f g h : cond fgcond mhq (13) 2.2. Model II: Based on Diffusion Boundary Layer Theory nsfoefficient (h) is given by following correlation [4]: This model is originally developed by Peterson [15]. The condensation heat traer ccondens 22 ,ABfgp gv L cond Sh hLR TT vf DhC M (14) ShL is the average Sherwood number for the whole condensing plate which is given by [4]: 1 1 3 2 0.664Sh R LL e Sc (15) issteam and non-condensable gas conc the vicinity of interface and defined as [4]: entration in , , , 1 ln 1 nc mean nc int nc mean x x x ,ln erface steam meannc xx x (16) 3.1. Governing Equations The governing equations for conversation of mass, mo- mentum and energy given by [17] can be formulated by sing the tensor notation. The flue gas mixture and con- Newtonian fluids. The ployed to solve the proc- , momentum and conti- ies are solved in a struc- ,mean , nc interface 3. Numerical Approach u densation layer are considered as luent© CFD code has been emF ess governing equations. Energy uity equations for each specn s atf The degradation factor is calculated based on experi- mental works and here the following correlation is im- plemented [15]: tured or unstructured mesh using finite volume method. Most of the following explanations on governing equa- tions have been derived from available literatures [14], [17]. 3.1.1. Continuity Equa ti o n If conservation equation is applied to a species and then rearranged in a general form, the following equation is obtained: Copyright © 2011 SciRes. EPE 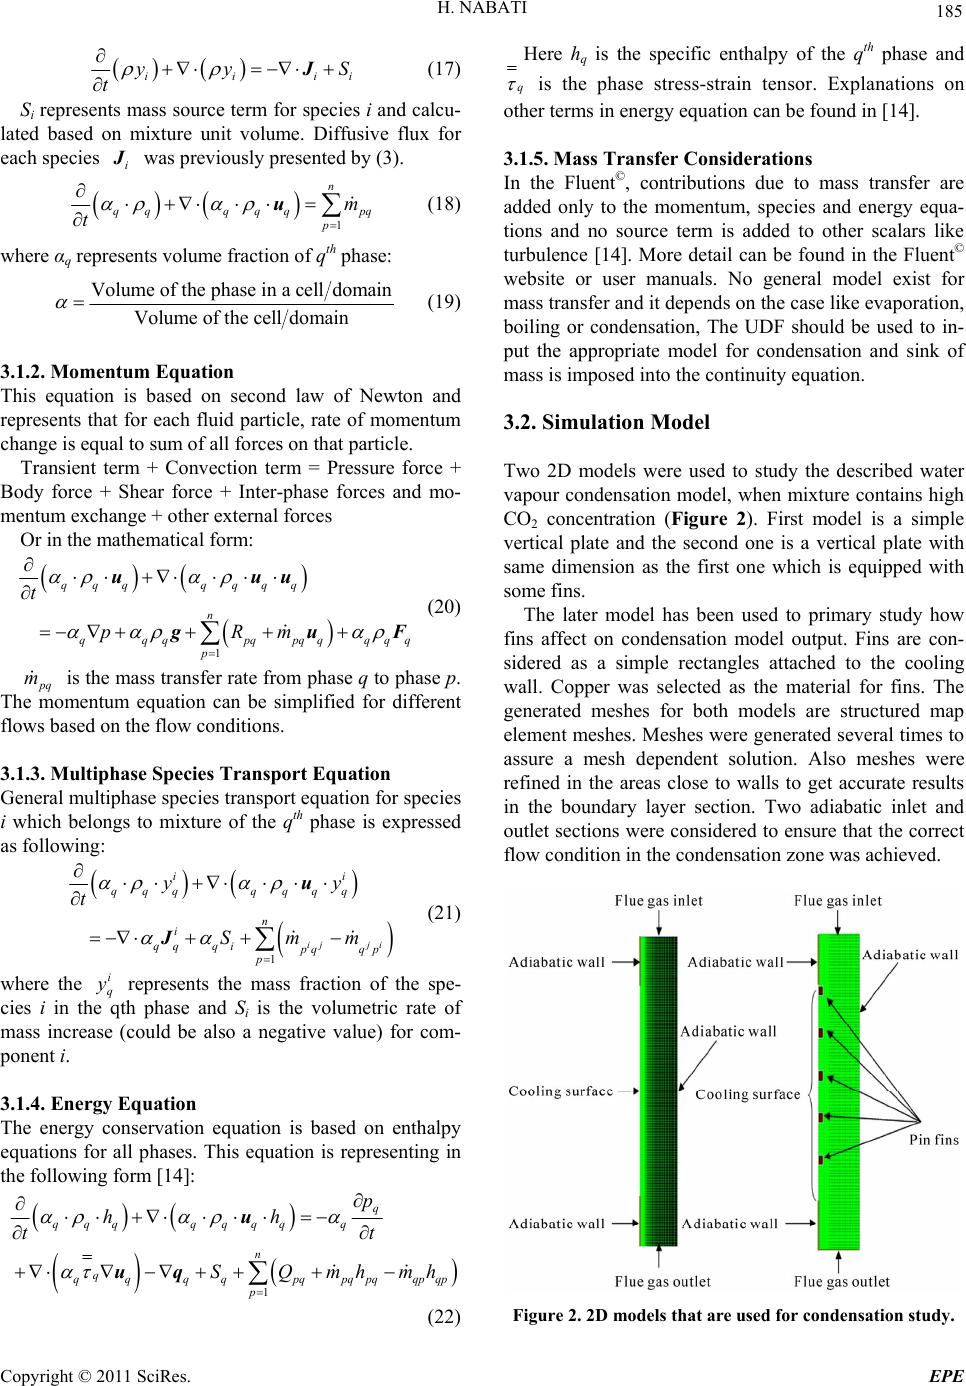 H. NABATI 185 iiii yy S t J (17) Si represents mass source term for species i and calcu- volume. Diffusive flux for lated based on mixture unit each species i J was previously presented by (3). n qqqqqpq m t u (18) 1 p where αq represents volume fraction of qth phase: Volume of the phase in a celldomain Volume of the celldomain (19) 3.1.2. Moment um Equation This equation is based on second law of N represents that for each fluid particle, rate of momentum . Transient term + Convection term = Pressure force + Body force + Shear force + Inter-phase forces mentum exchange + other external forces Or in the mathematical form: ewton and change is equal to sum of all forces on that particle and mo- q qqqqqq n qqq pqpqqqqq t pRm uuu guF (20) 1p p q m is the mass transfer rate from phase q to phase p. The momentum equation can be simplified for different flons. 3.1.3. Multiphase Species Transport Equation General multiphase species transport equation for s i which belongs to mixture of the qth phase is expressed as following: ws based on the flow conditio pecies ii qqq qqqq n i yy t u (21) 1pq q p p ij ji qq qi Sm m J 3.1.4. Energy Equation The energy conservation equation is based on enthalpy equations for all phases. This equation is representing in g where the i q y represents the mass fraction of the spe- cies i in the qth phase and Si is the volumetric rate of mass increase (could be also a negative value) for com- ponent i. the followinform [14]: 1 n qqpqpqpqqpqp p SQ mhmh uq (22) q qq qqqqq q p hh tt u qq q Here hq is the specific enthalpy of the qth phase and q is the phase stress-strain tensor. Explanations on other terms in energy equ ation can be found in [14]. 3.1.5. Mass Transfer Consid er ations In the Fluent©, contributions due to mass transfer are added only to the momentum, species and energy equa- tions and no source term is added to other scalars tu w ma in- ut the appropriate model for condensation and sink of tion. The later model has been used to primary study how model output. Fins are con- idered as a simple rectangles attached to the cooling dary layer section. Two adiabatic inlet and ou like © rbulence [14]. More detail can be found in the Fluent ebsite or user manuals. No general model exist for ss transfer and it depends on the case like evaporation, boiling or condensation, The UDF should be used to p mass is imposed into the continuity equa 3.2. Simulation Model Two 2D models were used to study the described water vapour condensation model, when mixture contains high CO2 concentration (Figure 2). First model is a simple vertical plate and the second one is a vertical plate with same dimension as the first one which is equipped with some fins. fins affect on condensation s wall. Copper was selected as the material for fins. The generated meshes for both models are structured map element meshes. Meshes were generated several times to assure a mesh dependent solution. Also meshes were refined in the areas close to walls to get accurate results in the boun tlet sections were considered to ensure that the correct flow condition in the condensation zone was achieved. Figure 2. 2D models that are used for condensation study. Copyright © 2011 SciRes. EPE 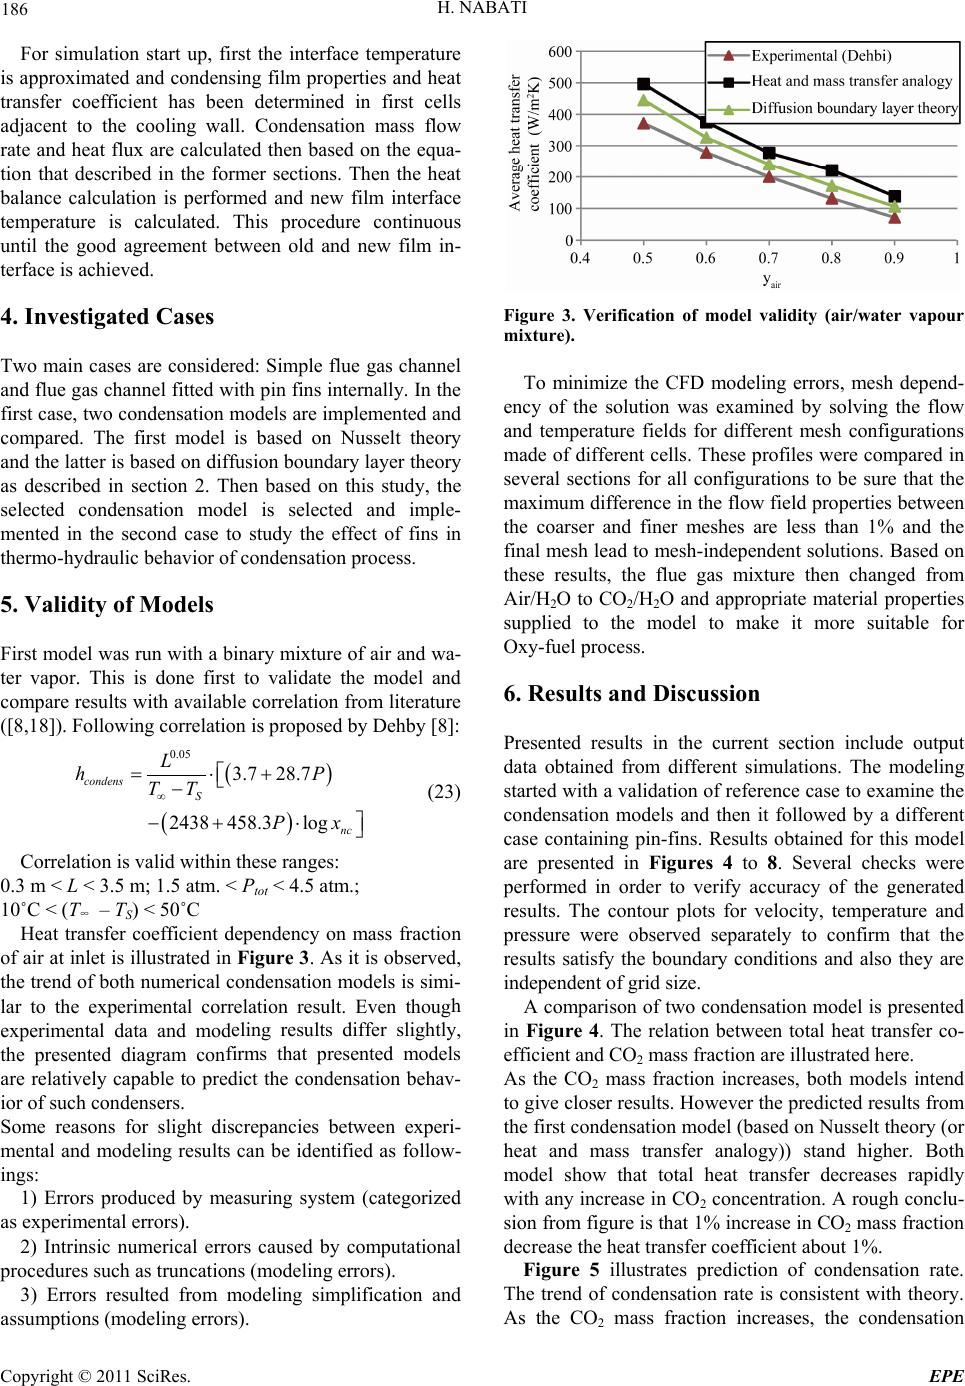 H. NABATI 186 For simulation start up, first the interface temperature is approximated and condensing film properties and heat transfer coefficient has been determined in first cells adjacent to the cooling wall. Condensation mass flow rate and heat flux are calculated then based on the equa- tion that described in the former sections. Then the heat balance calculation is performed and new film interface temperature is calculated. This procedure continuous until the good agreement between old and new film in- terface is achieved. 4. Investigated Cases Two main cases are considered: Simple flue gas channel and flue gas channel fitted with pin fins internally. In the first case, two condensation models are implemented and compared. The first model is based on Nusselt theor a as available correlation from literature 8,18]). Following correlation is proposed by Dehby [8]: y nd the latter is based on diffusion boundary layer theory described in section 2. Then based on this study, the selected condensation model is selected and imple- mented in the second case to study the effect of fins in thermo-hydraulic behavior of condensation process. 5. Validity of Models First model was run with a binary mixture of air and wa- ter vapor. This is done first to validate the model and compare results with ([ 2438 458.3log S nc TT Px (23) Correlation is valid within these ranges: 0.3 m < L < 3.5 m; 1.5 atm. < Ptot < 4.5 atm.; 10˚C < (T∞ – TS) < 50˚C Heat transfer coefficient dependency on mass fraction of air at inlet is illustrated in Figure 3. As it is observed, the trend of both numerical condensation models is simi- ar to the experimental correlation result. Even thoug 0.05 L3.7 28.7 condens hP h eling results differ slightly, firms that presented models 1) Errors produced by measuring system (categorized as experimental errors). 2) Intrinsic numerical errors caused by computational procedures such as truncations (modeling errors). fication and assumptions (modeling errors). l experimental data and mod he presented diagram cont are relatively capable to predict the condensation behav- ior of such condensers. Some reasons for slight discrepancies between experi- mental and modeling results can be identified as follow- ings: 3) Errors resulted from modeling simpli Figure 3. Verification of model validity (air/water vapour mixture). To minimize the CFD modeling errors, mesh depend- ency of the solution was examined by solving the flow and temperature fields for different mesh configurations made of different cells. These profiles were compared in several sections for all configurations to be sure that the maximum difference in the flow field properties between the coarser and finer meshes are less than 1% and the final mesh lead to mesh-independent solutions. Based on these results, the flue gas mixture then changed from Air/H2O to CO2/H2O and appropriate material properties supplied to the model to make it more suitable for Oxy-fuel process. 6. Results and Discussion Presented results in the current section include outpu h a validation of reference case to examine the ondensation models and then it followed by a different ca wever the predicted results from e first condensation model (based on Nusselt theory (or )) stand higher. Both odel show that total heat transfer decreases rapidly t data obtained from different simulations. The modeling started wit c se containing pin-fins. Results obtained for this model are presented in Figures 4 to 8. Several checks were performed in order to verify accuracy of the generated results. The contour plots for velocity, temperature and pressure were observed separately to confirm that the results satisfy the boundary conditions and also they are independent of grid size. A comparison of two condensation model is presented in Figure 4. The relation between total heat transfer co- efficient and CO2 mass fraction are illustrated here. As the CO2 mass fraction increases, both models intend to give closer results. Ho th heat and mass transfer analogy m with any increase in CO2 concentration. A rough conclu- sion from figure is that 1% increase in CO2 mass fraction decrease the heat transfer coefficient about 1%. Figure 5 illustrates prediction of condensation rate. The trend of condensation rate is consistent with theory. As the CO2 mass fraction increases, the condensation Copyright © 2011 SciRes. EPE 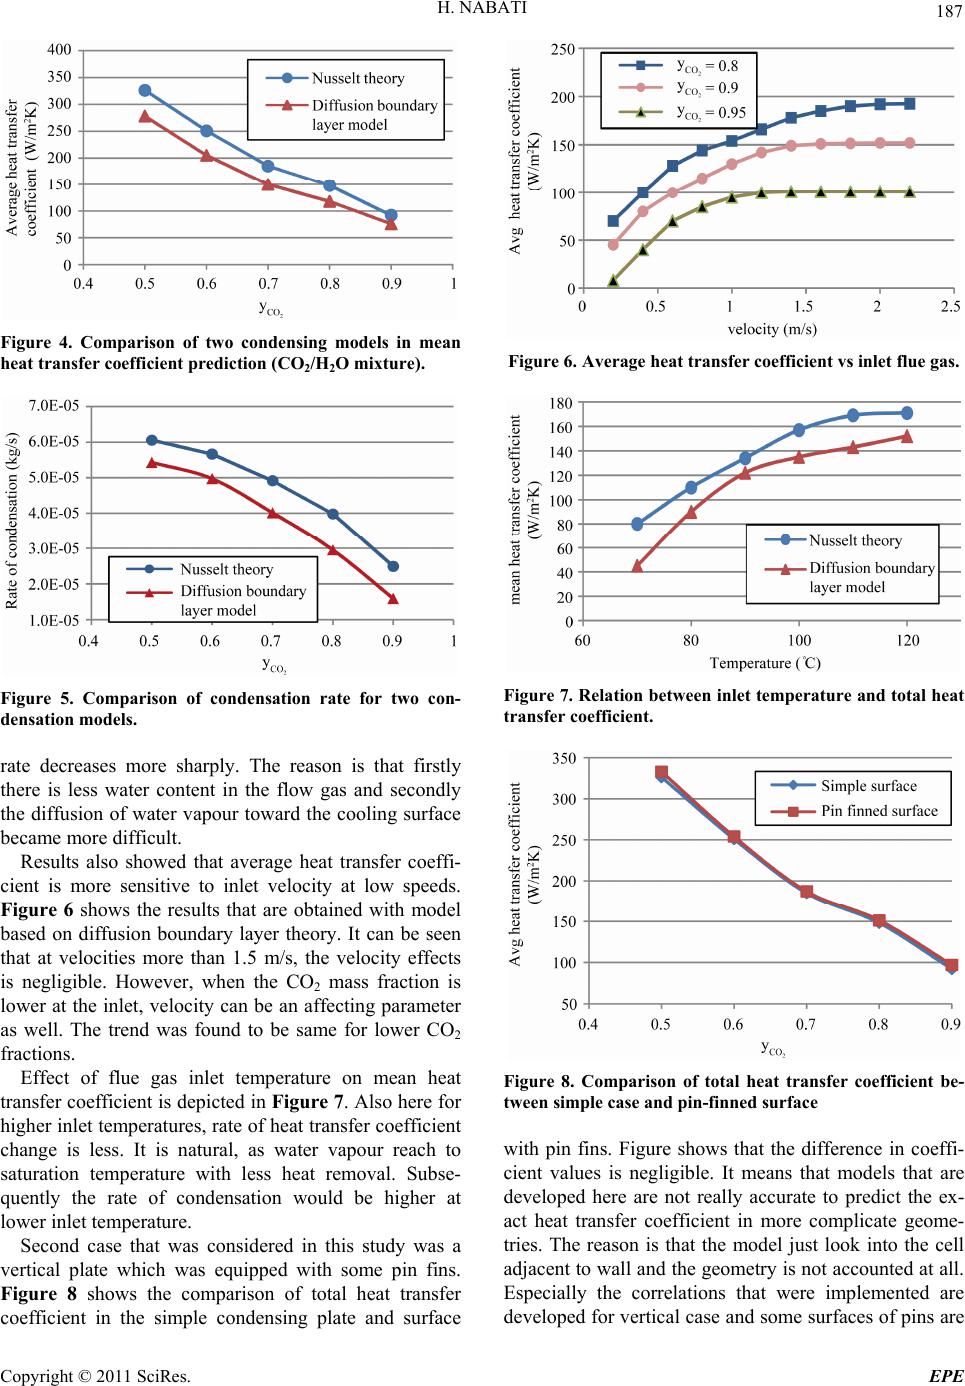 H. NABATI 187 Figure 4. Comparison of two condensing models in mean heat transfer coefficient prediction (CO2/H2O mixture). Figure 5. Comparison of condensation rate for two con- densation models. rate decreases more sharply. The reason is that firstl ecame more difficult. Results also showed that average heat transfer coeffi- cient is more sensitive to inlet velocity at low speeds. Figure 6 shows the results that are obtained with model based on diffusion boundary layer theory. It can be seen that at velocities more than 1.5 m/s, the velocity effects is negligible. However, when the CO2 mass fraction is lower at the inlet, velocity can be an affecting parameter as well. The trend was found to be same for lower CO2 fractions. Effect of flue gas inlet temperature on mean heat transfer coefficient is depicted in Figure 7. Also here for higher inlet temperatures, rate of heat transfer coefficien ature with less heat removal. Subse- uently the rate of condensation would be higher at mparison of total heat transfer co y there is less water content in the flow gas and secondly the diffusion of water vapour toward the cooling surface b t change is less. It is natural, as water vapour reach to saturation temper q lower inlet temperature. Second case that was considered in this study was a vertical plate which was equipped with some pin fins. Figure 8 shows the co efficient in the simple condensing plate and surface Figure 6. Average heat transfer coefficient vs inlet flue gas. Figure 7. Relation between inlet temperature and total heat transfer coefficient. Figure 8. Comparison of total heat transfer coefficient be- tween simple case and pin-finn e d surface ible. It means that models that are eveloped here are not really accurate to predict the ex- act heat transfer coefficient in more complicate geome- tries. The reason is that the model just look into the cell adjacent to wall and the geometry is not accounted at all. Especially the correlations that were implemented are developed for vertical case and some surfaces of pins are with pin fins. Figure shows that the difference in coeffi- cient values is neglig d Copyright © 2011 SciRes. EPE 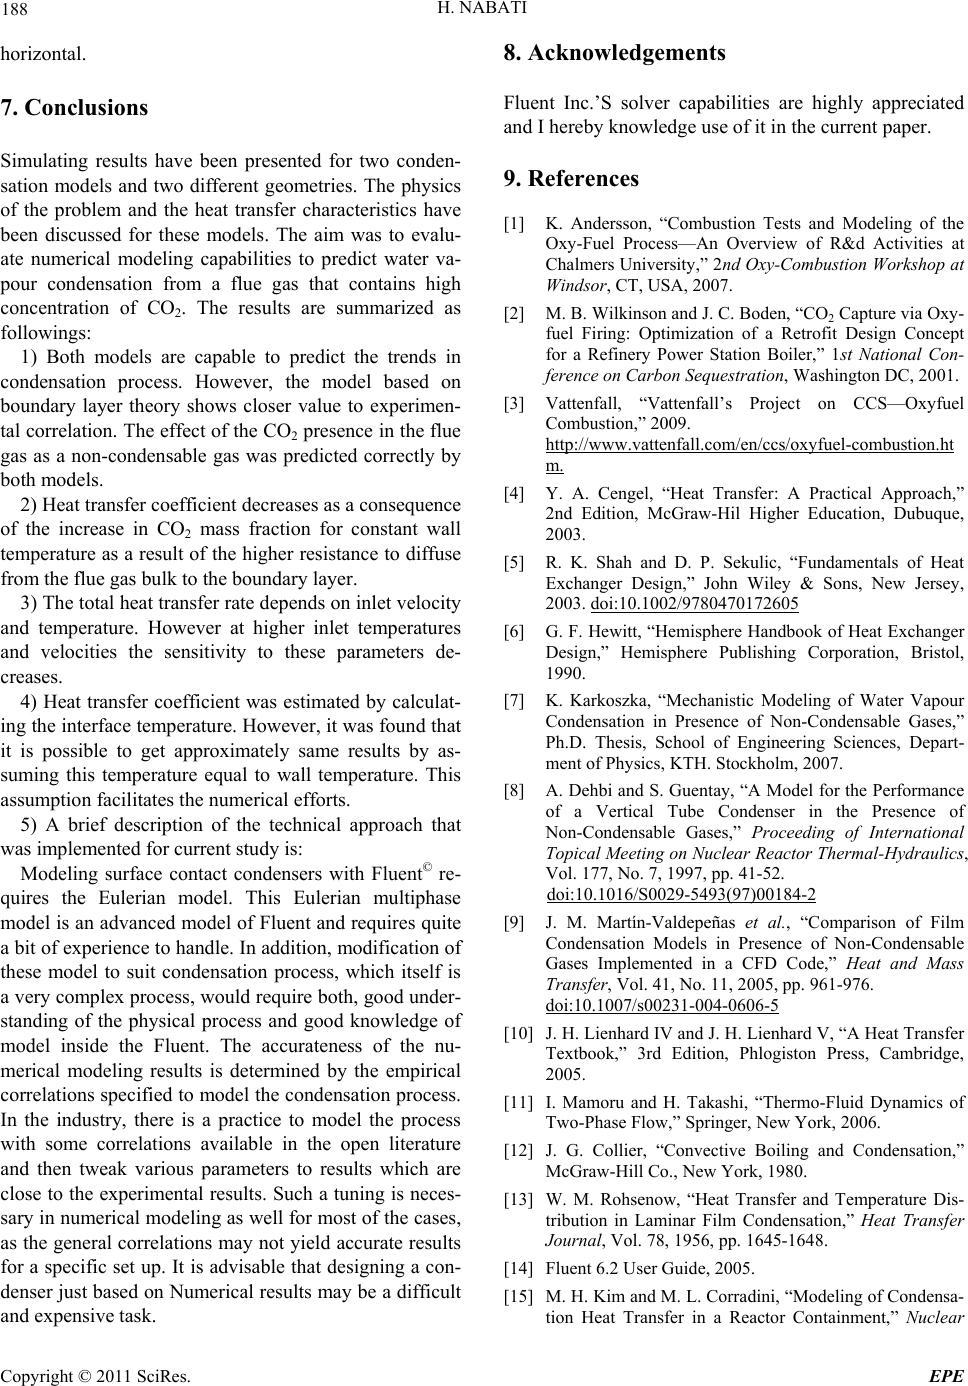 H. NABATI 188 horizontal. 7. Conclusions Simulating results have been presented for two conden- sation models and two different geometries. The physics of the problem and the heat transfer characteristics have been discussed for these models. The aim was to evalu- ate numerical modeling capabilities to predict water va- pour condensation from a flue gas that contains high concentration of CO2. The results are summarized as followings: e to experimen- ture. However at higher inlet temperatures nd velocities the sensitivity to these parameters de- oefficient was estimated by calculat- ppreciated an 9. 1) Both models are capable to predict the trends i condensation process. However, the model based on oundary layer theory shows closer valu n b tal correlation. The effect of the CO2 presence in the flue gas as a non-condensable gas was predicted correctly by both models. 2) Heat transfer coefficient decreases as a consequence of the increase in CO2 mass fraction for constant wall temperature as a result of the higher resistance to diffuse from the flue gas bulk to the boundary layer. 3) The total heat transfer rate depends on inlet velocity and tempera a creases. 4) Heat transfer c ing the interface temperature. However, it was found that it is possible to get approximately same results by as- suming this temperature equal to wall temperature. This assumption facilitates the numerical efforts. 5) A brief description of the technical approach that was implemented for current study is: Modeling surface contact condensers with Fluent© re- quires the Eulerian model. This Eulerian multiphase model is an advanced model of Fluent and requires quite a bit of experience to handle. In addition, modification of these model to suit condensation process, which itself is a very complex process, would require both, good under- standing of the physical process and good knowledge of model inside the Fluent. The accurateness of the nu- merical modeling results is determined by the empirical correlations specified to model the condensation process. In the industry, there is a practice to model the process with some correlations available in the open literature and then tweak various parameters to results which are close to the experimental results. Such a tuning is neces- sary in numerical modeling as well for most of the cases, as the general correlations may not yield accurate results for a specific set up. It is advisable that designing a con- denser just based on Numerical results may be a difficult and expensive task. 8. Acknowledgements Fluent Inc.’S solver capabilities are highly a d I hereby knowledge use of it in the current paper. References [1] K. Andersson, “Combustion Tests and Modeling of the Oxy-Fuel Process—An Overview of R&d Activities at Chalmers University,” 2nd Oxy-Combustion Workshop at Windsor, CT, USA, 2007. [2] M. B. Wilkinson and J. C. Boden, “CO2 Capture via Oxy- fuel Firing: Optimization of a Retrofit Design Concept for a Refinery Power Station Boiler,” 1st National Con- ference on Carbon Sequestration, Washington DC, 2001. [3] Vattenfall, “Vattenfall’s Project on CCS—Oxyfuel Combustion,” 2009. http://www.vattenfall.com/en/ccs/oxyfuel-combustion.ht m. [4] Y. A. Cengel, “Heat Transfer: A Practical Approach,” 2nd Edition, McGraw-Hil Higher Education, Dubuque, 2003. [5] R. K. Shah and D. P. Sekulic, “Fundamentals of Heat Exchanger Design,” John Wiley & Sons, New Jersey, 2003. doi:10.1002/9780470172605 [6] G. F. Hewitt, “Hemisphere Design,” Hemisphere Pu Handbook of Heat Exchanger blishing Corporation, Bristol, 1990. s,” Ph.D. Thesis, School of Engineering Sciences, Depart- s, KTH. Stockholm, 2007. ] A. Dehbi and S. Guentay, “A Model for the Performance -52. [7] K. Karkoszka, “Mechanistic Modeling of Water Vapour Condensation in Presence of Non-Condensable Gase ment of Physic [8 of a Vertical Tube Condenser in the Presence of Non-Condensable Gases,” Proceeding of International Topical Meeting on Nuclear Reactor Thermal-Hydraulics, Vol. 177, No. 7, 1997, pp. 41 doi:10.1016/S0029-5493(97)00184-2 [9] J. M. Martín-Valdepeñas et al., “Comparison of Film Condensation Models in Presence of Non-Condensable Gases Implemented in a CFD Code,” Heat and Mass Transfer, Vol. 41, No. 11, 2005, pp. 961-976. doi:10.1007/s00231-004-0606-5 [10] J. H. Lienhard IV and J. H. Lienhard V, “A Heat Transfe Tex r tbook,” 3rd Edition, Phlogiston Press, Cambridge, hase Flow,” Springer, New York, 2006. nd Temperature Dis- 6.2 User Guide, 2005. 2005. [11] I. Mamoru and H. Takashi, “Thermo-Fluid Dynamics of Two-P [12] J. G. Collier, “Convective Boiling and Condensation,” McGraw-Hill Co., New York, 1980. [13] W. M. Rohsenow, “Heat Transfer a tribution in Laminar Film Condensation,” Heat Transfer Journal, Vol. 78, 1956, pp. 1645-1648. [14] Fluent [15] M. H. Kim and M. L. Corradini, “Modeling of Condensa- tion Heat Transfer in a Reactor Containment,” Nuclear Copyright © 2011 SciRes. EPE  H. NABATI Copyright © 2011 SciRes. EPE 189 -5 Engineering and Design, Vol. 118, No. 2, 1990, pp. 193-212. doi:10.1016/0029-5493(90)90057 [16] P. F. Peterson, V. E. Schrock and T. Kageyama, “Diffu- sion Layer Theory for Turbulent Vapor Condensation with Non-Condensable Gases,” Journal of Heat Transfer, Vol. 115, No. 4, 1992, pp. 998-1003. doi:10.1115/1.2911397 [17] H. Versteeg and W. Malalasekra, “An Introduction ion, New Jersey, omenclature - surface area [m2] p - specific heat [JkgK–1] - diameter [m] - effective mass diffusivity [m2·s–1] - external force vector - acceleration of gravity [m.s–2] - heat transfer coefficient [W·m2·K–1] - specific enthalpy in energy equation [j·kg–1] - evaporation latent heat [J·kg–1] to Computational Fluid Dynamics: The Finite Volume Method,” 2nd Edition, Pearson Educat 2007. [18] A. A. Dehbi, M. W. Golay and M. S. Kazimi, “Conden- sation Experiments in Steam-Air Mixtures under Turbu- lent Natural Convection,” National Conference of Heat Transfer, Vol. 87, No. 283, 1991, pp. 19-28. N A C d D F g h h hfg f g h - modified latent heat of evaporation (sub- ffect) [J·kg–1] cooling e f g h - modified latent heat of evaporation (sub- g effect) [J·kg–1] ·s–1] –1·K–1] S Sc Sh Greek symbols α - volume fraction - steam and non-condensable gas concentration - dynamicviscosity [Pa·s] - density [kg·m–3] - mean molecular diameter [Å] cooling-superheatin J - total mass flux [kg·m–2 [W.mK - heat conductivity L - length [m] ·mol–1] M - molecular weight [kg –1 m - mass flow rate [kg·s] P - pressure [Pa] Q - intensity of heat exchange between phases –1 [j·s ] R - reaction term in momentum equation - source term in governing equations - Schmidt number (Sc = /( .d)) - Sherwood number T - temperature [K] u - velocity vector se molar fraction x - vapour pha x' - liquid phase molar fraction y - mass fraction - phase stress-strain tensor Subscripts conv. - convection g ase ies erent phases t s bulk cond. - condensation f - liquid phase, film - gas ph i - species i L - dimensional length Mean - average nc - non-condensable spec p,q - representative of diff s - wall condition sa - saturation condition v - vapour tot - total ∞ - flue ga Superscripts ave - averaged i - species |