

Paper Menu >>
Journal Menu >>
 Modern Economy, 2011, 2, 71-76 doi:10.4236/me.2011.22011 Published Online May 2011 (http://www.SciRP.org/journal/me) Copyright © 2011 SciRes. ME Volatility Spillover from Oil to Food and Agricultural Raw Material Markets Muge Kaltalioglu, Ugur Soytas Department of Busine ss Administration, Middle East Technical University, Ankara, Turkey E-mail: [email protected], [email protected] Received January 25, 2011; revised February 24, 2011; accepted February 25, 2011 Abstract The upward movement in oil and food prices in the 2000s has attracted interest in the information transmis- sion mechanism between the two markets. This paper investigates the volatility spillover between oil, food consumption item, and agricultural raw material price indexes for the period January 1980 to April 2008. The results of the Cheung-Ng procedure show that variation in oil prices does not Granger cause the variance in food and agricultural raw material prices. Since there is no volatility spillover from oil markets to food and agricultural raw material markets, investors can benefit from risk diversification. However, there is bi-directional spillover between agricultural raw material and food markets. Keywords: Oil Prices, Food Prices, Agricultural Raw Material Prices, Volatility Spillover 1. Introduction The simultaneous upward trend in world food prices and oil prices in the 2000s has triggered an increased interest on information transmission dynamics between the two markets. As commodity markets are increasingly viewed as alternative investment areas, existence and direction of spillovers must be carefully evaluated by investors. The existence and nature of the link between alternative investments will determine the extent to which investors will be involved in each market for risk management purposes. One conjecture about the recent rise in food prices is that rising energy prices drive the food prices up [1]. This argument is due to the fact that energy is an impor- tant input in agricultural activities. The link between food and energy markets, however, may be more com- plicated than that (Abbott et al. 2008) [2]. There might be feedback mechanisms that result in food prices lead- ing the energy prices. One such mechanism may exist due to the use of some food items in energy generation. Increased demand for energy may be driving the oil prices as well as food prices. Hence, in order to fully understand the link between the two markets a me- thod that allows such dynamic feedbacks is required. In Agricultural Trade Policy Analysis [3] it is stated that from 2005 to 2007 biodiesel production increased by 5.5 million tones. Additionally, Collins [4] put forth that 60% of the increase in maize prices from 2006 to 2008 may be caused from the increase in maize used in etha- nol. One can conjecture that the increased demand for bio-energy results in an increase in food prices and there might be a switch to the traditional fossil fuel alternatives. If this conjecture holds, then one expects to see world food prices leading the oil prices. However, the increase in food prices is not limited to food items that are also used in bio-fuel production. Food consumption item prices are also showing an upward trend. However, to the extent of our knowledge, there are no studies that examine the dynamic link be- tween world oil and food consumption item prices. This paper is probably the first to examine the volatility spill- over between world oil, food, and agricultural raw mate- rial prices. Applying a relatively new methodology that allows us to test causality both ways, we find that there is no volatility spillover from oil prices to food consump- tion item price index or to agricultural raw materials price index. Furthermore, there is no feedback to the oil mar- ket as well. We discover bi-directional Granger causality in variance between the food and agricultural raw mate- rial markets. The results of this study may have important implications for both policy makers and global investors who need to follow the price shocks and transmission mechanisms between alternative investment areas closely. The remaining of the paper evolves as follows. Next section discusses the relevant literature. Third section  M. KALTALIOGLU ET AL. 72 introduces the data and discusses methodological issues. Fourth section presents the empirical findings and the last section concludes. 2. Price Transmissions There is a large literature on information transmission between various commodity markets. For the sake of brevity, we concentrate on the studies related to the food prices and oil prices. Coyle et al. [5] examine the struc- tural changes in the food market and argue that the changes in the food market can also be associated to the production process where food is an input to the system. They find that increased demand for maize used in ethanol production and the increased demand for rapeseed used in biodiesel production are responsible for rising prices (Soaring Food Prices: Facts, Perspectives, Impacts and Actions Required) [6]. Also the USDA’s chief Economist asserts that much of the increase in farm prices of maize and soybeans is due to bio-fuel production [7]. There are a group of studies that focus on transmission between various food markets. Rezitis [8] underlines that both farm and retail prices in Greece have significant effects on each other. Volatility spillover effects are also present between producer and consumer prices. In an- other study that deals solely with food prices, Christian and Rashad [9] examine the increased food prices be- tween 1950 and 2005 and report a decrease in farm value of retail prices. Vavra and Goodwin [10] examine the relation between retail prices and consumer prices of food and discover presence of asymmetric affects of price changes in U.S. They find that with decreasing re- tail prices, consumer prices decline as well. Furthermore, the links between retail and farm prices is not contempo- raneous but with a time lag. In an earlier study, Minten and Kyle [11] emphasize that the increase in the whole- sale prices is significantly transmitted to the retail prices within the same week of the price change in wholesale level. Aksoy and Isik-Dikmelik [12] document that a change in the commodity prices is more significant in countries in which people consume more staples rather than various kinds of foods to extend that consumption of staple food crops affects the household income. They infer that the increase in the staple food crop prices has a significant influence on the household welfare. Since there is no study that addresses the relationship between world consumption food items, agricultural raw materials, and oil prices, we next consider studies on volatility spillover in various commodity markets. In the literature, the return and volatility spillover effects are examined by a variety of methods. Worthington et al. [13] apply MGARCH method to analyze transmission prices and price volatility in Australian electricity spot markets. Fan et al. [14] look for the spillover effect between two markets, WTI (West Texas Intermediate crude oil) and Brent crude oil spot markets. GED-GARCH method is used to estimate the conditional heteroscedasticity. The results point out two-way Granger causality. Spillover effects in energy futures markets have been the subject of many studies as well. Lin and Tamvakis [15], for example, examine the information transmission between two oil markets (NYMEX and IPE). They find that closing prices in NYMEX lead prices in IPE the next morning. However, there is bidirectional spillover when both exchanges are trading simultaneously. Baffes [16] examines the price transmission between crude oil prices and 35 other commodity prices between 1960 and 2005. He states that there is information transmission from crude oil to agricultural commodities. He mentions that as long as the crude oil prices continue to remain high for a certain amount of time the price booms will be higher than the booms experienced before, especially for food commodities, fertilizers and precious metals. This sug- gests a volatility spillover from oil to agricultural mar- kets. Ewing and Thompson [17] argue that a possible explanation for the increase in consumer prices is the increase in crude oil prices. But they also point out that with the in- crease in the industrial production; there is an avowed rise in oil prices. As Askari and Krichene [18] state even if the oil pric- es rise tremendously, change in the demand for com- modities or for oil will be relatively small if the elasticity is low. That is, increasing oil price will not have a sig- nificant influence on demand for food commodities. As world food markets are open to investors and spe- culators, just like the oil markets, the prices in both commodity markets may be governed by similar dynam- ics. Food, oil and other commodity prices have been stu- died extensively in the literature. However, to the extent of our knowledge there aren’t any studies that explicitly examine the volatility link between world food, agricul- tural raw material, and oil prices. This paper is concerned with the spillover effects between agricultural raw mate- rial, food consumption items, and oil prices. In the next section we introduce the data and data sources. 3. Data Characteristics We use monthly data on agricultural raw material spot prices (ARMI), food spot prices (FPI) and oil spot prices (OPI) for the period January-1980 to April-2008. ARMI measures the price changes for timber, cotton, wool, rubber and hides price indices. FPI measures the price changes for fruits, vegetables, meat, poultry, fish, gro- cery food and non-alcoholic beverages. We have chosen the FPI to understand whether variation in world oil prices Copyright © 2011 SciRes. ME 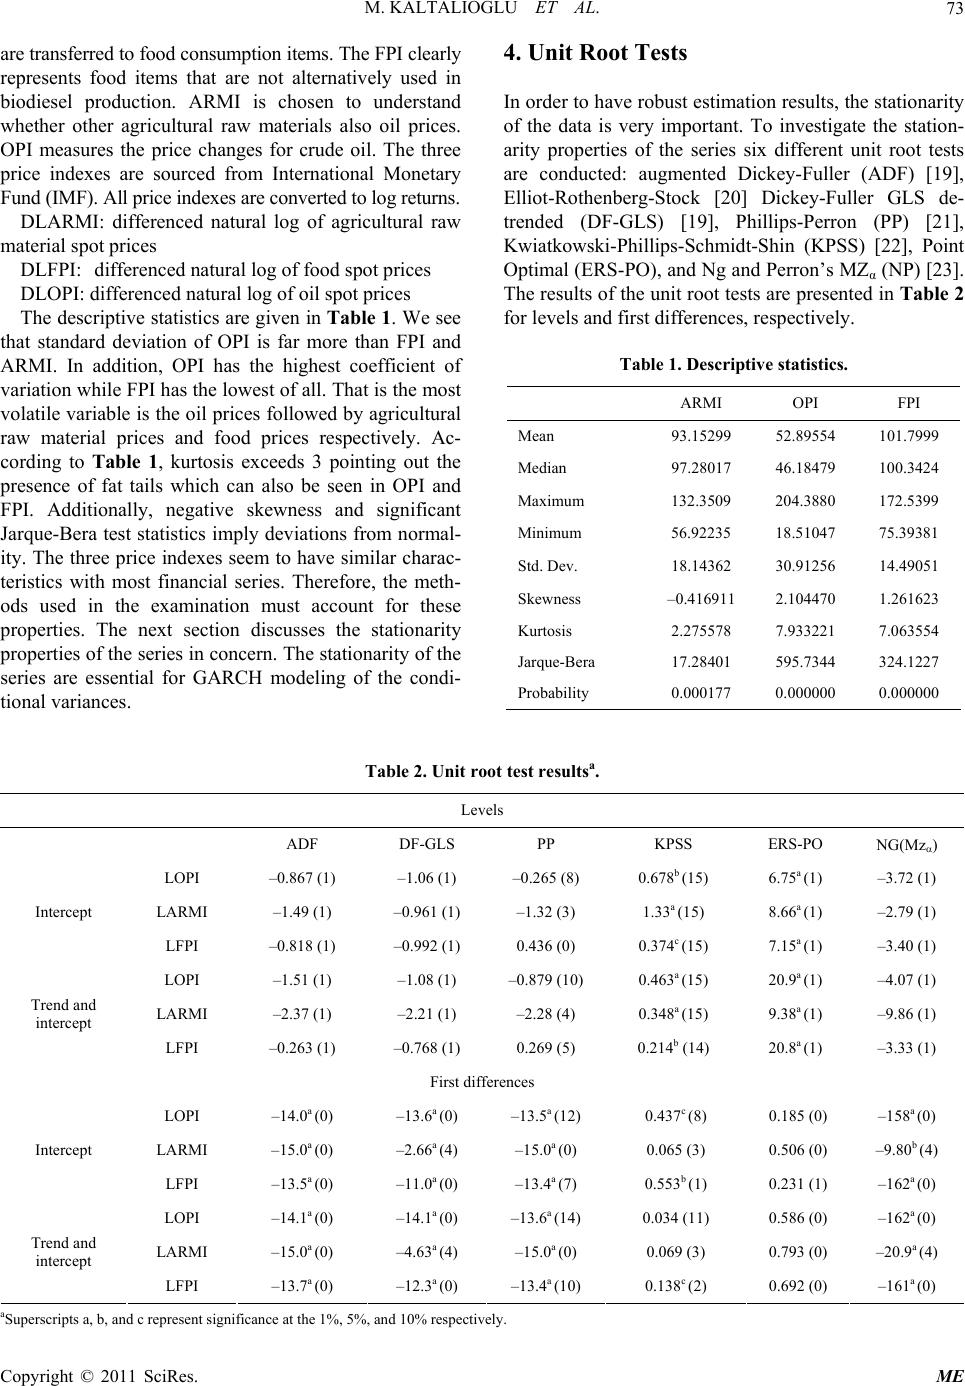 M. KALTALIOGLU ET AL. Copyright © 2011 SciRes. ME 73 are transferred to food consumption items. The FPI clearly represents food items that are not alternatively used in biodiesel production. ARMI is chosen to understand whether other agricultural raw materials also oil prices. OPI measures the price changes for crude oil. The three price indexes are sourced from International Monetary Fund (IMF). All price indexes are converted to log returns. DLARMI: differenced natural log of agricultural raw material spot prices DLFPI: differenced natural log of food spot prices DLOPI: differenced natural log of oil spot prices The descriptive statistics are given in Table 1 . We see that standard deviation of OPI is far more than FPI and ARMI. In addition, OPI has the highest coefficient of variation while FPI has the lowest of all. That is the most volatile variable is the oil prices followed by agricultural raw material prices and food prices respectively. Ac- cording to Table 1, kurtosis exceeds 3 pointing out the presence of fat tails which can also be seen in OPI and FPI. Additionally, negative skewness and significant Jarque-Bera test statistics imply deviations from normal- ity. The three price indexes seem to have similar charac- teristics with most financial series. Therefore, the meth- ods used in the examination must account for these properties. The next section discusses the stationarity properties of the series in concern. The stationarity of the series are essential for GARCH modeling of the condi- tional variances. 4. Unit Root Tests In order to have robust estimation results, the stationarity of the data is very important. To investigate the station- arity properties of the series six different unit root tests are conducted: augmented Dickey-Fuller (ADF) [19], Elliot-Rothenberg-Stock [20] Dickey-Fuller GLS de- trended (DF-GLS) [19], Phillips-Perron (PP) [21], Kwiatkowski-Phillips-Schmidt-Sh in (KPSS) [22], Point Optimal (ERS-PO), and Ng and Perron’s MZα (NP) [23]. The results of the unit root tests are presented in Ta ble 2 for levels and first differences, respectively. Table 1. Descriptive statistics. ARMI OPI FPI Mean 93.15299 52.89554 101.7999 Median 97.28017 46.18479 100.3424 Maximum 132.3509 204.3880 172.5399 Minimum 56.92235 18.51047 75.39381 Std. Dev. 18.14362 30.91256 14.49051 Skewness –0.416911 2.104470 1.261623 Kurtosis 2.275578 7.933221 7.063554 Jarque-Bera 17.28401 595.7344 324.1227 Probability 0.000177 0.000000 0.000000 Table 2. Unit root test resultsa. Levels ADF DF-GLS PP KPSS ERS-PO NG(Mz) LOPI –0.867 (1) –1.06 (1) –0.265 (8) 0.678b (15) 6.75a (1) –3.72 (1) LARMI –1.49 (1) –0.961 (1) –1.32 (3) 1.33a (15) 8.66a (1) –2.79 (1) Intercept LFPI –0.818 (1) –0.992 (1) 0.436 (0) 0.374c (15) 7.15a (1) –3.40 (1) LOPI –1.51 (1) –1.08 (1) –0.879 (10) 0.463a (15) 20.9a (1) –4.07 (1) LARMI –2.37 (1) –2.21 (1) –2.28 (4) 0.348a (15) 9.38a (1) –9.86 (1) Trend and intercept LFPI –0.263 (1) –0.768 (1) 0.269 (5) 0.214b (14) 20.8a (1) –3.33 (1) First differences LOPI –14.0a (0) –13.6a (0) –13.5a (12) 0.437c (8) 0.185 (0) –158a (0) LARMI –15.0a (0) –2.66a (4) –15.0a (0) 0.065 (3) 0.506 (0) –9.80b (4) Intercept LFPI –13.5a (0) –11.0a (0) –13.4a (7) 0.553b (1) 0.231 (1) –162a (0) LOPI –14.1a (0) –14.1a (0) –13.6a (14) 0.034 (11) 0.586 (0) –162a (0) LARMI –15.0a (0) –4.63a (4) –15.0a (0) 0.069 (3) 0.793 (0) –20.9a (4) Trend and intercept LFPI –13.7a (0) –12.3a (0) –13.4a (10) 0.138c (2) 0.692 (0) –161a (0) aSuperscripts a, b, and c represent significance at the 1%, 5%, and 10% respectively. 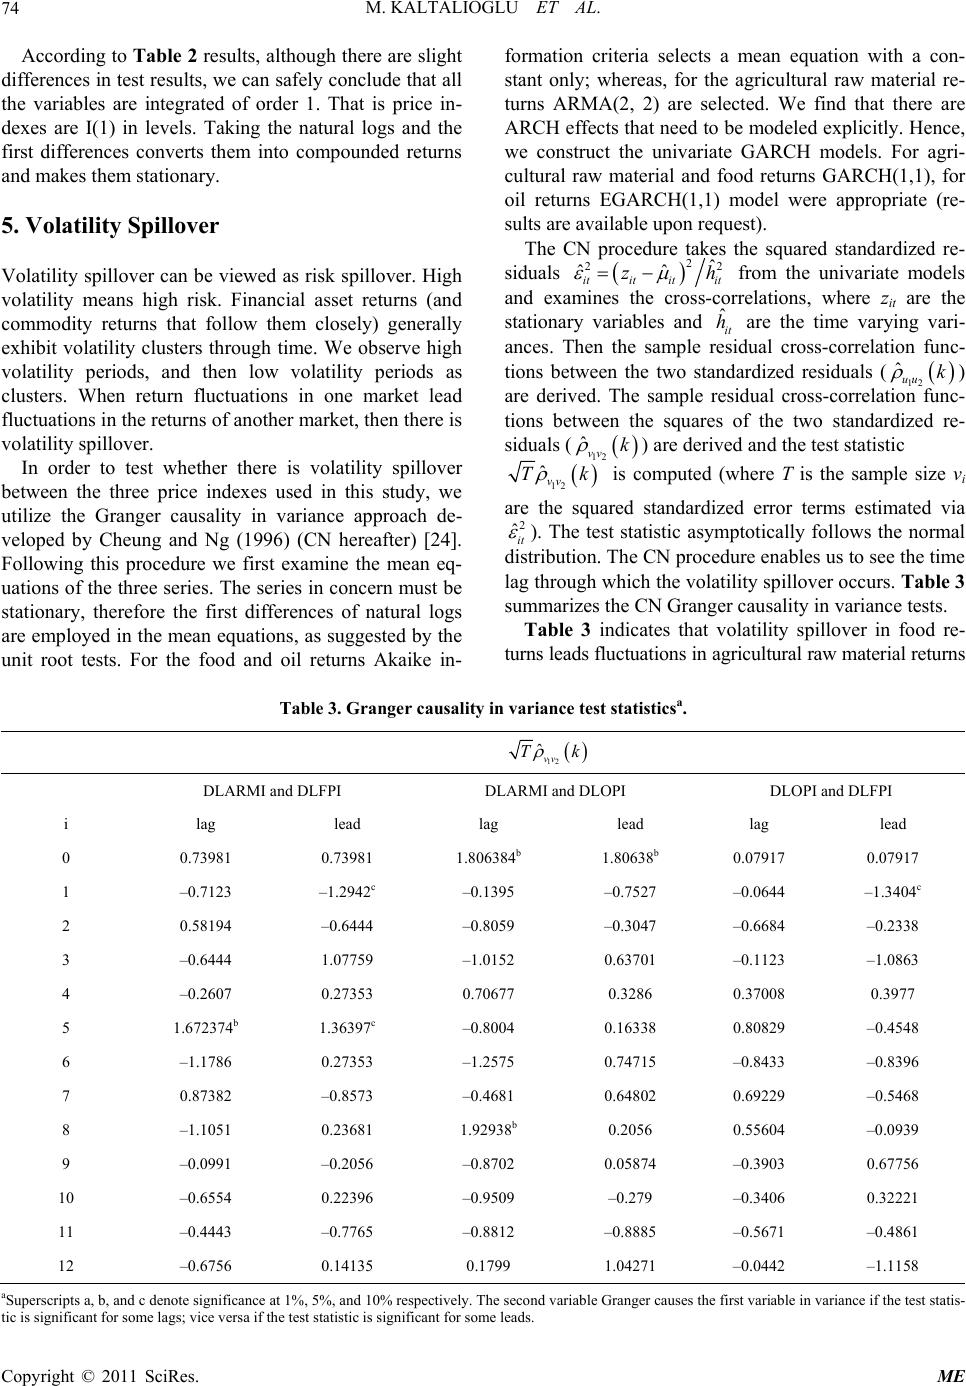 M. KALTALIOGLU ET AL. 74 According to Table 2 results, although there are slight differences in test results, we can safely conclude that all the variables are integrated of order 1. That is price in- dexes are I(1) in levels. Taking the natural logs and the first differences converts them into compounded returns and makes them stationary. 5. Volatility Spillover Volatility spillover can be viewed as risk spillover. High volatility means high risk. Financial asset returns (and commodity returns that follow them closely) generally exhibit volatility clusters through time. We observe high volatility periods, and then low volatility periods as clusters. When return fluctuations in one market lead fluctuations in the returns of another market, then there is volatility spillover. In order to test whether there is volatility spillover between the three price indexes used in this study, we utilize the Granger causality in variance approach de- veloped by Cheung and Ng (1996) (CN hereafter) [24]. Following this procedure we first examine the mean eq- uations of the three series. The series in concern must be stationary, therefore the first differences of natural logs are employed in the mean equations, as suggested by the unit root tests. For the food and oil returns Akaike in- formation criteria selects a mean equation with a con- stant only; whereas, for the agricultural raw material re- turns ARMA(2, 2) are selected. We find that there are ARCH effects that need to be modeled explicitly. Hence, we construct the univariate GARCH models. For agri- cultural raw material and food returns GARCH(1,1), for oil returns EGARCH(1,1) model were appropriate (re- sults are available upon request). The CN procedure takes the squared standardized re- siduals 2 2 ˆ ˆˆ itit itit z 2 h from the univariate models and examines the cross-correlations, where zit are the stationary variables and are the time varying vari- ances. Then the sample residual cross-correlation func- tions between the two standardized residuals ( ˆit h ˆuu k 12 ) are derived. The sample residual cross-correlation func- tions between the squares of the two standardized re- siduals ( 12 ˆvv k ) are derived and the test statistic k 12 ˆvv T is computed (where T is the sample size vi are the squared standardized error terms estimated via 2 ˆit ). The test statistic asymptotically follows the normal distribution. The CN procedure enables us to see the time lag through which the volatility spillover occurs. Tab le 3 summarizes the CN Granger causality in variance tests. Table 3 indicates that volatility spillover in food re- turns leads fluctuations in agricultural raw material returns Table 3. Granger causality in variance test statisticsa. 12 ˆvv Tk DLARMI and DLFPI DLARMI and DLOPI DLOPI and DLFPI i lag lead lag lead lag lead 0 0.73981 0.73981 1.806384b 1.80638b 0.07917 0.07917 1 –0.7123 –1.2942c –0.1395 –0.7527 –0.0644 –1.3404c 2 0.58194 –0.6444 –0.8059 –0.3047 –0.6684 –0.2338 3 –0.6444 1.07759 –1.0152 0.63701 –0.1123 –1.0863 4 –0.2607 0.27353 0.70677 0.3286 0.37008 0.3977 5 1.672374b 1.36397c –0.8004 0.16338 0.80829 –0.4548 6 –1.1786 0.27353 –1.2575 0.74715 –0.8433 –0.8396 7 0.87382 –0.8573 –0.4681 0.64802 0.69229 –0.5468 8 –1.1051 0.23681 1.92938b 0.2056 0.55604 –0.0939 9 –0.0991 –0.2056 –0.8702 0.05874 –0.3903 0.67756 10 –0.6554 0.22396 –0.9509 –0.279 –0.3406 0.32221 11 –0.4443 –0.7765 –0.8812 –0.8885 –0.5671 –0.4861 12 –0.6756 0.14135 0.1799 1.04271 –0.0442 –1.1158 aSuperscripts a, b, and c denote significance at 1%, 5%, and 10% respectively. The second variable Granger causes the first variable in variance if the test statis- ic is significant for some lags; vice versa if the test statistic is significant for some leads. t Copyright © 2011 SciRes. ME 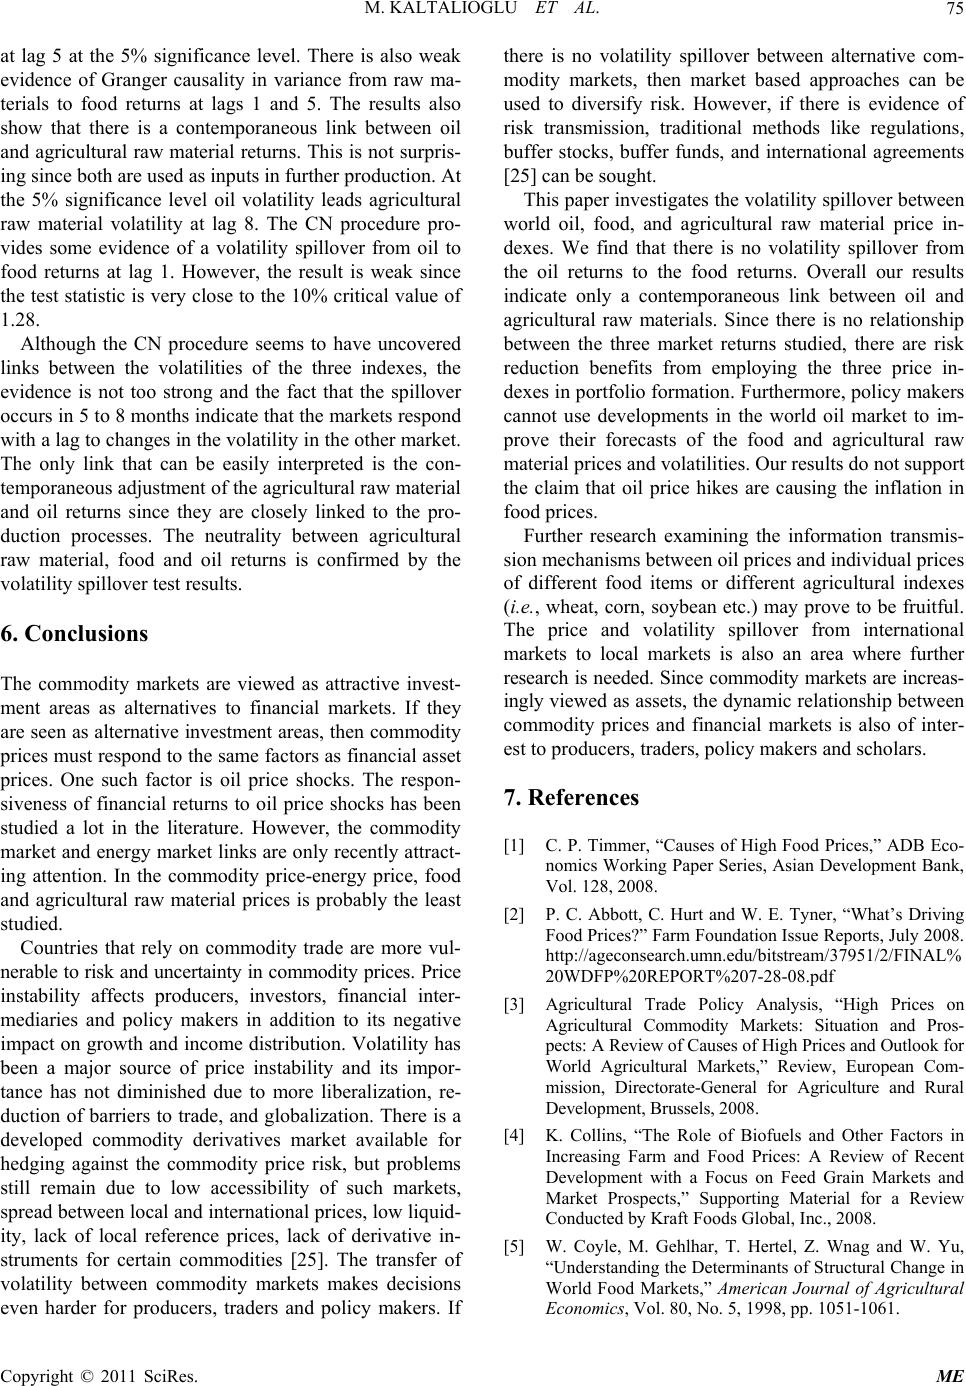 M. KALTALIOGLU ET AL. Copyright © 2011 SciRes. ME 75 at lag 5 at the 5% significance level. There is also weak evidence of Granger causality in variance from raw ma- terials to food returns at lags 1 and 5. The results also show that there is a contemporaneous link between oil and agricultural raw material returns. This is not surpris- ing since both are used as inputs in further production. At the 5% significance level oil volatility leads agricultural raw material volatility at lag 8. The CN procedure pro- vides some evidence of a volatility spillover from oil to food returns at lag 1. However, the result is weak since the test statistic is very close to the 10% critical value of 1.28. Although the CN procedure seems to have uncovered links between the volatilities of the three indexes, the evidence is not too strong and the fact that the spillover occurs in 5 to 8 months indicate that the markets respond with a lag to changes in the volatility in the other market. The only link that can be easily interpreted is the con- temporaneous adjustment of the agricultural raw material and oil returns since they are closely linked to the pro- duction processes. The neutrality between agricultural raw material, food and oil returns is confirmed by the volatility spillover test results. 6. Conclusions The commodity markets are viewed as attractive invest- ment areas as alternatives to financial markets. If they are seen as alternative investment areas, then commodity prices must respond to the same factors as financial asset prices. One such factor is oil price shocks. The respon- siveness of financial returns to oil price shocks has been studied a lot in the literature. However, the commodity market and energy market links are only recently attract- ing attention. In the commodity price-energy price, food and agricultural raw material prices is probably the least studied. Countries that rely on commodity trade are more vul- nerable to risk and uncertainty in commodity prices. Price instability affects producers, investors, financial inter- mediaries and policy makers in addition to its negative impact on growth and income distribution. Volatility has been a major source of price instability and its impor- tance has not diminished due to more liberalization, re- duction of barriers to trade, and globalization. There is a developed commodity derivatives market available for hedging against the commodity price risk, but problems still remain due to low accessibility of such markets, spread between local and international prices, low liquid- ity, lack of local reference prices, lack of derivative in- struments for certain commodities [25]. The transfer of volatility between commodity markets makes decisions even harder for producers, traders and policy makers. If there is no volatility spillover between alternative com- modity markets, then market based approaches can be used to diversify risk. However, if there is evidence of risk transmission, traditional methods like regulations, buffer stocks, buffer funds, and international agreements [25] can be sought. This paper investigates the volatility spillover between world oil, food, and agricultural raw material price in- dexes. We find that there is no volatility spillover from the oil returns to the food returns. Overall our results indicate only a contemporaneous link between oil and agricultural raw materials. Since there is no relationship between the three market returns studied, there are risk reduction benefits from employing the three price in- dexes in portfolio formation. Furthermore, policy makers cannot use developments in the world oil market to im- prove their forecasts of the food and agricultural raw material prices and volatilities. Our results do not support the claim that oil price hikes are causing the inflation in food prices. Further research examining the information transmis- sion mechanisms between oil prices and individual prices of different food items or different agricultural indexes (i.e., wheat, corn, soybean etc.) may prove to be fruitful. The price and volatility spillover from international markets to local markets is also an area where further research is needed. Since commodity markets are increas- ingly viewed as assets, the dynamic relationship between commodity prices and financial markets is also of inter- est to producers, traders, policy makers and scholars. 7. References [1] C. P. Timmer, “Causes of High Food Prices,” ADB Eco- nomics Working Paper Series, Asian Development Bank, Vol. 128, 2008. [2] P. C. Abbott, C. Hurt and W. E. Tyner, “What’s Driving Food Prices?” Farm Foundation Issue Reports, July 2008. http://ageconsearch.umn.edu/bitstream/37951/2/FINAL% 20WDFP%20REPORT%207-28-08.pdf [3] Agricultural Trade Policy Analysis, “High Prices on Agricultural Commodity Markets: Situation and Pros- pects: A Review of Causes of High Prices and Outlook for World Agricultural Markets,” Review, European Com- mission, Directorate-General for Agriculture and Rural Development, Brussels, 2008. [4] K. Collins, “The Role of Biofuels and Other Factors in Increasing Farm and Food Prices: A Review of Recent Development with a Focus on Feed Grain Markets and Market Prospects,” Supporting Material for a Review Conducted by Kraft Foods Global, Inc., 2008. [5] W. Coyle, M. Gehlhar, T. Hertel, Z. Wnag and W. Yu, “Understanding the Determinants of Structural Change in World Food Markets,” American Journal of Agricultural Economics, Vol. 80, No. 5, 1998, pp. 1051-1061. 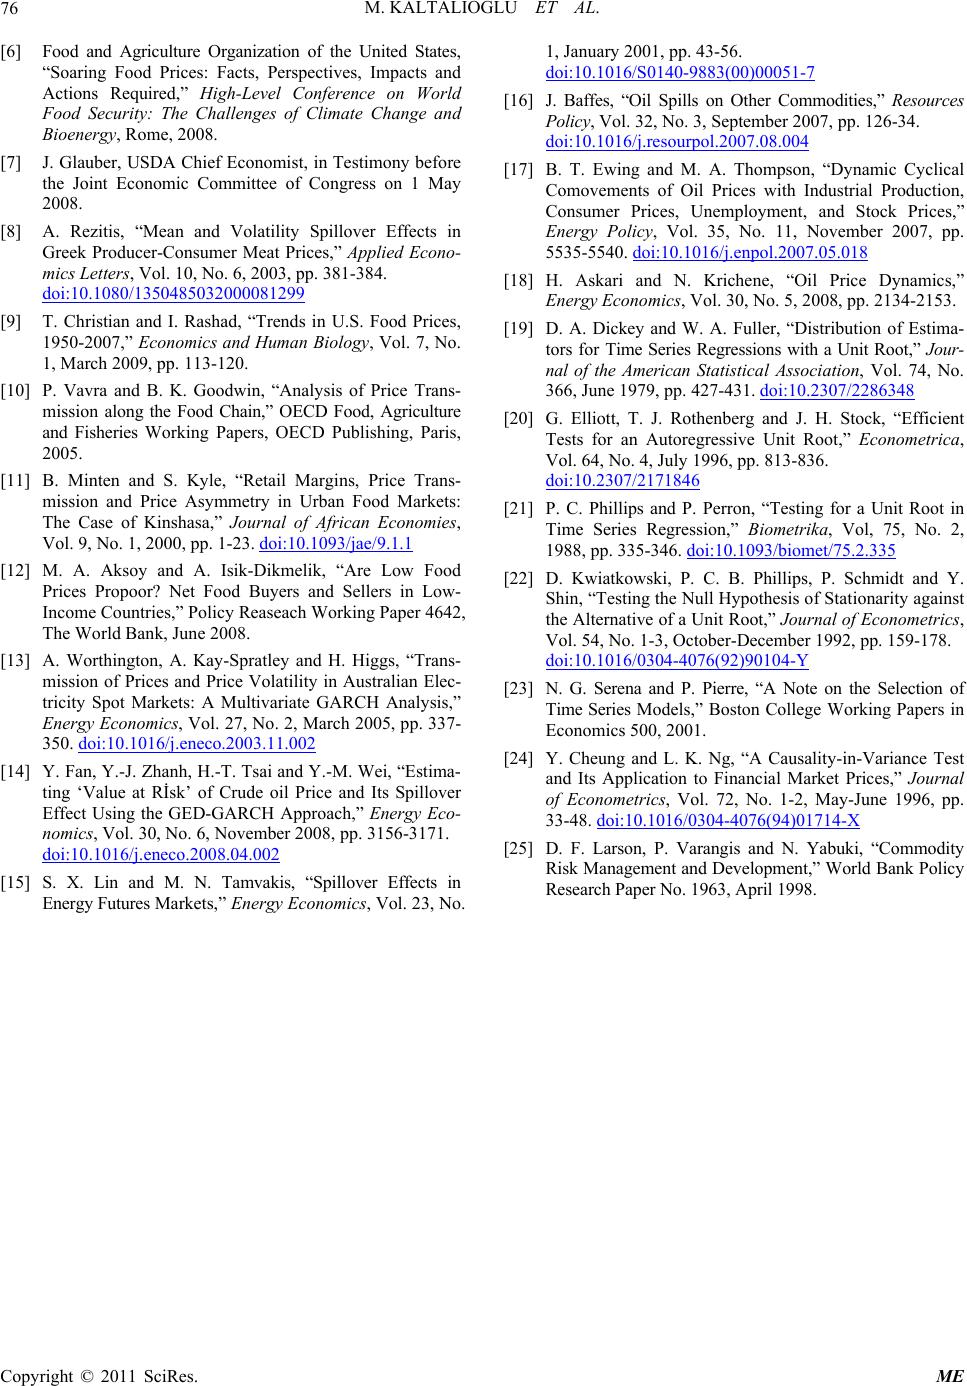 M. KALTALIOGLU ET AL. 76 [6] Food and Agriculture Organization of the United States, “Soaring Food Prices: Facts, Perspectives, Impacts and Actions Required,” High-Level Conference on World Food Security: The Challenges of Climate Change and Bioenergy, Rome, 2008. [7] J. Glauber, USDA Chief Economist, in Testimony before the Joint Economic Committee of Congress on 1 May 2008. [8] A. Rezitis, “Mean and Volatility Spillover Effects in Greek Producer-Consumer Meat Prices,” Applied Econo- mics Letters, Vol. 10, No. 6, 2003, pp. 381-384. doi:10.1080/1350485032000081299 [9] T. Christian and I. Rashad, “Trends in U.S. Food Prices, 1950-2007,” Economics and Human Biology, Vol. 7, No. 1, March 2009, pp. 113-120. [10] P. Vavra and B. K. Goodwin, “Analysis of Price Trans- mission along the Food Chain,” OECD Food, Agriculture and Fisheries Working Papers, OECD Publishing, Paris, 2005. [11] B. Minten and S. Kyle, “Retail Margins, Price Trans- mission and Price Asymmetry in Urban Food Markets: The Case of Kinshasa,” Journal of African Economies, Vol. 9, No. 1, 2000, pp. 1-23. doi:10.1093/jae/9.1.1 [12] M. A. Aksoy and A. Isik-Dikmelik, “Are Low Food Prices Propoor? Net Food Buyers and Sellers in Low- Income Countries,” Policy Reaseach Working Paper 4642, The World Bank, June 2008. [13] A. Worthington, A. Kay-Spratley and H. Higgs, “Trans- mission of Prices and Price Volatility in Australian Elec- tricity Spot Markets: A Multivariate GARCH Analysis,” Energy Economics, Vol. 27, No. 2, March 2005, pp. 337- 350. doi:10.1016/j.eneco.2003.11.002 [14] Y. Fan, Y.-J. Zhanh, H.-T. Tsai and Y.-M. Wei, “Estima- ting ‘Value at Rİsk’ of Crude oil Price and Its Spillover Effect Using the GED-GARCH Approach,” Energy Eco- nomics, Vol. 30, No. 6, November 2008, pp. 3156-3171. doi:10.1016/j.eneco.2008.04.002 [15] S. X. Lin and M. N. Tamvakis, “Spillover Effects in Energy Futures Markets,” Energy Economics, Vol. 23, No. 1, January 2001, pp. 43-56. doi:10.1016/S0140-9883(00)00051-7 [16] J. Baffes, “Oil Spills on Other Commodities,” Resources Policy, Vol. 32, No. 3, September 2007, pp. 126-34. doi:10.1016/j.resourpol.2007.08.004 [17] B. T. Ewing and M. A. Thompson, “Dynamic Cyclical Comovements of Oil Prices with Industrial Production, Consumer Prices, Unemployment, and Stock Prices,” Energy Policy, Vol. 35, No. 11, November 2007, pp. 5535-5540. doi:10.1016/j.enpol.2007.05.018 [18] H. Askari and N. Krichene, “Oil Price Dynamics,” Energy Economics, Vol. 30, No. 5, 2008, pp. 2134-2153. [19] D. A. Dickey and W. A. Fuller, “Distribution of Estima- tors for Time Series Regressions with a Unit Root,” Jour- nal of the American Statistical Association, Vol. 74, No. 366, June 1979, pp. 427-431. doi:10.2307/2286348 [20] G. Elliott, T. J. Rothenberg and J. H. Stock, “Efficient Tests for an Autoregressive Unit Root,” Econometrica, Vol. 64, No. 4, July 1996, pp. 813-836. doi:10.2307/2171846 [21] P. C. Phillips and P. Perron, “Testing for a Unit Root in Time Series Regression,” Biometrika, Vol, 75, No. 2, 1988, pp. 335-346. doi:10.1093/biomet/75.2.335 [22] D. Kwiatkowski, P. C. B. Phillips, P. Schmidt and Y. Shin, “Testing the Null Hypothesis of Stationarity against the Alternative of a Unit Root,” Journal of Econometrics, Vol. 54, No. 1-3, October-December 1992, pp. 159-178. doi:10.1016/0304-4076(92)90104-Y [23] N. G. Serena and P. Pierre, “A Note on the Selection of Time Series Models,” Boston College Working Papers in Economics 500, 2001. [24] Y. Cheung and L. K. Ng, “A Causality-in-Variance Test and Its Application to Financial Market Prices,” Journal of Econometrics, Vol. 72, No. 1-2, May-June 1996, pp. 33-48. doi:10.1016/0304-4076(94)01714-X [25] D. F. Larson, P. Varangis and N. Yabuki, “Commodity Risk Management and Development,” World Bank Policy Research Paper No. 1963, April 1998. Copyright © 2011 SciRes. ME |