

Paper Menu >>
Journal Menu >>
 Vol.3, No.5, 414-418 (2011) Natural Science http://dx.doi.org/10.4236/ns.2011.35056 Copyright © 2011 SciRes. OPEN ACCESS Effect of EXAFS on the dosimetric related parameters Chitralekha Alur, Sharanabasappa Patil, Manjunath Apparao, Basavaraj Kerur* Department of Physics, Gulbarga University, Gulbarga, India; *Corresponding Author: [email protected] Received 4 March 2011; revised 22 March 2011; accepted 27 March 2011. ABSTRACT Mass attenuation coefficients have been meas- ured for rare earth compounds at photon ener- gies 8.041, 8.907 and 13.347 keV. The measured values are compared with theoretical calcula- tions. The agreement between experiment and theory is more than the experimental error when the incident photon energy is around the edge of the element present in the compound and agreeing with the theoretical values elsewhere. The difference in agreement between the theo- retical values and experimental values is attrib- uted to the EXAFS effects on the mass attenua- tion coefficient values. Keywords: Mass Attenuation Coefficient; Near Absorption Edge; Cross Section; Resonance Raman Scattering; EXAFS 1. INTRODUCTION In medical physics, it is important to measure the amount of radiation delivered by the ionizing radiation, in composite substances. For photon interactions in composite substances a single number cannot represent the atomic number uniquely across the entire energy region. This number in composite substances is called the effective atomic number and it varies with energy and is denoted here by Zeff. On the other hand, the con- cept of z-dependence of photon attenuation has led to many applications in radiation studies. For example pre- cise knowledge of effective atomic numbers is very im- portant in medical radiation dosimetry and medical im- aging, where the cross-sectional anatomy is generated by computer-assisted tomography (CAT) scans [1]. It is a common practice to verify the validity of calculation algorithms by comparing the generated doses with the measured doses in tissue equivalent phantom substances. Similarly, tissue-equivalent phantoms are specifically designed to study the image quality and performance of the CAT scanners. In both instances, a precise knowl- edge of the effective atomic number and electron density of the composite substances is necessary in the low en- ergy region and have proved to be a convenient parame- ter for interpretation of x-ray attenuation by a complex medium like a biological tissue and particularly for the calculation of dose in radiography and radiation do- simetry etc. The x-ray mass attenuation coefficient, , for any material are usually estimated from Bragg’s additivity law or more commonly called mixture rule. Thus for any chemical compound/material is given by ii , where i is the mass attenuation coefficient of the ith element and i is the fraction by weight of the ith ele- ment. For a compound/material with chemical formula (Z1)a1, (Z2)a2, ···, (Zn)an the weight factor for the ith ele- ment is given by iii ii aA aA , where Ai is the atomic weight of the ith element. Hence an attempt has been in this regard to determine the of x-rays for the dosimetric materials (sulphides of Mg, Ca, Mn Fe and Zn elements) and then determined the Zeff of these materials by LSF method from ln Vs lnZ graph. These values are compared with the theoretical values. The so determined value of Zeff has been used in the expression eAeffi NNZ nA to calculate the electron density. In the present measurement the validity of Bragg’s law is studied for rare earths compounds of L edges. The selection of the compounds was dictated by the incident photon energy and the by the limitations of our experi- mental facilities such that thin foils from the compounds. The former factor determined the region of the atomic numbers, wherein the absorption edges energy are close to the incident photon energy, and the latter determined the selection of particular compounds in this region. We have used 241Am (VEC) radioactive x-ray source with weighted average energy of Kα of 8.041 and 13.347 keV energy respectively and the compounds of rare earths 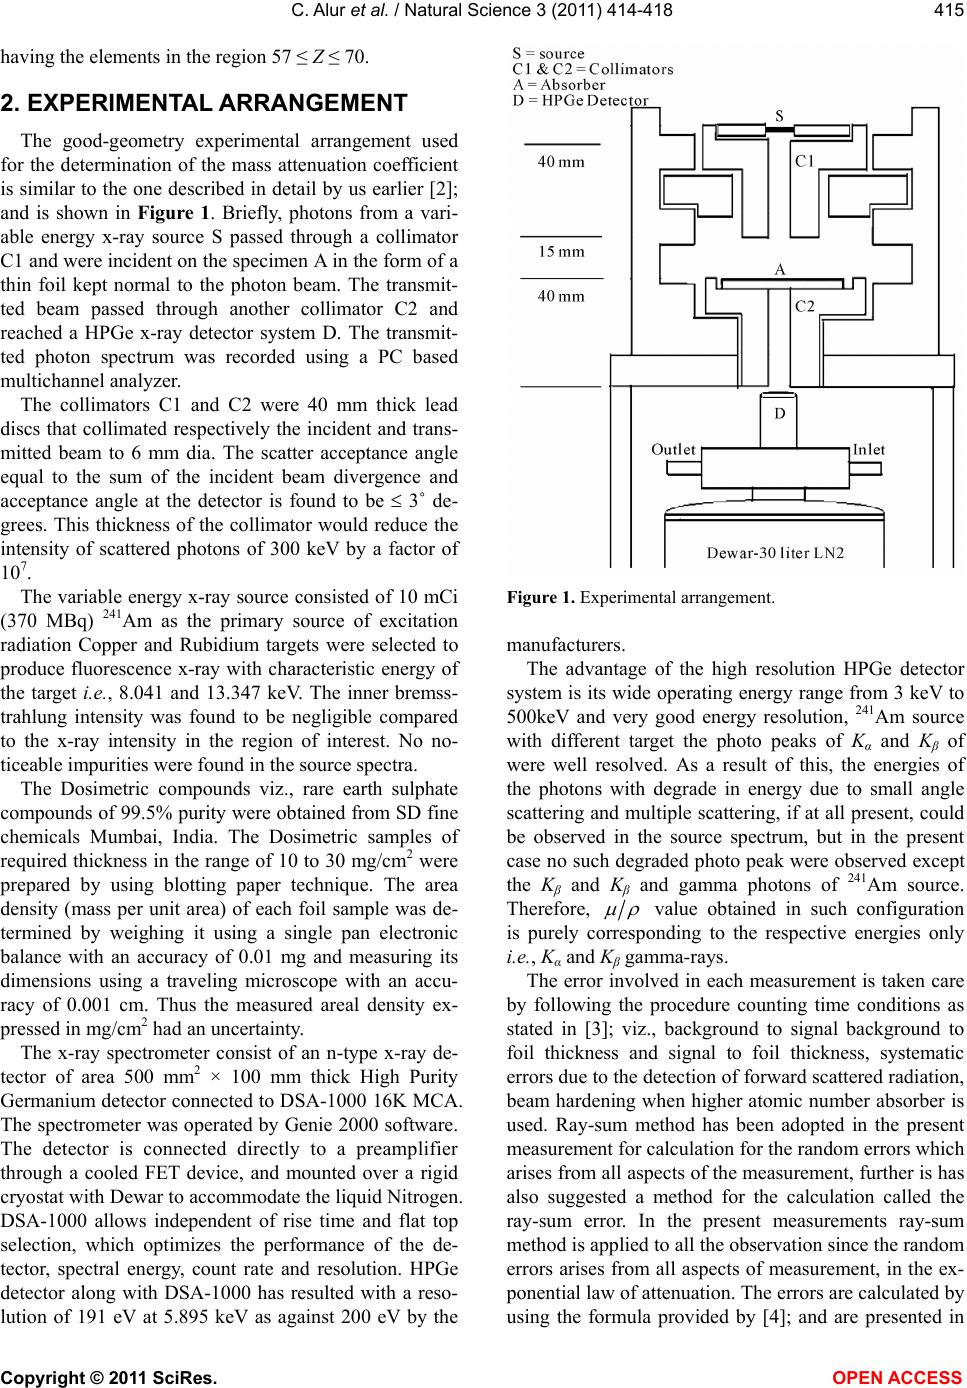 C. Alur et al. / Natural Science 3 (2011) 414-418 Copyright © 2011 SciRes. OPEN ACCESS 415 having the elements in the region 57 ≤ Z ≤ 70. 2. EXPERIMENTAL ARRANGEMENT The good-geometry experimental arrangement used for the determination of the mass attenuation coefficient is similar to the one described in detail by us earlier [2]; and is shown in Figure 1. Briefly, photons from a vari- able energy x-ray source S passed through a collimator C1 and were incident on the specimen A in the form of a thin foil kept normal to the photon beam. The transmit- ted beam passed through another collimator C2 and reached a HPGe x-ray detector system D. The transmit- ted photon spectrum was recorded using a PC based multichannel analyzer. The collimators C1 and C2 were 40 mm thick lead discs that collimated respectively the incident and trans- mitted beam to 6 mm dia. The scatter acceptance angle equal to the sum of the incident beam divergence and acceptance angle at the detector is found to be 3˚ de- grees. This thickness of the collimator would reduce the intensity of scattered photons of 300 keV by a factor of 107. The variable energy x-ray source consisted of 10 mCi (370 MBq) 241Am as the primary source of excitation radiation Copper and Rubidium targets were selected to produce fluorescence x-ray with characteristic energy of the target i.e., 8.041 and 13.347 keV. The inner bremss- trahlung intensity was found to be negligible compared to the x-ray intensity in the region of interest. No no- ticeable impurities were found in the source spectra. The Dosimetric compounds viz., rare earth sulphate compounds of 99.5% purity were obtained from SD fine chemicals Mumbai, India. The Dosimetric samples of required thickness in the range of 10 to 30 mg/cm2 were prepared by using blotting paper technique. The area density (mass per unit area) of each foil sample was de- termined by weighing it using a single pan electronic balance with an accuracy of 0.01 mg and measuring its dimensions using a traveling microscope with an accu- racy of 0.001 cm. Thus the measured areal density ex- pressed in mg/cm2 had an uncertainty. The x-ray spectrometer consist of an n-type x-ray de- tector of area 500 mm2 × 100 mm thick High Purity Germanium detector connected to DSA-1000 16K MCA. The spectrometer was operated by Genie 2000 software. The detector is connected directly to a preamplifier through a cooled FET device, and mounted over a rigid cryostat with Dewar to accommodate the liquid Nitrogen. DSA-1000 allows independent of rise time and flat top selection, which optimizes the performance of the de- tector, spectral energy, count rate and resolution. HPGe detector along with DSA-1000 has resulted with a reso- lution of 191 eV at 5.895 keV as against 200 eV by the Figure 1. Experimental arrangement. manufacturers. The advantage of the high resolution HPGe detector system is its wide operating energy range from 3 keV to 500keV and very good energy resolution, 241Am source with different target the photo peaks of Kα and Kβ of were well resolved. As a result of this, the energies of the photons with degrade in energy due to small angle scattering and multiple scattering, if at all present, could be observed in the source spectrum, but in the present case no such degraded photo peak were observed except the Kβ and Kβ and gamma photons of 241Am source. Therefore, value obtained in such configuration is purely corresponding to the respective energies only i.e., Kα and Kβ gamma-rays. The error involved in each measurement is taken care by following the procedure counting time conditions as stated in [3]; viz., background to signal background to foil thickness and signal to foil thickness, systematic errors due to the detection of forward scattered radiation, beam hardening when higher atomic number absorber is used. Ray-sum method has been adopted in the present measurement for calculation for the random errors which arises from all aspects of the measurement, further is has also suggested a method for the calculation called the ray-sum error. In the present measurements ray-sum method is applied to all the observation since the random errors arises from all aspects of measurement, in the ex- ponential law of attenuation. The errors are calculated by using the formula provided by [4]; and are presented in 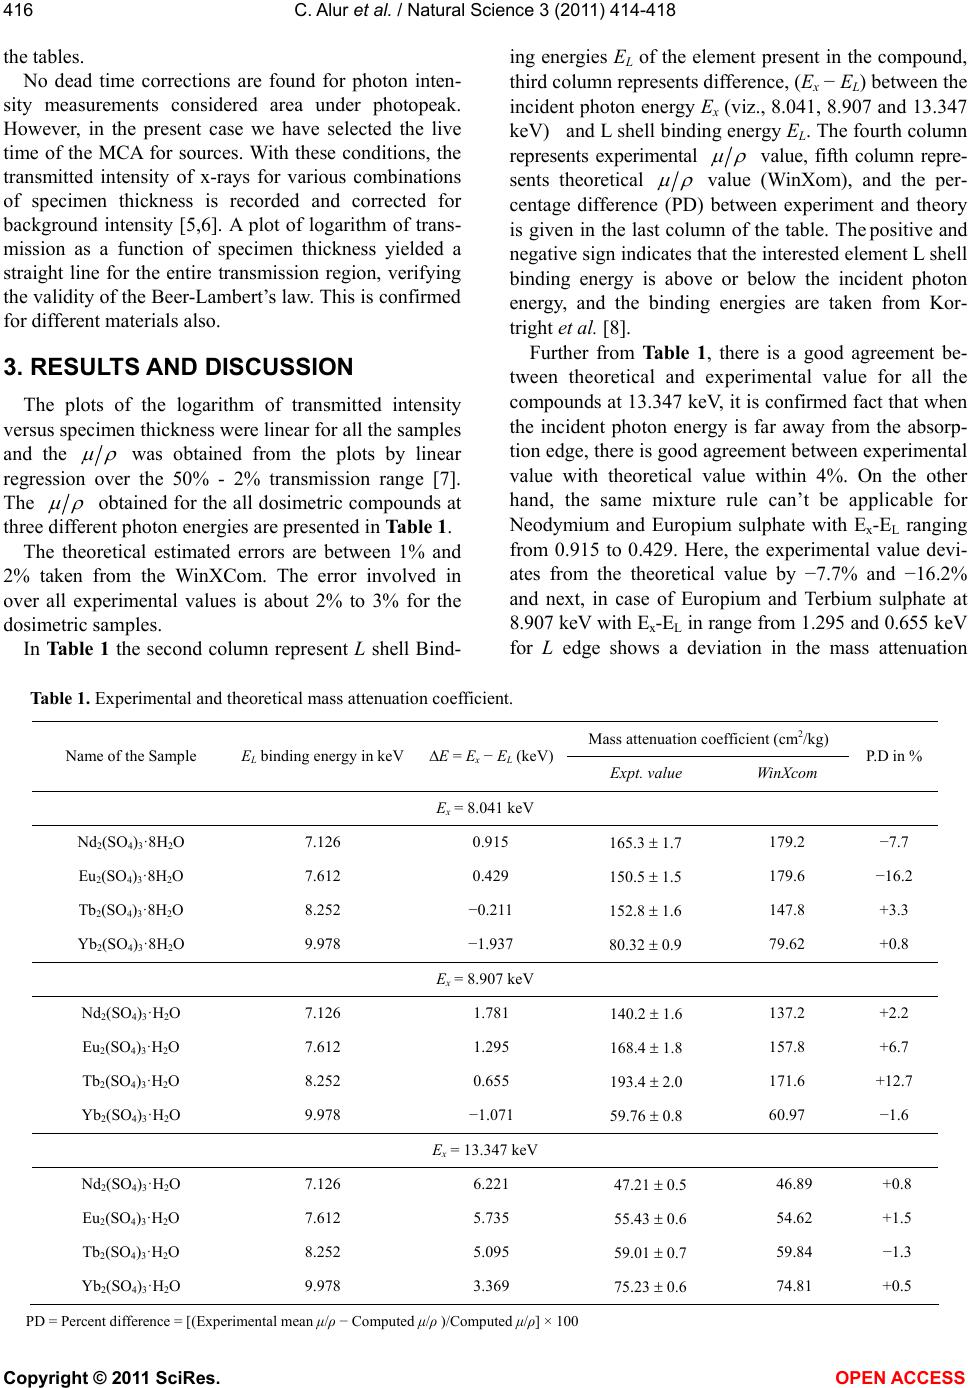 C. Alur et al. / Natural Science 3 (2011) 414-418 Copyright © 2011 SciRes. OPEN ACCESS 416 the tables. No dead time corrections are found for photon inten- sity measurements considered area under photopeak. However, in the present case we have selected the live time of the MCA for sources. With these conditions, the transmitted intensity of x-rays for various combinations of specimen thickness is recorded and corrected for background intensity [5,6]. A plot of logarithm of trans- mission as a function of specimen thickness yielded a straight line for the entire transmission region, verifying the validity of the Beer-Lambert’s law. This is confirmed for different materials also. 3. RESULTS AND DISCUSSION The plots of the logarithm of transmitted intensity versus specimen thickness were linear for all the samples and the was obtained from the plots by linear regression over the 50% - 2% transmission range [7]. The obtained for the all dosimetric compounds at three different photon energies are presented in Table 1. The theoretical estimated errors are between 1% and 2% taken from the WinXCom. The error involved in over all experimental values is about 2% to 3% for the dosimetric samples. In Table 1 the second column represent L shell Bind- ing energies EL of the element present in the compound, third column represents difference, (Ex − EL) between the incident photon energy Ex (viz., 8.041, 8.907 and 13.347 keV) and L shell binding energy EL. The fourth column represents experimental value, fifth column repre- sents theoretical value (WinXom), and the per- centage difference (PD) between experiment and theory is given in the last column of the table. The positive and negative sign indicates that the interested element L shell binding energy is above or below the incident photon energy, and the binding energies are taken from Kor- tright et al. [8]. Further from Table 1, there is a good agreement be- tween theoretical and experimental value for all the compounds at 13.347 keV, it is confirmed fact that when the incident photon energy is far away from the absorp- tion edge, there is good agreement between experimental value with theoretical value within 4%. On the other hand, the same mixture rule can’t be applicable for Neodymium and Europium sulphate with Ex-EL ranging from 0.915 to 0.429. Here, the experimental value devi- ates from the theoretical value by −7.7% and −16.2% and next, in case of Europium and Terbium sulphate at 8.907 keV with Ex-EL in range from 1.295 and 0.655 keV for L edge shows a deviation in the mass attenuation Table 1. Experimental and theoretical mass attenuation coefficient. Mass attenuation coefficient (cm2/kg) Name of the Sample EL binding energy in keVE = Ex − EL (keV) Expt. value WinXcom P.D in % Ex = 8.041 keV Nd2(SO4)3·8H2O 7.126 0.915 165.3 1.7 179.2 −7.7 Eu2(SO4)3·8H2O 7.612 0.429 150.5 1.5 179.6 −16.2 Tb2(SO4)3·8H2O 8.252 −0.211 152.8 1.6 147.8 +3.3 Yb2(SO4)3·8H2O 9.978 −1.937 80.32 0.9 79.62 +0.8 Ex = 8.907 keV Nd2(SO4)3·H2O 7.126 1.781 140.2 1.6 137.2 +2.2 Eu2(SO4)3·H2O 7.612 1.295 168.4 1.8 157.8 +6.7 Tb2(SO4)3·H2O 8.252 0.655 193.4 2.0 171.6 +12.7 Yb2(SO4)3·H2O 9.978 −1.071 59.76 0.8 60.97 −1.6 Ex = 13.347 keV Nd2(SO4)3·H2O 7.126 6.221 47.21 0.5 46.89 +0.8 Eu2(SO4)3·H2O 7.612 5.735 55.43 0.6 54.62 +1.5 Tb2(SO4)3·H2O 8.252 5.095 59.01 0.7 59.84 −1.3 Yb2(SO4)3·H2O 9.978 3.369 75.23 0.6 74.81 +0.5 PD = Percent difference = [(Experimental mean μ/ρ − Computed μ/ρ)/Computed μ/ρ] × 100 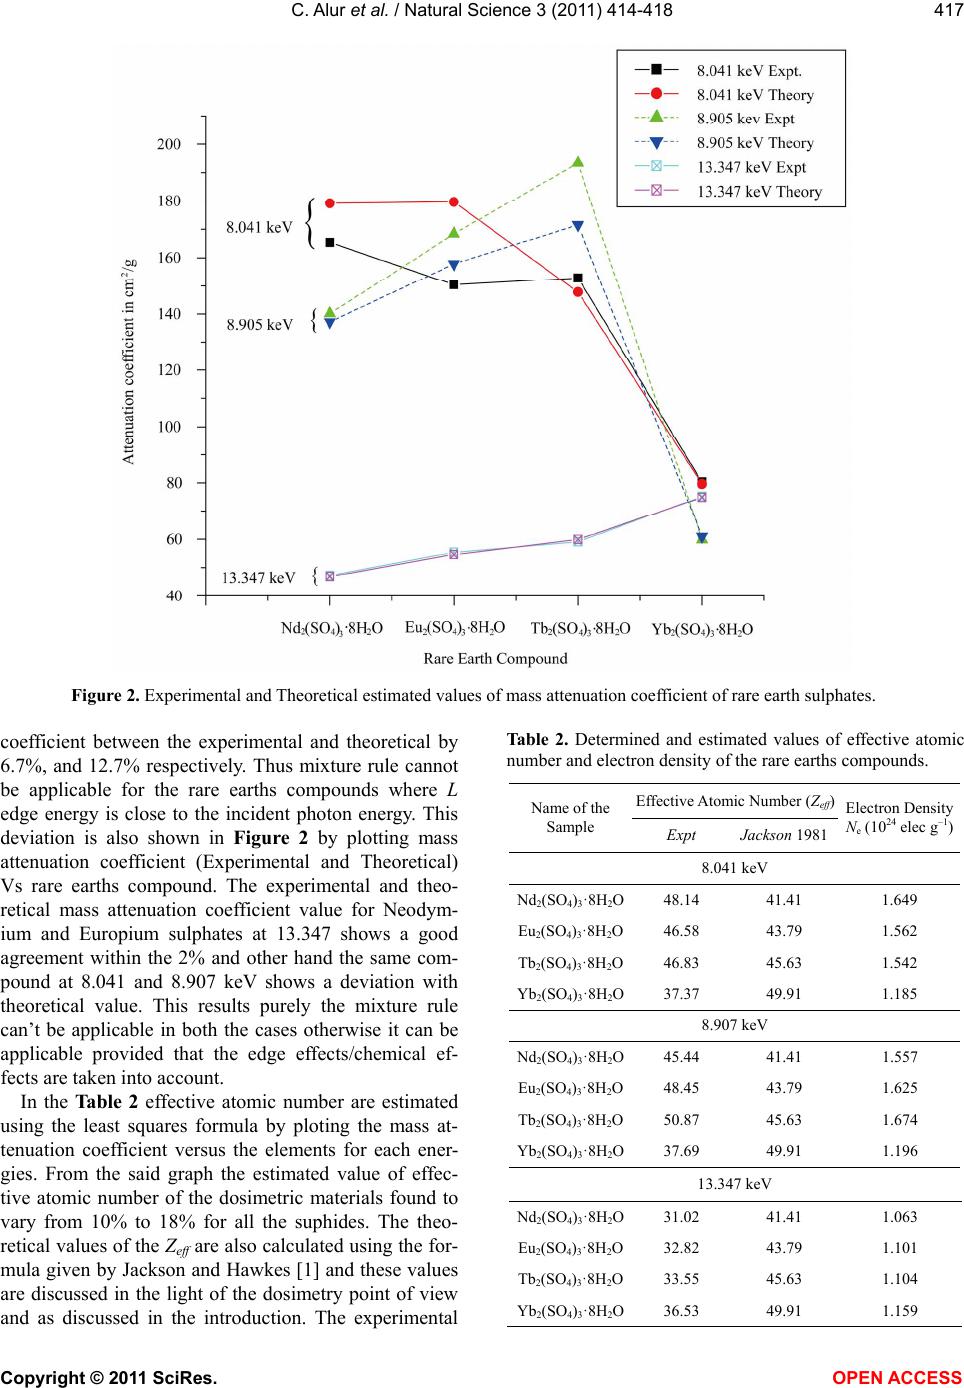 C. Alur et al. / Natural Science 3 (2011) 414-418 Copyright © 2011 SciRes. OPEN ACCESS 417 Figure 2. Experimental and Theoretical estimated values of mass attenuation coefficient of rare earth sulphates. coefficient between the experimental and theoretical by 6.7%, and 12.7% respectively. Thus mixture rule cannot be applicable for the rare earths compounds where L edge energy is close to the incident photon energy. This deviation is also shown in Figure 2 by plotting mass attenuation coefficient (Experimental and Theoretical) Vs rare earths compound. The experimental and theo- retical mass attenuation coefficient value for Neodym- ium and Europium sulphates at 13.347 shows a good agreement within the 2% and other hand the same com- pound at 8.041 and 8.907 keV shows a deviation with theoretical value. This results purely the mixture rule can’t be applicable in both the cases otherwise it can be applicable provided that the edge effects/chemical ef- fects are taken into account. In the Table 2 effective atomic number are estimated using the least squares formula by ploting the mass at- tenuation coefficient versus the elements for each ener- gies. From the said graph the estimated value of effec- tive atomic number of the dosimetric materials found to vary from 10% to 18% for all the suphides. The theo- retical values of the Zeff are also calculated using the for- mula given by Jackson and Hawkes [1] and these values are discussed in the light of the dosimetry point of view and as discussed in the introduction. The experimental Table 2. Determined and estimated values of effective atomic number and electron density of the rare earths compounds. Effective Atomic Number (Zeff) Name of the Sample Expt Jackson 1981 Electron Density Ne (1024 elec g–1) 8.041 keV Nd2(SO4)3·8H2O48.14 41.41 1.649 Eu2(SO4)3·8H2O46.58 43.79 1.562 Tb2(SO4)3·8H2O46.83 45.63 1.542 Yb2(SO4)3·8H2O37.37 49.91 1.185 8.907 keV Nd2(SO4)3·8H2O45.44 41.41 1.557 Eu2(SO4)3·8H2O48.45 43.79 1.625 Tb2(SO4)3·8H2O50.87 45.63 1.674 Yb2(SO4)3·8H2O37.69 49.91 1.196 13.347 keV Nd2(SO4)3·8H2O31.02 41.41 1.063 Eu2(SO4)3·8H2O32.82 43.79 1.101 Tb2(SO4)3·8H2O33.55 45.63 1.104 Yb2(SO4)3·8H2O36.53 49.91 1.159  C. Alur et al. / Natural Science 3 (2011) 414-418 Copyright © 2011 SciRes. OPEN ACCESS 418 and theoretical Zeff values are agreeing within 5% except the edge region. It is important to mention that the theo- retical/calculated values have not considered the edge effects and since the effective atomic numbers are un- der/over estimated when any element falls below the absorption edge. In the present work, there is a good indication that even in the low photon energy region say that up to 15 keV the effective atomic number can be determined with greater accuracy but one should take into account of edge effects.The electron density of the dosimetric mate- rials is calculated using the experimental Zeff values and found to vary 0.478 to 0.676 (1024 electrons g–1). In con- clusion, the determined Zeff value is agreeing with the theoretical values within 5% at this energy range and one should also take care of effects if high atomic num- ber dosimeters are involved. 4. ACKNOWLEDGEMENTS One of the authors BRK is expressed sincere thanks since this work is financially support by UGC New Delhi. REFERENCES [1] Jackson, D.F and Hawkes, J.D. (1981) X-ray attenuation coefficients of elements and mixtures. Physics Reports, 70, 169. doi:10.1016/0370-1573(81)90014-4 [2] Nagabhushan, N.M., Kerur, B.R., Lagare, M.T., Nathu- ram, R., Abani, M.C., Thontadarya, S.R. and Hanumaiah, B. (2004) Technique for measurement of photon intensity for the determination of in the low photon energy re- gion. Journal of X-Ray Science and Technology, 12, 161-168. [3] Rose, E.M. and Shapiro, M.M. (1948) Statistical error in absorption experiments. Physical Review A, 74 , 1853- 1864. doi:10.1103/PhysRev.74.1853 [4] Pearson, J.J. and Osborne, R.R. (1960) Practicle nucle- onics; a course of experiments in nuclear physics. E & F.N. Spon, London. [5] Sharnabasappa, K.B.R., Anilkumar, S. and Hanumaiahm, B. (2010) Determination of X-ray mass attenuation coef- ficients using HPGe detector. Applied Radiation and Isotopes, 68, 76-83. doi:10.1016/j.apradiso.2009.08.004 [6] Kerur, B.R., Thontadarya, S.R. and Hanumaiah, B. (1993) Measurement of x-ray mass attenuation coefficients us- ing mixed radiation emitters. Indian Journal of Physics, 67, 163. [7] Gerward, L., Guilbert, N., Jensen, K.B. and Levring, H. (2001) X-ray absorption in matter Reengineering XCOM. Radiation Physics and Chemistry, 60, 23-24. doi:10.1016/S0969-806X(00)00324-8 [8] Kortright, J.B. (1986) Characteristic X-ray energies, X-ray data booklet. In: Vaughan, D. Ed., Lawrence Berkeley Laboratory, University of California, Berkeley. |