

Paper Menu >>
Journal Menu >>
 J. Biomedical Science and Engineering, 2011, 4, 391-396 doi:10.4236/jbise.2011.45049 Published Online May 2011 (http://www.SciRP.org/journal/jbise/ JBiSE ). Published Online May 2011 in SciRes. http://www.scirp.org/journal/JBiSE Computational evaluation of the dynamic minimal model for the root causes of hypoglycemia Murat Tunç, Sedat Şişbot, A. Kaya Gülkaya Yeditepe University, Engineering Faculty, System Engineering Department, Istanbul, Turkey. Received 4 March 2011; revised 20 March 2011; accepted 8 April 2011. ABSTRACT This research is an attempt to validate how glu- cose-insulin dynamic mathematical model facilitate to identify the root causes for hypoglycaemia. The purpose is to determine whether increased insulin sensitivity or increased insulin secretion causes post- prandial hypoglycemic (PPH) response, by linking experimental patient data with dynamic mathemati- cal model. For this purpose two groups, as hypogly- cemic Group 1 and non-hypoglycemic Group 2, each of which consists of 10 people, are formed. The oral glucose tolerance test (OGTT) is carried out for each person in the groups by measuring plasma glucose and insulin concentrations at every 30 minutes for a period of 5 hours. To distinguish the actual cause of hypoglycemia, the glucose minimal dynamic model is used. The model is executed in MATLAB platform using patient data and the results showed that insulin secretion is assumed to be the potential root cause for the hypoglycemia. Keywords: Simulation of Minimal Model; Evaluation of Hypoglycemia; Insulin Sensitivity Analysis 1. INTRODUCTION Diabetes Mellitus is a metabolic disorder that is charac- terized by hyperglycemia defined as fasting plasma con- centration being higher than 120 mg/dl. Approximately 3.8 million people corresponding to almost 5% of the population have diabetes in Turkey [1]. The most com- mon form of diabetes is type 2 diabetes mellitus. This disorder results from dual abnormalities of insulin resis- tance and relative insulin deficiency. The current concept is that insulin resistance forces the pancreas to produce excess insulin over time, this results a defect in insulin secretion and leads to the elevation in blood glucose (hyperglycemia). Long-term hyperglycemia triggers car- diovascular diseases, chronic renal failure, retinal dam- age and nerve damage. Hypoglycemia refers to low plasma glucose concen- tration which is associated by specific symptoms such as shakiness, nervousness, changes in awareness. Depend- ing on the population blood glucose levels below 70 mg/dl can be associated with clinical hypoglycemia. Hypoglycemia that occurs after food intake is called post-prandial hypoglycemia and this may precede the development of diabetes [2]. The goal of this study is to determine, with the help of clinical data and a convenient mathematical model, whether the individuals who exhibit post-prandial hypo- glycemia is due to increased insulin sensitivity or in- creased insulin secretion. The glucose and insulin dy- namics have long been studied by many researchers and some methodologies been developed to quantify insulin resistance and insulin secretion. Among these models the minimal model [3] which was developed by Bergman and co-workers almost three decades ago has been a pivotal study for modeling the glucose-insulin kinetics. Predicated on the minimal model, several other modified models have also been developed [4,5]. The idea of the glucose tolerance test is to challenge the homeostasis mechanism by a dose of glucose. It is assumed that the subsequent rise and fall of the blood glucose is due mainly to production of insulin in re- sponse to hyperglycaemia and that the degree of insulin response is mirrored in the behaviour of the blood glu- cose. If the glucose load is injected intravenously, it is called the intravenous glucose tolerance test (IVGTT). Another approach is called oral glucose tolerance test (OGTT) where a glucose dose is administered orally. Oral glucose tolerance test or meal glucose tolerance test is a method that can quantify insulin sensitivity under normal life condition. It is also suitable for epidemiol- ogical studies because the procedure is simple and cheap. This test has been used widely to identify the subjects who develop post-prandial hypoglycemia. Typically, these individuals have low blood glucose levels ap- proximately 3 hours after drinking the glucose. We speculated that these individuals may be susceptible to  M. Tunç et al. / J. Biomedical Science and Engineering 4 (2011) 391-396 392 hypoglycemia because they are more sensitive to the action of insulin. Alternatively, they may secrete more insulin in response to the glucose drink. The insulin sensitivity index, which quantifies insu- lin ability to control glucose production and utilization, is of primary importance in the assessment of glucose regulatory system efficiency. Quantitative evaluation of this index is usually accomplished with methods in- volving an intravenous administration of glucose and/or insulin, such as the glucose clamp or the intra- venous glucose tolerance test. Difficulty in the intra- venous administration and high (non-physiological) levels of glycamia and insulinemia achieved during these tests are limitations that need to be resolved. Measurement of insulin sensitivity from oral tests, such as a meal glucose tolerance test (MGTT) or an oral glucose tolerance test would better reflect the normal life [6]. Many authors investigated insulin sensitivity during physical activity. The effects of the physical activities on insulin sensitivity have been challenged, for example, using model predictive control based on minimal model [7] and the parameters of the model have been determined by an adaptive observer [8]. There is a rich literature about glucose and insulin dynamics. Among many dynamic model proposals, Bergman’s minimal model has attracted much attention due to its conceptual structure about the biological phe- nomena. In this study, we have used Bergman minimal model to investigate the changes in insulin sensitivity and insulin secretion during a 5-hour oral glucose toler- ance test. The minimal model is based on physiological regulation scheme such that the model uses a glucose compartment (G) and a remote insulin compartment (I) controlling the glucose flux. 2. METHOD AND DATA Oral glucose tolerance test in medical practice is the administration of glucose to determine how quickly it is cleared from the blood. The OGTT is usually used to test for diabetes, insulin resistance, and sometimes reactive hypoglycemia. The patient is instructed not to restrict carbohydrates intake in the days or weeks before the test. The test should not be done during an illness, as results may not reflect the patient’s glucose metabolism when healthy. A full adult dose should not be given to a person weighing less than 43 kg, or exaggerated glucoses may produce a false positive result. The patient should have been fasting for the previous 8 - 14 hours. Usually the OGTT is scheduled to begin in the morning as glucose tolerance exhibits a diurnal rhythm with a significant decrease in the afternoon. A zero time (baseline) blood sample is drawn. It is usually a fasting blood or fasting midstream. The patient is then given a glucose solution to drink. The standard dose is 1.75 grams of glucose per kilogram of body weight, to a maximum dose of 75 g which should be consumed within 5 minutes. Blood is drawn at half an hour intervals for measure- ment of glucose, and sometimes insulin levels. The in- tervals and number of samples vary according to the purpose of the test. For simple diabetes screening, the most important sample is the 2 hour sample and the 0 and 2 hour samples may be the only ones collected. A standard 2 hour OGTT is sufficient to diagnose or exclude all forms of diabetes mellitus at all but the earli- est stages of development. Longer tests have been used for a variety of other purposes, such as detecting reactive hypoglycemia or defining subsets of hypothalamic obe- sity. Insulin levels are sometimes measured to detect insulin resistance or deficiency. In our study, the data set consists of twenty non-diabetic, obese women who underwent OGTT. The subjects are divided into two groups, as hypoglycemic Group 1 and non-hypoglycemic Group 2, each of which consists of 10 people. The participants ingested 75 g of glucose (Glucola™) at 0 min. The blood samples were obtained at baseline and every 30 min thereafter for 5 hours. The clinical studies were executed at the University of Cali- fornia, Davis. The protocol was approved by the Institu- tional Review Board. The subjects remained supine in bed throughout the testing to avoid confounding effects of physical activity on blood glucose. The samples for glucose were col- lected in sodium fluoride containing tubes on ice. Other samples were collected either in serum separation tubes, or in EDTA or heparin containing tubes. Glucose was measured using hexokinase method in Poly-Chem Sys- tem clinical chemistry analyzer (Cortlandt Manor, NY). Insulin was measured using RIA kits from the Linco Research Inc (St. Charles, MO) with cv of 8.2%. Prior to data analysis, a glucose concentration less than 70 mg/dL was defined as hypoglycemia. The experimental plasma glucose and insulin concentrations for Group 1 and Group 2 are given separately in Figure 1. 3. MATHEMATICAL MODEL AND PARAMETER ESTIMATION The majority of mathematical models proposed in the literature were devoted to the dynamics of glucose-insulin, including Intra Venous Glucose Tolerance Test, Oral Glucose Tolerance Test and Frequently Sampled Intra- venous Glucose Tolerance Test (FSIGT) [9]. Mathe- matical models have been used to estimate the glucose disappearance and insulin-glucose dynamics in general. To represent glucose-insulin dynamics, various types of mathematical models have ben suggested. These models e C opyright © 2011 SciRes. JBiSE 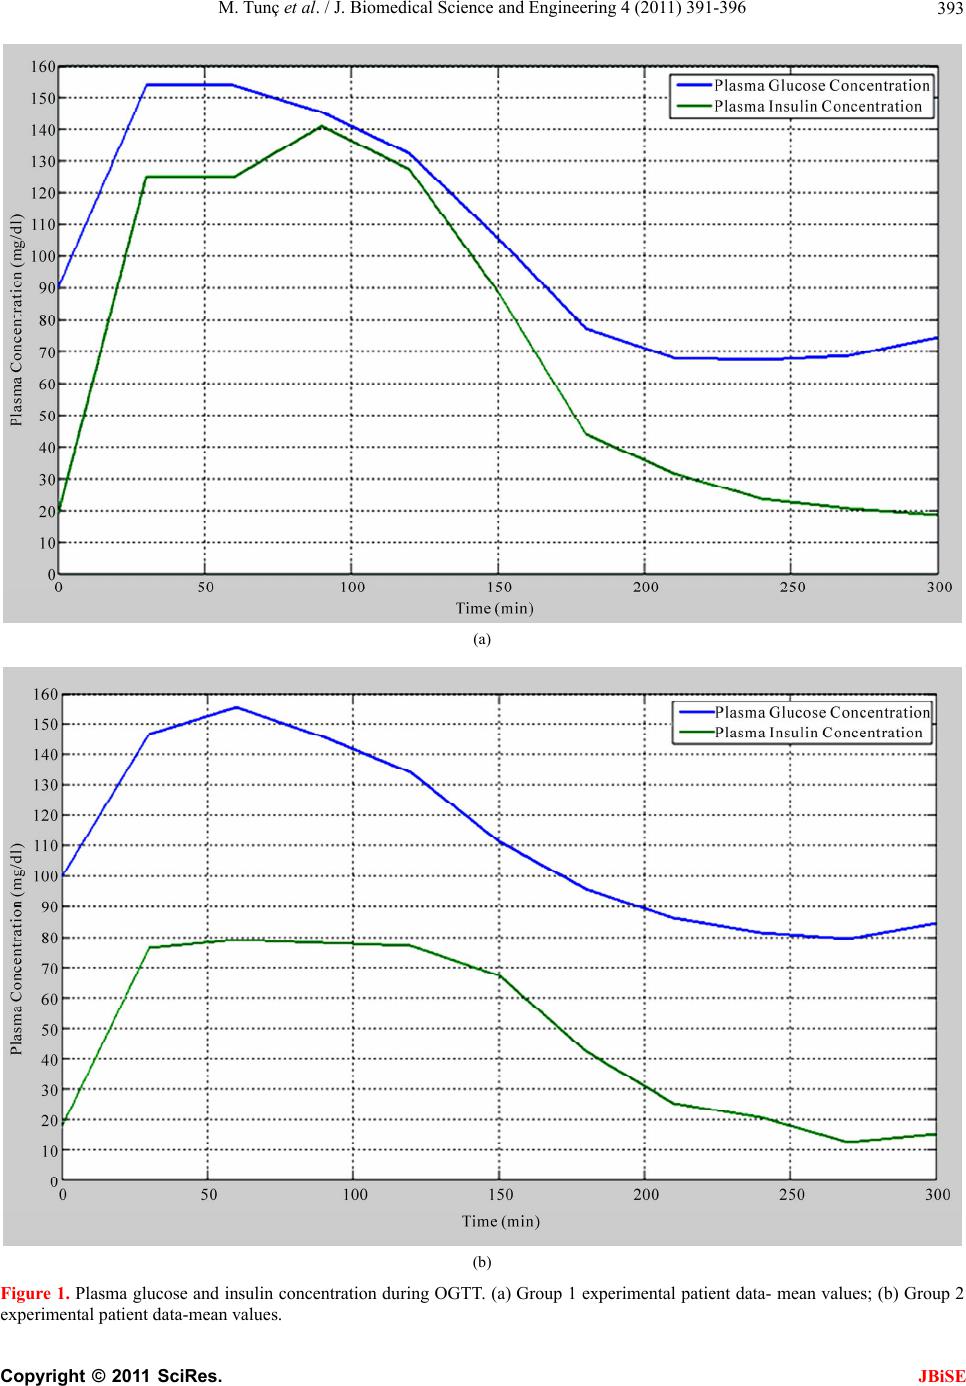 M. Tunç et al. / J. Biomedical Science and Engineering 4 (2011) 391-396 Copyright © 2011 SciRes. 393 (a) (b) Figure 1. Plasma glucose and insulin concentration during OGTT. (a) Group 1 experimental patient data- mean values; (b) Group 2 xperimental patient data-mean values. e JBiSE  M. Tunç et al. / J. Biomedical Science and Engineering 4 (2011) 391-396 394 may be classified as: 1) Ordinary differential equation (ODE) models; 2) Delay differential equation (DDE) models; 3) Partial differential equation (PDE) models; 4) Fredholm integral equation (FIE) models; 5) Stochastic differential equation (PDE) models and 6) Integro-dif- ferential equation (IDE) models [10]. In this study, we have used the minimal model developed by Bergman et al. which has found broad acceptance to evaluate the IVGTT records. To evaluate the insulin sensitivity from OGTT based on classical Bergman’s minimal model, the model of glucose absorption in the gut is coupled with the minimal model. The glucose minimal model is illustrated in Figure 2. The model consists of two differential equations. Insulin leaves or enters the interstitial tissue compartment at a rate proportional to the difference between the plasma insulin level, I(t), and the basal level, Ib; if the plasma insulin level falls below the basal level, insulin leaves the interstitial tissue compartment, and if the plasma insulin level rises above the basal level, insulin enters the interstitial tissue compartment. Insulin also disap- pears from the interstitial tissue compartment via a sec- ond pathway at a rate proportional to the amount of in- sulin in the interstitial tissue compartment. Similarly, glucose leaves or enters the plasma compartment at a rate proportional to the difference between the plasma glucose level, G(t), and the basal level, Gb; if the plasma glucose level falls below the basal level, glucose enters the plasma compartment, and if the glucose level rises above the basal level, glucose leaves the plasma com- partment. Glucose also disappears from the plasma compartment via a second pathway at a rate proportional to the amount of insulin in the interstitial tissue. The change in glucose and interstitial insulin dynam- ics can then be described as two differential equations as 1 32 d d d d b b Gt PGGtXtGt t Xt PItIPXt t (1) where P1, P2 and P3 are the system parameters and de- fined as P1: The rate of insulin independent glucose disap- pearance (min–1) P2: The constant loss rate of remote insulin degrada- tion (min–1) P3: Insulin dependent increase in tissue glucose up- take ability per unit of insulin concentration above the basal insulin [min–2 (µU/ml)–1] It should be noted that the initial conditions are as- sumed to be G(0) = G0, X(0) = 0 and I(0) = I0 For determining the insulin sensitivity the glucose clamp technique is used. Glucose clamp technique is a P 1 P 3 I(t) Plasma Insulin X(t) Interstitial Insulin G(t) Plasma Glucose X(t) Figure 2. Glucose minimal model. que that maintains a constant blood glucose level techni in human subjects by perfusion or infusion with glucose. Applying this technique, the minimal model takes the form given in Equation (2). 1i 32 nf d d d b b PG GtXtGtg t Xt PItIPXt t (2) where ginf is the infusion of glucose by a unit of volume. Eq dGt The equilibrium points can be determined by making uation (2) zero. 1i 32 0 0 be e eb GXG g PI IPX PG nf (3) Then, at the steady-state inf 1 3 inf 1 2 ebe ebeb e G P gXGPG g IIGPGG P (4) Finally, the glucose infusion rate is determined by 3 inf 1 2 eb e P g I IP GP (5) The derivative of Equation (5) yields the insulin sen- sitivity (SI) 2 3 inf 2 Iee P g SIG P (6) Equation (2) is a pair of nonlinear differential equa- tio IONS nd Table 1. ns which are solved near equilibrium point given in Equation (4) and from Equation (2) to (5) there are five parameter to be estimated, namely P1, P2, P3, Gb and Ib. MATLAB® is used for implementation and the simula- tion of the mathematical model with the patient data. These five model parameters are estimated by using a weighted Least-Squares algorithm [11]. The flowchart of the program is shown in Figure 3. 4. RESULTS AND DISCUSS The results obtained are presented in Figure 4 a C opyright © 2011 SciRes. JBiSE 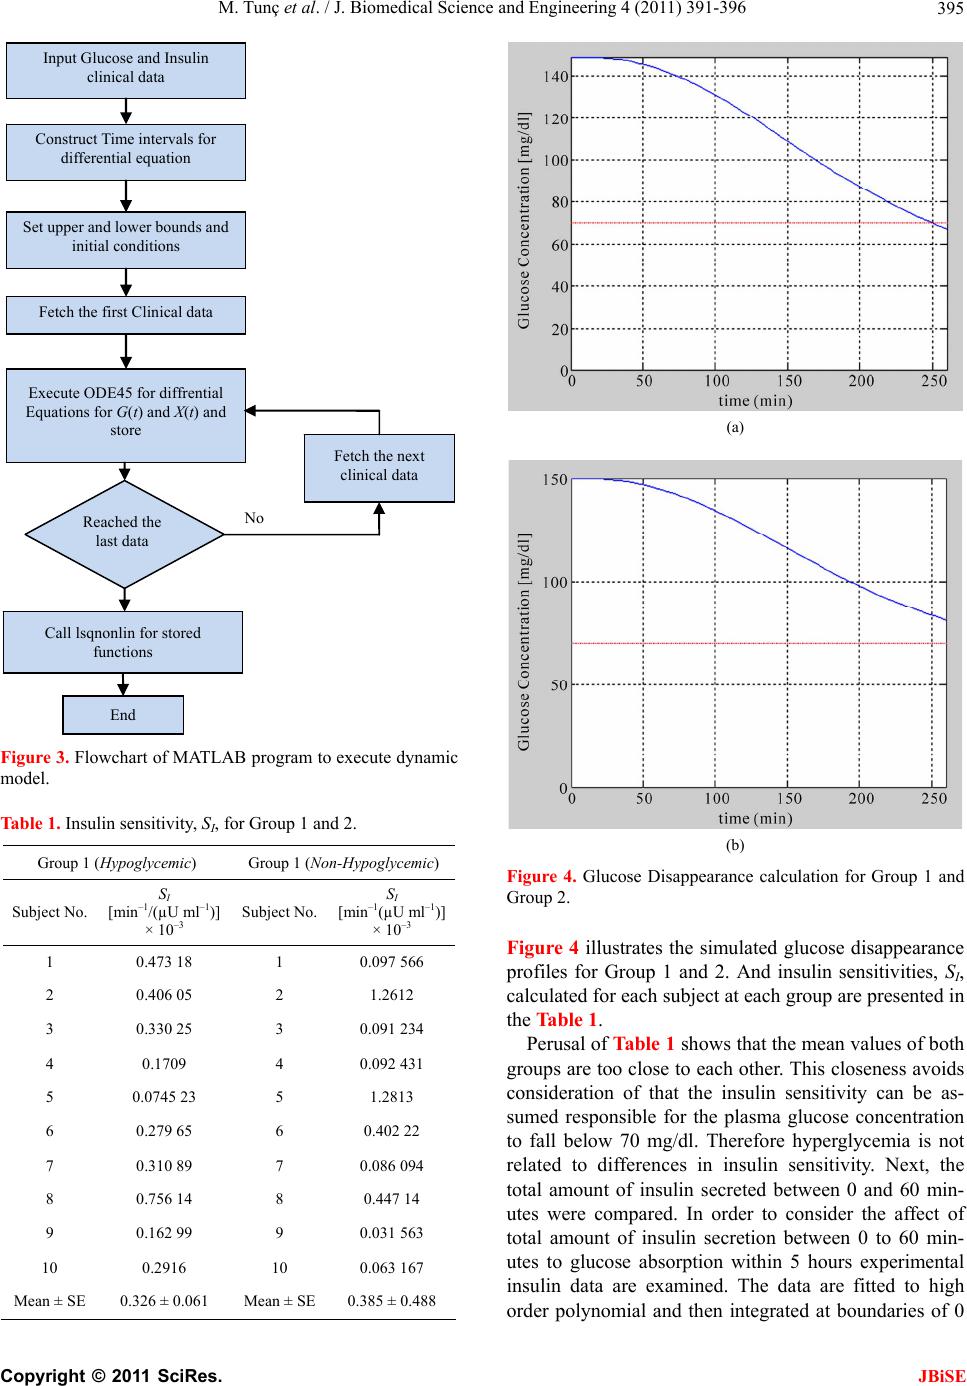 M. Tunç et al. / J. Biomedical Science and Engineering 4 (2011) 391-396 395 No Input Glucose and Insulin clinical data Construct Time intervals for differential equation Set upper and lower bounds and initial conditions Fetch the first Clinical data Execute ODE45 for diffrential Equations for G(t) and X(t) and store Reached the last data Call lsqnonlin for stored functions End Fetch the next clinical data Figure 3. Flowchart of MATLAB program to execute dynami able 1. Insulin sensitivity, SI, for Group 1 and 2. ) c model. T Group 1 (Hypoglycemic) Group 1 (Non-Hypoglycemic Subject No. [min–1/(µU ml–1)] Subject No. [min–1(µU ml–1)] SI × 10–3 SI × 10–3 1 01 0. .473 18 097 566 2 0.406 05 2 1.2612 3 0.330 25 3 (a) (b) Figure 4. Glucose Disappearlation for Group 1 and illustrates the simulated glucose disappearance ance calcu Group 2. igure 4F profiles for Group 1 and 2. And insulin sensitivities, SI, calculated for each subject at each group are presented in the Table 1. Perusal of Table 1 shows that the mean values of both gr 0 0 MeSE 0.31 MeSE 0. .091 234 4 0.1709 4 0.092 431 5 .0745 235 1.2813 6 0.279 65 6 0.402 22 7 0.310 89 7 0.086 094 8 0.756 14 8 0.447 14 9 0.162 99 9 0.031 563 10 0.2916 10 0.063 167 an ± 26 ± 0.06an ± 385 ± 0.488 oups are too close to each other. This closeness avoids consideration of that the insulin sensitivity can be as- sumed responsible for the plasma glucose concentration to fall below 70 mg/dl. Therefore hyperglycemia is not related to differences in insulin sensitivity. Next, the total amount of insulin secreted between 0 and 60 min- utes were compared. In order to consider the affect of total amount of insulin secretion between 0 to 60 min- utes to glucose absorption within 5 hours experimental insulin data are examined. The data are fitted to high order polynomial and then integrated at boundaries of 0 C opyright © 2011 SciRes. JBiSE 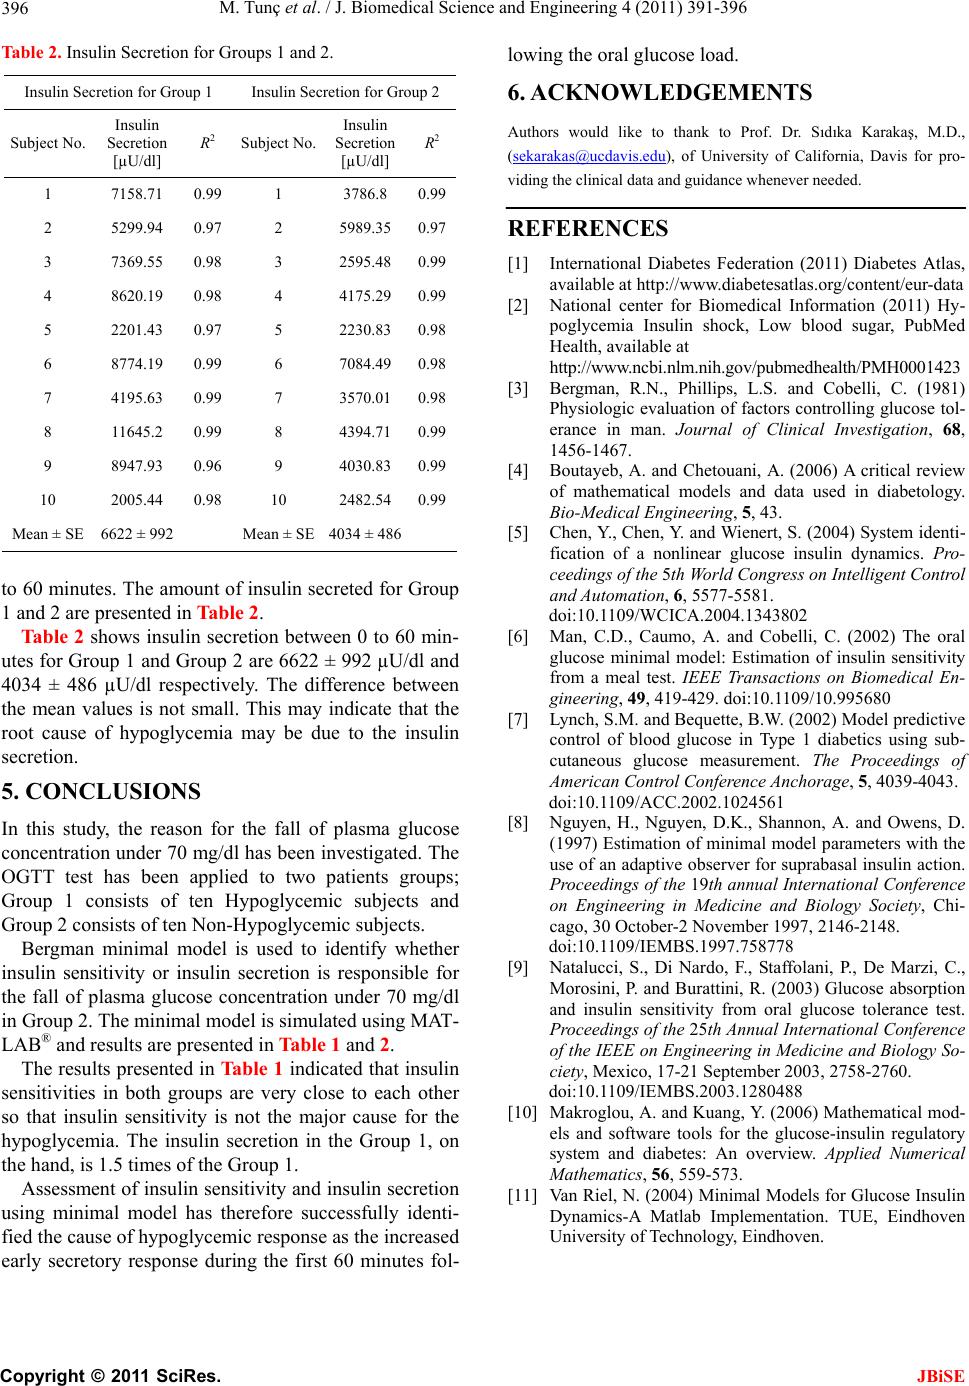 M. Tunç et al. / J. Biomedical Science and Engineering 4 (2011) 391-396 Copyright © 2011 SciRes. 396 Table 2. Insulin Secretion for Groups 1 and 2. ion for Group 2 Insulin Secretion for Group 1 Insulin Secret S Insulin S Insulin ubject No. Secretion R2 [µU/dl] ubject No. Secretion R2 [µU/dl] 1 7158.71 JBiSE 0.99 1 3786.8 0.99 2 5299.94 0.97 2 5989. 10 2005.10 Mean ± SE 6622 ± 99Mean ± SE 4034 ± 48 35 0.97 3 7369.55 0.98 3 2595.48 0.99 4 8620.19 0.98 4 4175.29 0.99 5 2201.43 0.97 5 2230.83 0.98 6 8774.19 0.99 6 7084.49 0.98 7 4195.63 0.99 7 3570.01 0.98 8 11645.2 0.99 8 4394.71 0.99 9 8947.93 0.96 9 4030.83 0.99 44 0.98 2482.54 0.99 2 6 tount ofGroup and 2 are presented in Table 2. 6622 ± 992 µU/dl 40 for the fall of plasma glucose /dl has been investigated. T for th other so uccessfully identi- fie ENTS ıdıka Karakaş, M.D., o 60 minutes. The am insulin secreted for 1 Table 2 shows insulin secretion between 0 to 60 min- utes for Group 1 and Group 2 areand 34 ± 486 µU/dl respectively. The difference between the mean values is not small. This may indicate that the root cause of hypoglycemia may be due to the insulin secretion. 5. CONCLUSIONS In this study, the reason concentration under 70 mghe OGTT test has been applied to two patients groups; Group 1 consists of ten Hypoglycemic subjects and Group 2 consists of ten Non-Hypoglycemic subjects. Bergman minimal model is used to identify whether insulin sensitivity or insulin secretion is responsible e fall of plasma glucose concentration under 70 mg/dl in Group 2. The minimal model is simulated using MAT- LAB® and results are presented in Table 1 and 2. The results presented in Table 1 indicated that insulin sensitivities in both groups are very close to each that insulin sensitivity is not the major cause for the hypoglycemia. The insulin secretion in the Group 1, on the hand, is 1.5 times of the Group 1. Assessment of insulin sensitivity and insulin secretion using minimal model has therefore s d the cause of hypoglycemic response as the increased early secretory response during the first 60 minutes fol- lowing the oral glucose load. 6. ACKNOWLEDGEM Authors would like to thank to Prof. Dr. S ([email protected]), of University of California, Davis for pro- viding the clinical data and guidance whenever needed. REFERENCES [1] International Diabetes Federation (2011) Diabetes Atlas, ih.gov/pubmedhealth/PMH0001423 . and Chetouani, A. (2006) A critical review System identi- 02 [6] C. (2002) The oral redictive [8] non, A. and Owens, D. [9] lani, P., De Marzi, C., [10] ) Mathematical mod- l Models for Glucose Insulin available at http://www.diabetesatlas.org/content/eur-data [2] National center for Biomedical Information (2011) Hy- poglycemia Insulin shock, Low blood sugar, PubMed Health, available at http://www.ncbi.nlm.n [3] Bergman, R.N., Phillips, L.S. and Cobelli, C. (1981) Physiologic evaluation of factors controlling glucose tol- erance in man. Journal of Clinical Investigation, 68, 1456-1467. [4] Boutayeb, A of mathematical models and data used in diabetology. Bio-Medical Engineering, 5, 43. [5] Chen, Y., Chen, Y. and Wienert, S. (2004) fication of a nonlinear glucose insulin dynamics. Pro- ceedings of the 5th World Congress on Intelligent Control and Automation, 6, 5577-5581. doi:10.1109/WCICA.2004.13438 Man, C.D., Caumo, A. and Cobelli, glucose minimal model: Estimation of insulin sensitivity from a meal test. IEEE Transactions on Biomedical En- gineering, 49, 419-429. doi:10.1109/10.995680 [7] Lynch, S.M. and Bequette, B.W. (2002) Model p control of blood glucose in Type 1 diabetics using sub- cutaneous glucose measurement. The Proceedings of American Control Conference Anchorage, 5, 4039-4043. doi:10.1109/ACC.2002.1024561 Nguyen, H., Nguyen, D.K., Shan (1997) Estimation of minimal model parameters with the use of an adaptive observer for suprabasal insulin action. Proceedings of the 19th annual International Conference on Engineering in Medicine and Biology Society, Chi- cago, 30 October-2 November 1997, 2146-2148. doi:10.1109/IEMBS.1997.758778 Natalucci, S., Di Nardo, F., Staffo Morosini, P. and Burattini, R. (2003) Glucose absorption and insulin sensitivity from oral glucose tolerance test. Proceedings of the 25th Annual International Conference of the IEEE on Engineering in Medicine and Biology So- ciety, Mexico, 17-21 September 2003, 2758-2760. doi:10.1109/IEMBS.2003.1280488 Makroglou, A. and Kuang, Y. (2006 els and software tools for the glucose-insulin regulatory system and diabetes: An overview. Applied Numerical Mathematics, 56, 559-573. [11] Van Riel, N. (2004) Minima Dynamics-A Matlab Implementation. TUE, Eindhoven University of Technology, Eindhoven. |