

Paper Menu >>
Journal Menu >>
 World Jour nal of Condensed Matter Physics, 2011, 1, 24-32 doi:10.4236/wjcmp.2011.12005 Published Online May 2011 (http://www.SciRP.org/journal/wjcmp) Copyright © 2011 SciRes. WJCMP Growth and Characteriz ation of Novel System of Nanoparticles Embedded in Phosphate Glass Matrix Wageh Swelm1, Anwar Higazy2, Mohammed Algradee2,3 1Physics and Engineering Mathematics Department, Faculty of Electronic Engineering, Menufiya University, Menouf, Egypt; 2Department of Physics, Faculty of Science, Menoufia University, Shebin El-Koom, Egypt; 3Department of Physics, Faculty of Science, Ibb University, Ibb, Yemen. Email: [email protected] Received March 7th, 2011; revised March 22nd, 2011; accepted March 25th, 2011. ABSTRACT We present a study of growth of a novel system of CdTe nanoparticles embedded in sodium/lithium-mixed phosphate glass matrix in a strong quantum confinement regime. The prepared systems are characterized by differential thermal analysis, X-ray diffraction, TEM, optical absorption, infrared and Raman Spectroscopy. We have investigated the effect of glass matrix composition and annealing time on the growth mechanism of the CdTe semiconductor nanoparticles. We found that the decrease in Na2O content and addition of ZnO to the glass composition is strongly affecting the nanopar- ticles formation and capping surface of the nanoparticls. On the other hand, we have calculated the size of nanopar- ticles by effective mass approximation (EMA ) and empirical method based on tight binding approximation and found that the calculation based on tight binding approximation are very plausible than that one calculated by EMA. Keywords: Semiconductor Nanoparticles, CdTe, Infrared and optical Spectroscopy 1. Introduction Semiconductor nanoparticles have received considerable attention in the field of material science research due to their unique optical and electronic properties. These unique properties like the enhancement in the lumines- cence properties of semiconductor nanoparticles, with high spectral purity and excellent fluorescence efficien- cies. Another advantage comes from the size-tunability of their emission and absorption. The colour of absorp- tion and emission can be tuned just by changing the size of the nanocrystals, without any changes in composition or stoichiometry. These properties make nanoparticles a very attractive material for many applications. The unique in optical properties of the nanoparticles comes from the quantum confinement effects w hich ari se when the size of the semiconductor have dimensions of 10 nanometers or less [1-3]. In this framework a number of researches have been dedicated to the fabrication of small semiconductor nanocrystals in different type of dielectric matrices either solids or liquid s [4-8]. Specifically, II-VI semiconductor nanoparticles have attracted much attention due to both their unique proper- ties brought by the three dimensional quantum confine- ments and their potential for photonic applications as optical devices [9-11]. CdTe is one of the II-VI semi- conductor nanocrystals which have a large exciton Bohr diameter ∼ 15 nm, and therefore it offers the possibility of studying quantum confinement effects in higher clus- ter size regimes. Up to now very rare work are published about the glass matrices doped with CdTe nanocrystals [12-18]. Therefore, it is desired to develop new glasses with semiconducting nanocrystals of will controlled size, size distribution and content, which may extended the appli- cation of these composite to the new era of optical func- tion devices. In view of this, we have prepared a novel system of nanoparticles embedded in glass. To the best of our knowledge, CdTe nanocrystal embedded in so- dium/lithium-mixed phosphate glass matrix has not been reported yet. Our nanoparticles doped sodium/lithium- mixed phosphate glass matrix begun in 2008 [19] and 2009 [20], and we have studied the growth of CdSe and PbSe nanocrystals in this glass matrix through optical absorption, X-ray diffraction and infrared spectroscopy  Growth and Characterization of Novel System of Nanoparticles Embedded in Phosphate Glass Matrix Copyright © 2011 SciRes. WJCMP 25 techniques. In this work, it is intended to study the growth of CdTe quantum dots in P2O5–Na2O–Li2O and P2O5–Na2O–ZnO–Li2O glass matrices. We have studied the effect of glass composition and annealing time on the growth of nanoparticles. The prepared samples characte- rized by differential thermal analysis, X-ray diffraction, TEM, optical absorption spectroscopy, Infrared spec- troscopy and Raman Spectroscopy. 2. Preparation In this work we have prepared a new system of CdTe nanoparticles embedded in phosphate glass matrix. There are some problems for the preparation of nanoparticles embedded in glass. Among these problems the low solu- bility of semiconductor in the melted glass matrix which lead to low concentration of the nanoparticles in the glass matrix. The melting point of the glass also is very im- portant for reducing the loss of semiconductor elements. As the melting point is dependent on the component of glass matrices so the choices of these elements are very important. To avoid these problems we have chosen a glass matrix with melting temperature ∼ 1100˚C, which is less than about 500˚C in analogies with silicate glass matrices. We have prepared two systems with different compositions of glass matrix. These two systems are P2O5–Na2O–Li2O-2wt% CdO-2wt%Te and P2O5–Na2O– ZnO–Li2O-2wt% CdO-2wt%Te. On the preparation of the second system P2O5–Na2O–ZnO–Li2O-2wt% CdO -2wt%Te, we have added 7 % of ZnO on the expense of Na2O. We have calculated the amounts of consisting components (P2O5, Na2O, ZnO and Li2O) using the mo- lecular formula of glass. Hereafter, we call the two sys- tems P2O5–Na2O–Li2O-2wt% CdO-2wt%Te and P2O5– Na2O–ZnO–Li2O-2wt% CdO-2wt %Te as S1 and S2, respectively. The raw materials used in preparation are Li2CO3, Na2CO3, ZnO, P2O5, CdO and Te reagent grades. The raw materials were weighted, mixed and stirred me- chanically many times to obtain homogeneous mixture. The mixture has put in porcelain crucibles and inserted in an electric furnace held at 250˚C for 1 h. This process of heat treatment allows the P2O5 decompose and react with other raw materials before melting. Then the mixtures have transferred to a second furnace which held at 1100˚C for 15 min for melting (the melting temperature is depending on the composition of the base glass). Then the melt has poured into two mild steel split mould pre- viously heated to 210˚C. Then the samples immediately transferred to an annealing furnace held at 210˚C, only for 1 min then the composite was allowed to cool gr adu- ally to room temperature to relieve excess internal stress in the glass base and to initiate the nucleation and growth of the nanoparticles. This adopted method allows pro- ducing samples with small nanoparticles and narrow size distribution embedded in the glass matrix, hereafter we call these samples as quenched. In view of a study of thermal anne aling of our samples, we have also performed a prior analysis of the composite versus temperature. A deferential thermal analysis mea- surement (DTA) for as quenched S2 sample is shown in Figure 1. DTA allow us to identify the glass transition temperature (Tg), onset crystallization temperature (Tx) and crystallization peak temperature (Tp). We have found the values of Tg, Tx, and Tp are 270, 499 and 511˚C, re- spectively. According to these result we have treated the produced samples at 350˚C for different time periods to grow different size of nanoparticles. The samples have been kept in desiccator to prevent possible attack by moisture. Some samples were polished to optical quality for optical measurements. For this purpose, ethylengly- cole have been used to avoid the selective removal of any components from the surface layer. 3. Characterization The obtained composites were characterized by different techniques. Thermal properties were studied using Shi- madzu DTA-50 in a platinum crucible and nitrogen flux with flow rate of 10 ml/min−1 to determine glass transi- tion temperature, (Tg), crystallization onset temperature, (Tx), and crystallization peak temperature, (Tp). The X-ray analysis was performed on a Philips Pw1373 X-ray diffractometer with Cu radiation (λ = 1.542 ºA) and Ni filter operated at 36 kV and 20 mA with a scan- ning rate of 2 deg min−1 in the angular range 20 to 70˚. The optical absorption spectra were recorded using a UV-VIS spectrophotometer (Unico UV-VIS double beam model 4862, USA) in the spectral range 200 - 1000 nm at room temperature. The morphology of the samples and particle distribution were characterized by JEOL Figure 1. DTA curve of the as quenched S2 sample. The large difference between the onset crystallization tempera- ture and glass transition (241˚C) will be promise for further annealing attempts as future work. 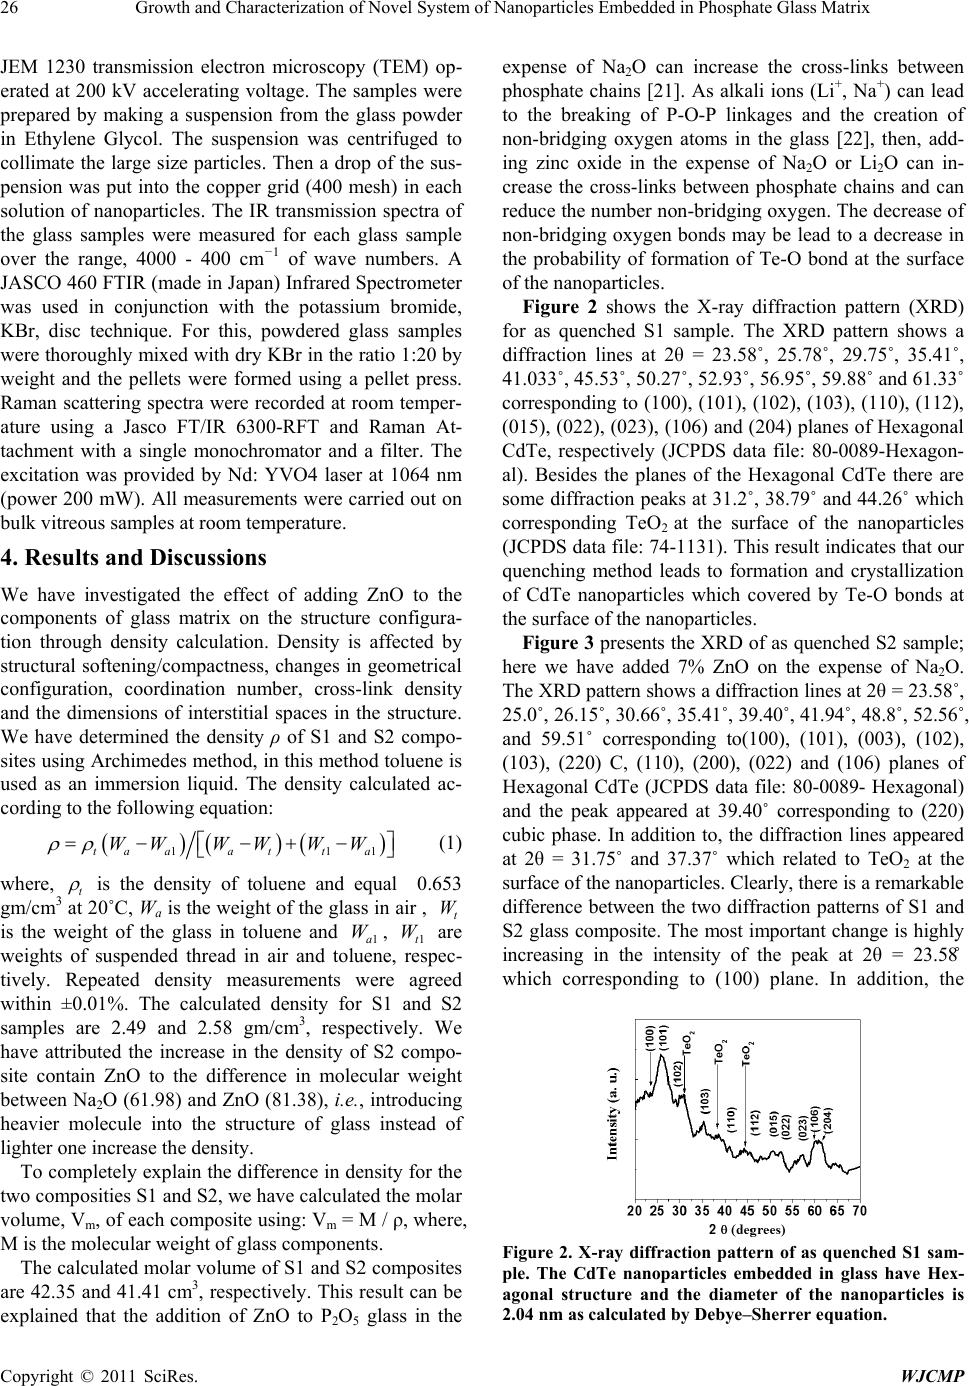 26 Growth and Characterization of Novel System of Nanoparticles Embedded in Phosphate Glass Matrix Copyright © 2011 SciRes. WJCMP JEM 1230 transmission electron microscopy (TEM) op- erated at 200 kV accelerating voltage. The samples were prepared by making a suspension from the glass powder in Ethylene Glycol. The suspension was centrifuged to collimate the large size particles. Then a drop of the sus- pension was put into the copper grid (400 mesh) in each solution of nanoparticles. The IR transmission spectra of the glass samples were measured for each glass sample over the range, 4000 - 400 cm−1 of wave numbers. A JASCO 460 FTIR (made in Japan) Infrared Spectrometer was used in conjunction with the potassium bromide, KBr, disc technique. For this, powdered glass samples were thoroughly mixed with dry KBr in the ratio 1:20 by weight and the pellets were formed using a pellet press. Raman scattering spectra were recorded at room temper- ature using a Jasco FT/IR 6300-RFT and Raman At- tachment with a single monochromator and a filter. The excitation was provided by Nd: YVO4 laser at 1064 nm (power 200 mW). All measurements were carried out on bulk vit re o us sample s at room temperature. 4. Results and Discussions We have investigated the effect of adding ZnO to the components of glass matrix on the structure configura- tion through density calculation. Density is affected by structural softening/compactness, changes in geometrical configuration, coordination number, cross-link density and the dimensions of interstitial spaces in the structure. We have determined the density ρ of S1 and S2 compo- sites using Archimedes method, in this method toluene is used as an immersion liquid. The density calculated ac- cording to the following equation: ()() () 1 11ta aa tta WWWWWW ρρ =−−+ − (1) where, t ρ is the density of toluene and equal 0.653 gm/cm3 at 20˚C, Wa is the weight of the glass in air , t W is the weight of the glass in toluene and 1a W , 1t W are weights of suspended thread in air and toluene, respec- tively. Repeated density measurements were agreed within ±0.01%. The calculated density for S1 and S2 samples are 2.49 and 2.58 gm/cm3, respectively. We have attributed the increase in the density of S2 compo- site contain ZnO to the difference in molecular weight between Na2O (61.98) and ZnO (81.38), i.e. , introducing heavier molecule into the structure of glass instead of lighter one increase the density. To completely explain the difference in density for the two composities S1 and S2, we have calculated the molar volume, Vm, of each composite using: Vm = M / ρ, where, M is the molecular weight of glass components. The calculated molar volume of S1 and S2 composites are 42.35 and 41.41 cm3, respectively. This result can be explained that the addition of ZnO to P2O5 glass in the expense of Na2O can increase the cross-links between phosphate chains [21]. As alkali ions (Li+, Na+) can lead to the breaking of P-O-P linkages and the creation of non-bridging oxygen atoms in the glass [22], then, add- ing zinc oxide in the expense of Na2O or Li2O can in- crease the cross-links between phosphate chains and can reduce the number non-bridging oxygen. The decrease of non-bridging oxygen bonds may be lead to a decrease in the probability of formation of Te-O bond at the surface of the nanopartic les. Figure 2 shows the X-ray diffraction pattern (XRD) for as quenched S1 sample. The XRD pattern shows a diffraction lines at 2θ = 23.58˚, 25.78˚, 29.75˚, 35.41˚, 41.033˚, 45.53˚, 50.27˚, 52.93˚, 56.95˚, 59.88˚ and 61.33˚ corresponding to (100), (101), (102), (103) , (110), (112), (015), (022 ), (023), (106) and (204) planes of Hexagonal CdTe, respectively (JCPDS data file: 80-0089-Hexagon- al). Besides the planes of the Hexagonal CdTe there are some diffraction peaks at 31.2˚, 38.79˚ and 44.26˚ which corresponding TeO2 at the surface of the nanoparticles (JCPDS data file: 74-1131). This result indicates that our quenching method leads to formation and crystallization of CdTe nanoparticles which covered by Te-O bonds at the surface of the nanoparticles. Figure 3 presents the XRD of as quenched S2 sample; here we have added 7% ZnO on the expense of Na2O. The XRD pattern shows a diffraction lines at 2θ = 23.58˚, 25.0˚, 26.15˚, 30.66˚, 35.41˚, 39.40 ˚, 41.94˚, 48.8˚, 52.56 ˚, and 59.51˚ corresponding to(100), (101), (003), (102), (103), (220) C, (110), (200), (022) and (106) planes of Hexagonal CdTe (JCPDS data file: 80-0089- Hexagonal) and the peak appeared at 39.40˚ corresponding to (220) cubic phase. In addition to, the diffraction lines appeared at 2θ = 31.75˚ and 37.37˚ which related to TeO2 at the surface of the nanoparticles. Clearly, there is a remarkable difference between the two diffraction patterns of S1 and S2 glass composite. The most important change is highly increasing in the intensity of the peak at 2θ = 23.58˚ which corresponding to (100) plane. In addition, the Figure 2. X-ray diffraction pattern of as quenched S1 sam- ple. The CdTe nanoparticles embedded in glass have Hex- agonal structure and the diameter of the nanoparticles is 2.04 nm as calculated by Debye–Sherrer equation. 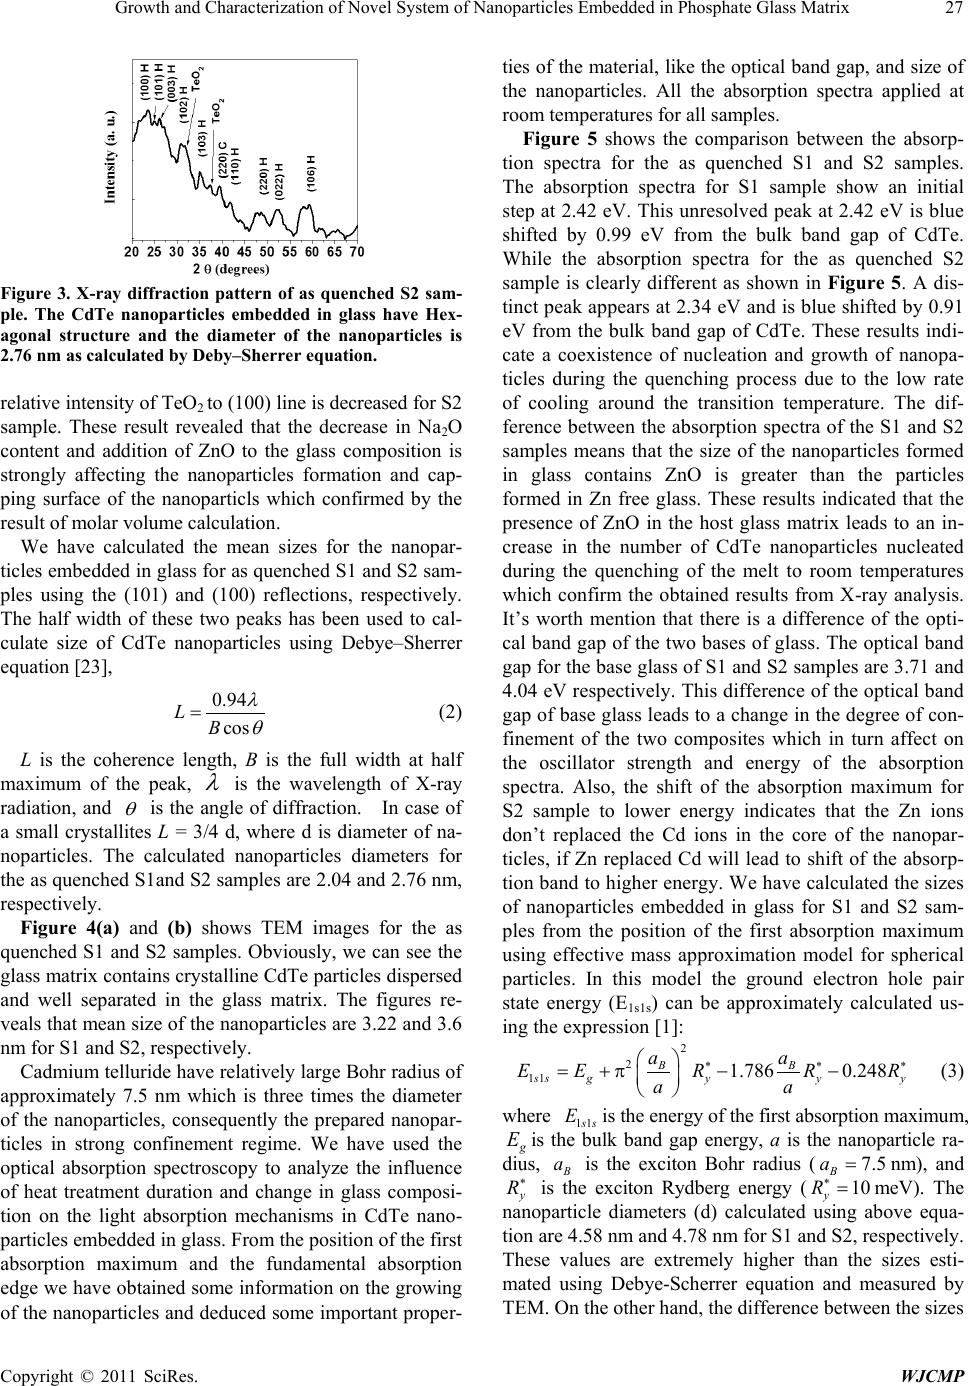 Growth and Characterization of Novel System of Nanoparticles Embedded in Phosphate Glass Matrix Copyright © 2011 SciRes. WJCMP 27 Figure 3. X-ray diffraction pattern of as quenched S2 sam- ple. The CdTe nanoparticles embedded in glass have Hex- agonal structure and the diameter of the nanoparticles is 2.76 nm as calculated by Deby–Sherrer equation. relative intensity of TeO2 to (1 00) lin e is decreased for S2 sample. These result revealed that the decrease in Na2O content and addition of ZnO to the glass composition is strongly affecting the nanoparticles formation and cap- ping surface of the nanoparticls which confirmed by the result of molar volume calculation. We have calculated the mean sizes for the nanopar- ticles embedded in glass for as quenched S1 and S2 sam- ples using the (101) and (100) reflections, respectively. The half width of these two peaks has been used to cal- culate size of CdTe nanoparticles using Debye–Sherrer equatio n [23], 0.94 cos LB λ θ = (2) L is the coherence length, B is the full width at half maximum of the peak, λ is the wavelength of X-ray radiation, and θ is the angle of diffraction. In case of a small crystallites L = 3/4 d, where d is diameter of na- noparticles. The calculated nanoparticles diameters for the as quenched S1and S2 samples are 2.04 and 2.76 nm, respectively. Figure 4(a) and (b) shows TEM images for the as quenched S1 and S2 samples. Obviously, we can see the glass matrix contains crystalline CdTe particles d ispersed and well separated in the glass matrix. The figures re- veals that mean size of the nanoparticles are 3.22 and 3.6 nm for S1 and S2, respectively. Cadmium telluride have relatively larg e Bohr radius of approximately 7.5 nm which is three times the diameter of the nanoparticles, consequently the prepared nanopar- ticles in strong confinement regime. We have used the optical absorption spectroscopy to analyze the influence of heat treatment duration and change in glass composi- tion on the light absorption mechanisms in CdTe nano- particles embedded in glass. From the position of the first absorption maximum and the fundamental absorption edge we have obtained some information on the growing of the nanoparticles and deduced some important proper- ties of the material, like the optical band gap, and size of the nanoparticles. All the absorption spectra applied at room temperatures for all samples. Figure 5 shows the comparison between the absorp- tion spectra for the as quenched S1 and S2 samples. The absorption spectra for S1 sample show an initial step at 2.42 eV. This unresolved peak at 2.42 eV is blue shifted by 0.99 eV from the bulk band gap of CdTe. While the absorption spectra for the as quenched S2 sample is clearly different as shown in Figure 5. A dis- tinct peak appear s at 2.34 eV and is b lue shifted by 0.91 eV from the bulk band gap of CdTe. These results indi- cate a coexistence of nucleation and growth of nanopa- ticles during the quenching process due to the low rate of cooling around the transition temperature. The dif- ference between the absorption spectra of the S1 and S2 samples means that the size of the nanoparticles formed in glass contains ZnO is greater than the particles formed in Zn free glass. These results indicated that the presence of ZnO in the host glass matrix leads to an in- crease in the number of CdTe nanoparticles nucleated during the quenching of the melt to room temperatures which confirm the obtained results from X-ray analysis. It’s worth mention that there is a difference of the opti- cal band gap of the two bases of glass. The optical band gap for the base glass of S1 and S2 s amples are 3.71 and 4.04 eV respectively. This difference of the optical band gap of base glass leads to a change in the degree of con- finement of the two composites which in turn affect on the oscillator strength and energy of the absorption spectra. Also, the shift of the absorption maximum for S2 sample to lower energy indicates that the Zn ions don’t replaced the Cd ions in the core of the nanopar- ticles, if Zn replaced Cd will lead to shift of the absorp- tion band to higher energy. We have calculated the sizes of nanoparticles embedded in glass for S1 and S2 sam- ples from the position of the first absorption maximum using effective mass approximation model for spherical particles. In this model the ground electron hole pair state energy (E1s1s) can be approximately calculated us- ing the expression [1 ] : 2 2 11 1.786 0.248 BB ss gyyy aa EERR R aa ∗ ∗∗ = +π−− (3) where 11ss E is the energy of the first absorption maximum, g E is the bulk band gap energy, a is the nanoparticle ra- dius, B a is the exciton Bohr radius ( 7.5 B a= nm), and y R ∗ is the exciton Rydberg energy ( 10 y R ∗ = meV). The nanoparticle diameters (d) calculated using above equa- tion are 4. 5 8 nm a nd 4.78 nm for S1 and S2, respectively. These values are extremely higher than the sizes esti- mated using Debye-Scher rer equation and measured by TEM. On the other hand, the di fference between the sizes 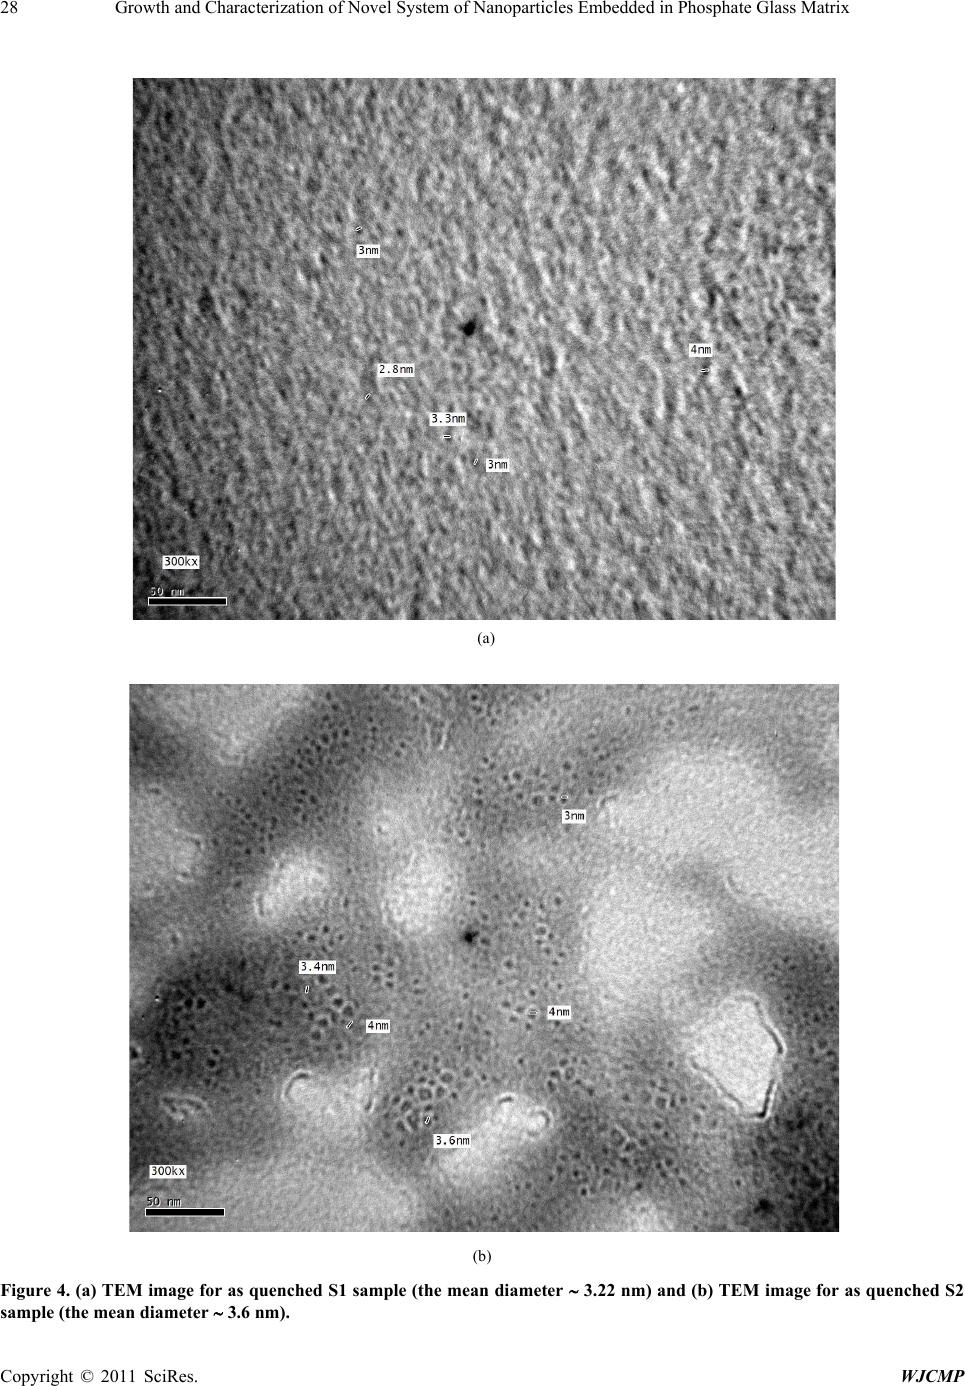 Growth and Characterization of Novel System of Nanoparticles Embedded in Phosphate Glass Matr i x Copyright © 2011 SciRes. WJCMP 28 (a) (b) Figure 4. (a) TEM image for as quenched S1 sample (the mean diameter ∼ 3.22 nm) and (b) TEM image for as quenched S2 sample (the mean diameter ∼ 3.6 nm). 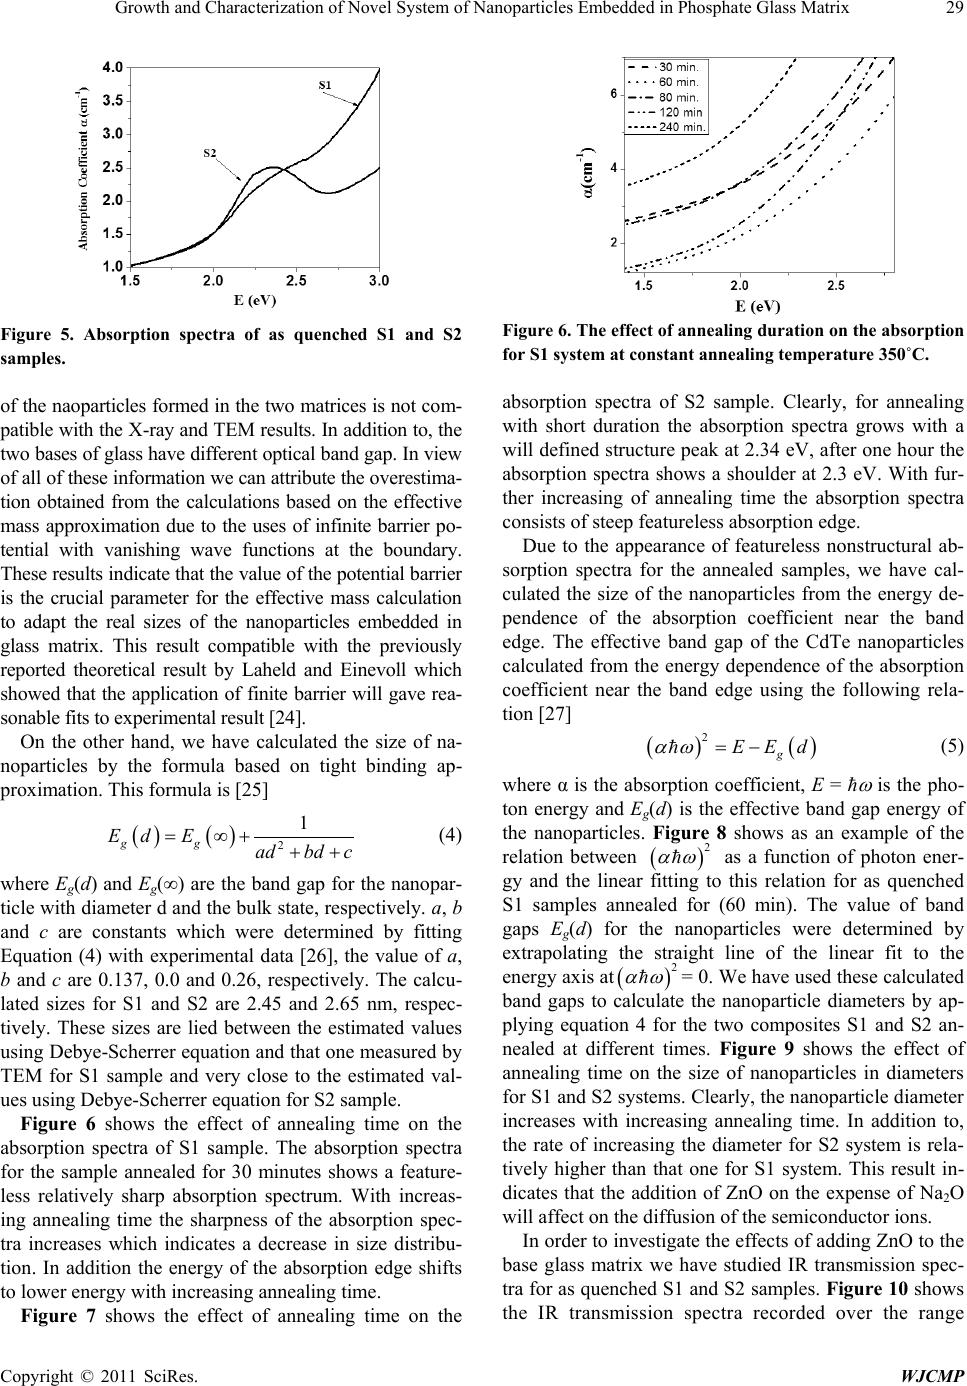 Growth and Characterization of Novel System of Nanoparticles Embedded in Phosphate Glass Matr i x Copyright © 2011 SciRes. WJCMP 29 Figure 5. Absorption spectra of as quenched S1 and S2 samples. of the naoparticles for med in the two matrices is n ot com- patible wi th the X-ray and TEM results. In addition to, the two bases of glass have different optical band gap. In view of all of these information we can attribute the overestim a- tion obtained from the calculations based on the effective mass approximation due to the uses of infinite barrier po- tential with vanishing wave functions at the boundary. These results ind icate that the value of th e potential barri er is the crucial parameter for the effective mass calculation to adapt the real sizes of the nanoparticles embedded in glass matrix. This result compatible with the previously reported theoretical result by Laheld and Einevoll which showed that the application of finite barrier will gave rea- sonable fit s to exper im ental resul t [24] . On the other hand, we have calculated the size of na- noparticles by the formula based on tight binding ap- proximation. This formula is [25] ( )() 2 1 gg Ed Eadbd c = ∞+++ (4 ) where Eg(d) and Eg(∞) are the band gap for the nanopar- ticle with diameter d and the bulk state, respectively. a, b and c are constants which were determined by fitting Equation (4) with experimental data [26], the value of a, b and c are 0.137, 0.0 and 0.26, respectively. The calcu- lated sizes for S1 and S2 are 2.45 and 2.65 nm, respec- tively. These sizes are lied between the estimated values using Deb ye -Scherrer equation and that one measured by TEM for S1 sample and very close to the estimated val- ues using Debye-Scherrer equation for S2 sample. Figure 6 shows the effect of annealing time on the absorption spectra of S1 sample. The absorption spectra for the sample annealed for 30 minutes shows a feature- less relatively sharp absorption spectrum. With increas- ing annealing time the sharpness of the absorption spec- tra increases which indicates a decrease in size distribu- tion. In addition the energy of the absorption edge shifts to lower energy with increasing annealing time. Figure 7 shows the effect of annealing time on the Figure 6. The effect of annealing duration on the absorption for S1 system at constant annealing temperature 350˚C. absorption spectra of S2 sample. Clearly, for annealing with short duration the absorption spectra grows with a will defined structure peak at 2.34 eV, after one hour the absorption spectra shows a shoulder at 2.3 eV. With fur- ther increasing of annealing time the absorption spectra consists of steep featureless absorption edge. Due to the appearance of featureless nonstructural ab- sorption spectra for the annealed samples, we have cal- culated the size of the nanoparticles from the energy de- pendence of the absorption coefficient near the band edge. The effective band gap of the CdTe nanoparticles calculated from the energy dependence of the absorption coefficient near the band edge using the following rela- tion [27] ()( ) 2 g EEd αω = − (5) where α is the absorption coefficient, E = ħ ω is the pho- ton energy and Eg(d) is the effective band gap energy of the nanoparticles. Figure 8 shows as an example of the relation between ( ) 2 αω as a function of photon ener- gy and the linear fitting to this relation for as quenched S1 samples annealed for (60 min). The value of band gaps Eg(d) for the nanoparticles were determined by extrapolating the straight line of the linear fit to the energy axis at ( ) 2 αω = 0. We have used these calculated band gaps to calculate the nanoparticle diameters by ap- plying equation 4 for the two composites S1 and S2 an- nealed at different times. Figure 9 shows the effect of annealing time on the size of nanoparticles in diameters for S1 and S2 systems. Clearly, the nanoparticle diameter increases with increasing annealing time. In addition to, the rate of increasing the diameter for S2 system is rela- tively higher than that one for S1 system. This result in- dicates that the addition of ZnO on the expense of Na2O will affect on the diffusion of the semiconductor ions. In order to investigate the effects of adding ZnO to the base glass matrix we have studied IR transmission spec- tra for as quenched S1 and S2 samples. Figure 10 shows the IR transmission spectra recorded over the range 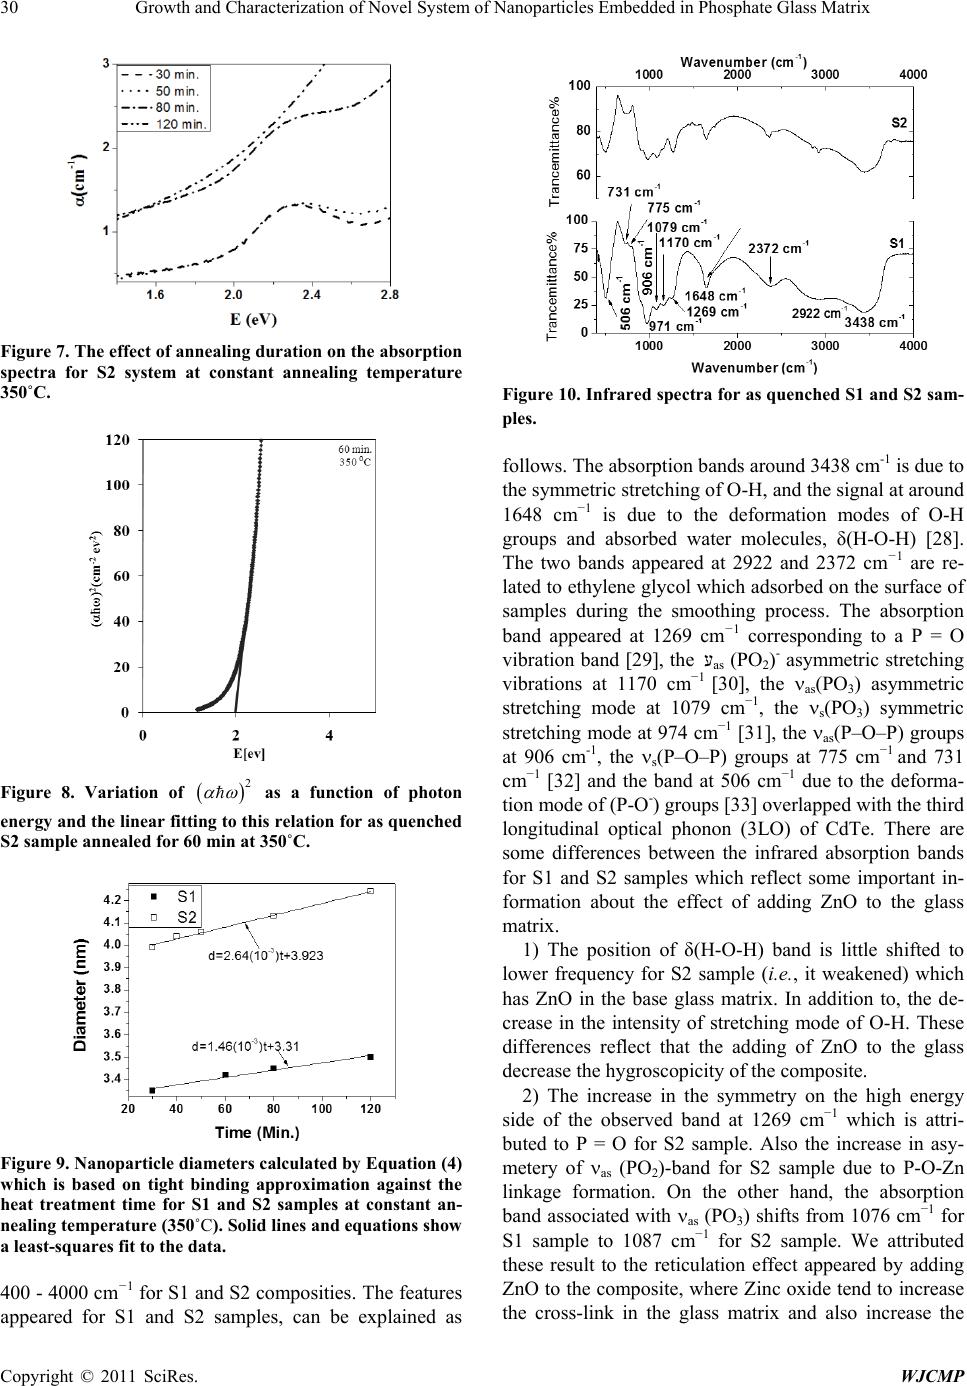 30 Growth and Characterization of Novel System of Nanoparticles Embedded in Phosphate Glass Matrix Copyright © 2011 SciRes. WJCMP Figure 7. The effect of annealing duration on the absorption spectra for S2 system at constant annealing temperature 350˚C. Figure 8. Variation of ( ) 2 αω as a function of photon energy and the linear fitting to this relation for as quenched S2 sample annealed for 60 min at 350˚C. Figure 9. Nanoparticle diameters calculated by Equation (4) which is based on tight binding approximation against the heat treatment time for S1 and S2 samples at constant an- nealing temperature (350˚C). Solid lines and equations s how a least-squares fit to the data. 400 - 4000 cm−1 for S1 and S2 composities. The features appeared for S1 and S2 samples, can be explained as Figure 10. Inf rared spectr a for as quenched S1 and S2 sam- ples. follows. The absorption bands around 3438 cm-1 is due to the symmetric stretching of O-H, and the signal at aroun d 1648 cm−1 is due to the deformation modes of O-H groups and absorbed water molecules, δ(H-O-H) [28]. The two bands appeared at 2922 and 2372 cm−1 are re- lated to ethylene glycol which adsorbed on the surface of samples during the smoothing process. The absorption band appeared at 1269 cm−1 corresponding to a P = O vibration b and [29], the עas (PO2)- asymmetric stretching vibrations at 1170 cm−1 [30], the νas(PO3) asymmetric stretching mode at 1079 cm−1, the νs(PO3) symmetric stretching mode at 974 cm−1 [31], the νas(P–O–P) groups at 906 cm-1, the νs(P–O–P) groups at 775 cm−1 and 731 cm−1 [32] and the band at 506 cm−1 due to the deforma- tion mode of (P-O-) groups [33] overlapped with the third longitudinal optical phonon (3LO) of CdTe. There are some differences between the infrared absorption bands for S1 and S2 samples which reflect some important in- formation about the effect of adding ZnO to the glass matrix. 1) The position of δ(H-O-H) band is little shifted to lower frequency for S2 sample (i.e., it weakened) which has ZnO in the base glass matrix. In addition to, the de- crease in the intensity of stretching mode of O-H. These differences reflect that the adding of ZnO to the glass decrease the hygroscopicity of the composite. 2) The increase in the symmetry on the high energy side of the observed band at 1269 cm−1 which is attri- buted to P = O for S2 sample. Also the increase in asy- metery of νas (PO2)-band for S2 sample due to P-O-Zn linkage formation. On the other hand, the absorption band associated with νas (PO3) shifts from 1076 cm−1 for S1 sample to 1087 cm−1 for S2 sample. We attributed these result to the reticulation effect appeared by adding ZnO to the composite, where Zinc oxide tend to increase the cross-link in the glass matrix and also increase the 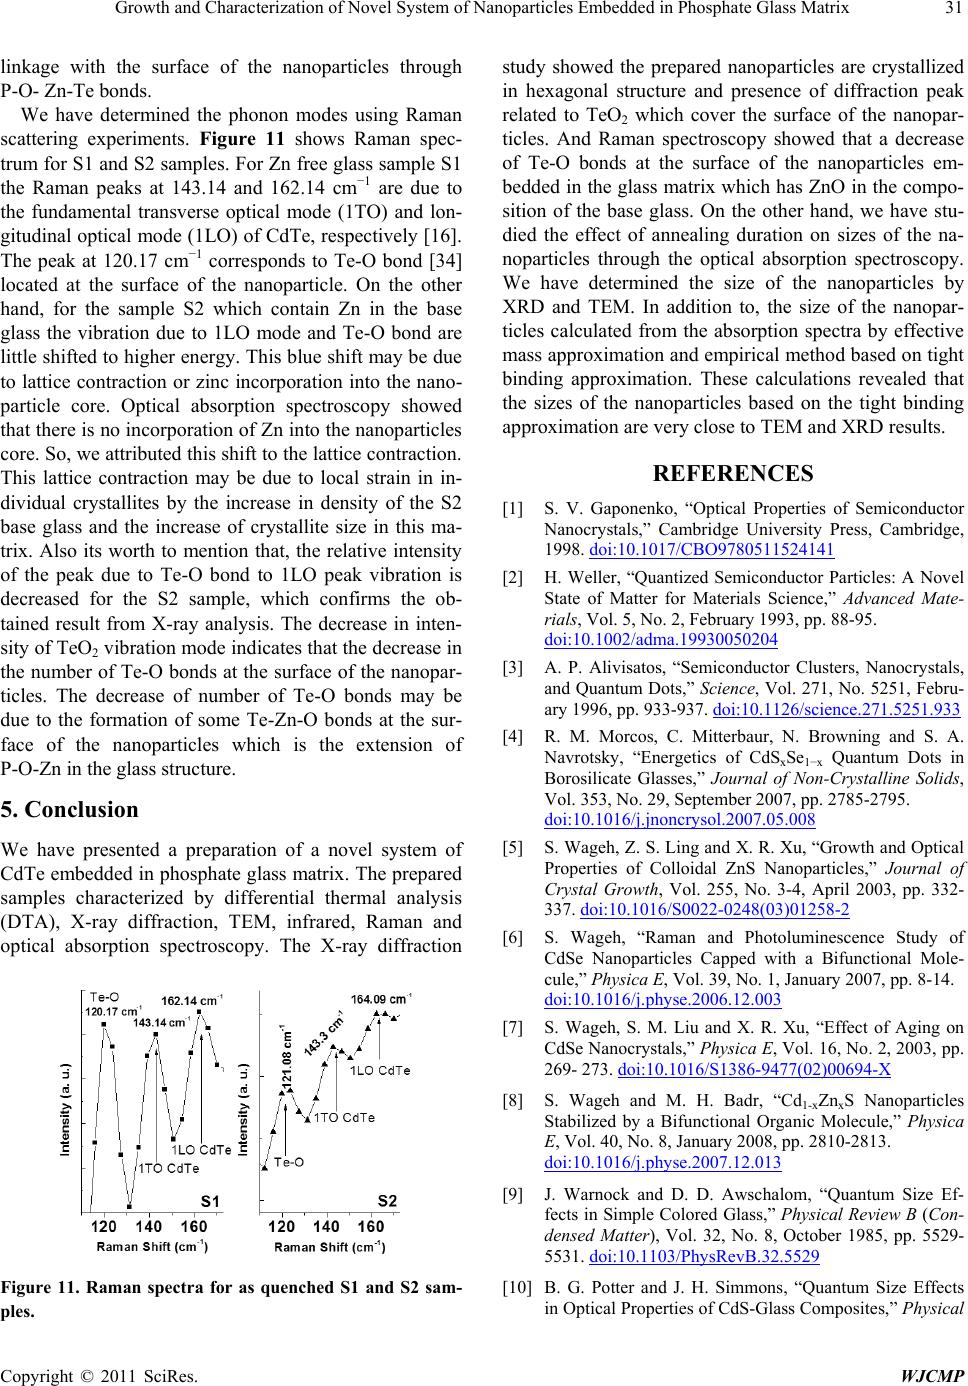 Growth and Characterization of Novel System of Nanoparticles Embedded in Phosphate Glass Matrix Copyright © 2011 SciRes. WJCMP 31 linkage with the surface of the nanoparticles through P-O- Zn-Te bonds. We have determined the phonon modes using Raman scattering experiments. Figure 11 shows Raman spec- trum for S1 and S2 samples. For Zn free glass sample S1 the Raman peaks at 143.14 and 162.14 cm−1 are due to the fundamental transverse optical mode (1TO) and lon- gitudinal optical mode (1LO) of CdTe, respectively [16]. The peak at 120.17 cm−1 corresponds to Te-O bond [34] located at the surface of the nanoparticle. On the other hand, for the sample S2 which contain Zn in the base glass the vibration due to 1LO mode and Te-O bond are little shifted to higher energy. This blue shift may be due to lattice contraction or zinc incorporation into the nano- particle core. Optical absorption spectroscopy showed that there is no incorporation of Zn into the nanoparticles core. So, we attributed this shift to the lattice contraction. This lattice contraction may be due to local strain in in- dividual crystallites by the increase in density of the S2 base glass and the increase of crystallite size in this ma- trix. Also its worth to mention that, the relative intensity of the peak due to Te-O bond to 1LO peak vibration is decreased for the S2 sample, which confirms the ob- tained result from X-ray analysis. The decrease in inten- sity of TeO2 vibration mode indicates that the decrease in the number of Te-O bonds at the surface of the nanopar- ticles. The decrease of number of Te-O bonds may be due to the formation of some Te-Zn-O bonds at the sur- face of the nanoparticles which is the extension of P-O-Zn in the glass structure. 5. Conclusion We have presented a preparation of a novel system of CdTe embedded in phosphate glass matrix. The prepared samples characterized by differential thermal analysis (DTA), X-ray diffraction, TEM, infrared, Raman and optical absorption spectroscopy. The X-ray diffraction Figure 11. Raman spectra for as quenched S1 and S2 sam- ples. study showed the prepared nanoparticles are crystallized in hexagonal structure and presence of diffraction peak related to TeO2 which cover the surface of the nanopar- ticles. And Raman spectroscopy showed that a decrease of Te-O bonds at the surface of the nanoparticles em- bedded in the glass matrix which has ZnO in the compo- sition of the base glass. On the other hand, we have stu- died the effect of annealing duration on sizes of the na- noparticles through the optical absorption spectroscopy. We have determined the size of the nanoparticles by XRD and TEM. In addition to, the size of the nanopar- ticles calculated from the absorption spectra by effective mass approximation and empirical method based on tight binding approximation. These calculations revealed that the sizes of the nanoparticles based on the tight binding approximation are very close to TEM and XRD results. REFERENCES [1] S. V. Gaponenko, “Optical Properties of Semiconductor Nanocrystals,” Cambridge University Press, Cambridge, 1998. doi:10.1017/CBO9780511524141 [2] H. Weller, “Quantized Semiconductor Particles: A Novel State of Matter for Materials Science,” Advanced Mate- rials, Vol. 5, No. 2, February 1993, pp. 88-95. doi:10.1002/adma.19930050204 [3] A. P. Alivisatos, “Semiconductor Clusters, Nanocrystals, and Quantum Dots,” Science, Vol. 271, No. 5251, Febru- ary 1996, pp. 933-937. doi:10.1126/science.271.5251.933 [4] R. M. Morcos, C. Mitterbaur, N. Browning and S. A. Navrotsky, “Energetics of CdSxSe1−x Quantum Dots in Borosilicate Glasses,” Journal of Non-Crystalline Solids, Vol. 353, No. 29, September 2007, pp. 2785-2795. doi:10.1016/j.jnoncrysol.2007.05.008 [5] S. Wageh, Z. S. Ling and X. R. Xu, “Growth and Optical Properties of Colloidal ZnS Nanoparticles,” Journal of Crystal Growth, Vol. 255, No. 3-4, April 2003, pp. 332- 337. doi:10.1016/S0022-0248(03)01258-2 [6] S. Wageh, “Raman and Photoluminescence Study of CdSe Nanoparticles Capped with a Bifunctional Mole- cule,” Physica E, Vol. 39, No. 1, January 2007, pp. 8-14. doi:10.1016/j.physe.2006.12.003 [7] S. Wageh, S. M. Liu and X. R. Xu, “Effect of Aging on CdSe Nanocrystals,” Physica E, Vol. 16, No. 2, 2003, pp. 269- 273. doi:10.1016/S1386-9477(02)00694-X [8] S. Wageh and M. H. Badr, “Cd1-xZnxS Nanoparticles Stabilized by a Bifunctional Organic Molecule,” Physica E, Vol. 40, No. 8, January 2008, pp. 2810-2813. doi:10.1016/j.physe.2007.12.013 [9] J. Warnock and D. D. Awschalom, “Quantum Size Ef- fects in Simple Colored Glass,” Physical Review B (Con- densed Matter), Vol. 32, No. 8, October 1985, pp. 5529- 5531. doi:10.1103/PhysRevB.32.5529 [10] B. G. Potter and J. H. Simmons, “Quantum Size Effects in Optical Properties of CdS-Glass Composites,” Physical  32 Growth and Characterization of Novel System of Nanoparticles Embedded in Phosphate Glass Matrix Copyright © 2011 SciRes. WJCMP Review B (Condensed Matter), Vol. 37, No. 18, June 1988, pp. 10838-10845. doi:10.1103/PhysRevB.37.10838 [11] N. F. Borrelli, D. W. Hall, H. J. Holland and D. W. Smith, “Quantum Confinement Effects of Semiconducting Mi- crocrystallites in Glass,” Journal of Applied Physics, Vol. 61, No. 12, June 1987, pp. 5399-5409. doi:10.1063/1.338280 [12] J. A. M. N eto, L. C. Barbosa, C. I. Cesar, O. L. Alves and F. Galembeck, “Quantum Size Effects on CdTexS1−x Semiconductor Doped Glass,” Applied Physics Letters, Vol. 59, No. 21, November 1991, pp. 2715-2717. doi:10.1063/1.105894 [13] L. C. Barbosa, V. C. S. Reynoso, A. M. De Paula, C. R. M. De Oliveira, O. L. Alves, A. F. Craievich, R. E. Ma- rottia, C. H. B. Cruz and C. L. Cesar, “CdTe Quantum Dots by Melt Heat Treatment in Borosilicate Glasses,” Journal of Non-Crystal Solids, Vol. 219, October 1997, pp. 205-211. doi:10.1016/S0022-3093(97)00330-X [14] M. H. Yukselici and C. Allahverdi, “Solid-Phase Precipi- tation of CdTe Nanoparticles in Glass,” Physica Status Solidi (B), Vol. 236, No. 3, March 2003, pp. 694-701. doi:10.1002/pssb.200301560 [15] A. A. Lipovskii, E. V. Kolobkova and V. D. Petrik, “Formation of II–VI Nanocrystals in a Novel Phosphate Glass,” Journal of Crystal Growth, Vol. 184-185, No. 1-2, 1998, pp. 365-369. doi:10.1016/S0022-0248(98)80077-8 [16] A. M. De Paula, L. C. Barbosa, C. H. B. Cruz, O. L. Alves, J. A. Sanjurjo and C. L. Cesar, “Size Effects on the Phonon Spectra of Quantum Dots in CdTe Doped Glasses,” Applied Physics Lette rs, Vol. 69, No. 3, July 1996, pp. 357-359. doi:10.1063/1.118059 [17] S. Wageh, A. A. Higazy, A. H. Khafagy and A. S. Eid, “Synthesis and Characterization of CdTe Nanoparticles embedded in Novel Glass Matrix,” International Journal of Anoscience, Vol. 8, No. 6, December 2009, pp. 605- 610. [18] S. Wageh, S. L. Zhao and Z. Xu, “An Optical and Struc- tural Investigation into CdTe Nanocrystals Embedded in- to the Tellurium Lithium Borophosphate Glass Matrix,” Science in China Series G: Physics, Mechanics and As- tronomy, Vol. 53, No. 5, May 2010, pp. 818-822. [19] S. Wageh, A. S. Eid, S. El-Rabaiea and A. A. Higazy, “CdSe Nanocrystals in Novel Phosphate Glass Matrix,” Physica E, Vol . 40, No. 10, Ma y 2008, pp. 3049-3054. doi:10.1016/j.physe.2008.04.008 [20] S. Wageh, M. H. Badr, M. H. Khalil and A. S. Eid, “Strong Confinement of PbSe Nanocrystals in Phosphate Glass,” Physica E, Vol. 41, No. 7, January 2009, pp. 1157-1163. doi:10.1016/j.physe.2009.01.011 [21] A. A. Higazy, B. Bridge, A. Hussein and M. A. Ewaida, “Elastic Constants and Structure of the Vitreous System ZnO-P2O5,” Journal of Acoustical Society of America, Vol. 86, No. 4, April 1989, pp. 1453-1458. doi:10.1121/1.398705 [22] Y. M. Moustafa, K. El-Egili, “Infrared Spectra of Sodium Phosphate Glasses,” Journal of Non-Crystal Solids, Vol. 240, No. 1-3, March 1998, pp.144-153. doi:10.1016/S0022-3093(98)00711-X [23] A. Guinier, ““X-Ray Diffraction In crystals, Imperfect Crystals, and Amorphous Bodies,” W. H. Freeman and Company, San Francisco and London, 1963. [24] U. E. H. Laheld and G. T. Einevoll, “Excitons in CdSe Quantum Dots,” Physical Review B, Vol. 55, No. 8, 1997, pp. 5184-5204. doi:10.1103/PhysRevB.55.5184 [25] G. Allan and C. Delerue, “Confinement Effects in PbSe Quantum Wells and Nanocrystals,” Physical Revie w B, Vol. 70, No. 24, December 2004, pp. 245321- 245330. doi:10.1103/PhysRevB.70.245321 [26] C. De Mello Donega and R. Koole, “Size Dependence of the Spontaneous Emission Rate and Absorption Cross Section of CdSe and CdTe Quantum Dots,” The Journal of Physical Chemist ry, Vol. 113, No. 16, 2009, pp. 6511- 6520. doi:10.1021/jp811329r [27] Y. Wang, A. Suna, W. Maheler and R. Kasowski, “PbS in Polymers, From Molecules to Bulk Solids,” Journal of Chemical Physics, Vol. 87, No. 12, December 1987, pp. 7315-7322. doi:10.1063/1.453325 [28] S. Cai, W. J. Zhang, G. H. Xu, J. Y. Li, D. M. Wang and W. Jiang, “Microstructural Characteristics And Crystal- lization Of CaO-P2O5-Na2O-ZnO Glass Ceramics Pre- pared By Sol-Gel Method,” Journal of Non-Crystalline Solids, Vol. 355, No. 4-5, February 2009, pp. 273-279. doi:10.1016/j.jnoncrysol.2008.11.008 [29] M. Abid, M. Et-tabirou, M. Taibi, “Structure and DC Conductivity of Lead Sodium Ultraphosphate Glasses,” Materials Science and Engineering B, Vol. 97, No. 1, January 2003, pp. 20-24. doi:10.1016/S0921-5107(02)00390-2 [30] G. Le Saoüt, P. Simon, F. Fayon, A. Blinn and Y. Vaills, “Raman and Infrared Study of (PbO)x(P2O5)(1-x) Glasses,” Journal of Raman Spectroscopy, Vol. 33, No. 9, Septem- ber 2002, pp. 740-746. [31] N. B. Colthup, L. H. Daly and S. E. Wiber ley, “Introduc- tion to Infrared and Raman Spectroscopy,” Third Edition. Academic Press, Inc., Massachusetts, 1990. [32] J. O. Byun, B. H. Kim, K. S. Hong, H. J. Jung, S. W. Lee and A. A. Izneev, “Properties and Structure of RO-Na2O-Al2O3-P2O5 (R = Mg, Ca, Sr, Ba) Glasses,” Journal of Non-Crystal Solids, Vol. 190, No. 3, October 1995, pp. 288-295. doi:10.1016/0022-3093(95)00280-4 [33] D. E. Corbridge, “Infrared Analysis of Phosphorous Compounds,” Journal of Applied Chemistry, Vol. 6, No. 10, October 1956, pp. 456-465. doi:10.1002/jctb.5010061007 [34] C. Frausto-Reyes, J. R. Molina-Contreras, C. Medina- Gutiérrez and S. Calixto, “CdTe Surface Roughness by Raman Spectroscopy Using the 830 nm Wavelength,” Spectrochimica Acta Part A: Molecular and Biomolecu- lar Spectroscopy, Vol. 65, No. 1, September 2006, pp. 51-55. doi:10.1016/j.saa.2005.07.082 |