

Paper Menu >>
Journal Menu >>
 J. Electromagnetic Analysis & Applications, 2009, 1: 102-107 doi:10.4236/jemaa.2009.12016 Published Online June 2009 (www.SciRP.org/journal/jemaa) Copyright © 2009 SciRes JEMAA 1 Dust Effect on the Performance of Wind Turbine Airfoils Nianxin Ren1,*, Jinping Ou1,2 1School of Civil Engineering, Harbin Institute of Technology, Harbin, 150090, China; 2School of Civil and Hydraulic Engineering, Dalian University of Technology, Dalian, 116024, China. Email: *[email protected] Received January 9th, 2009; revised February 23rd, 2009; accepted March 3rd, 2009. ABSTRACT The full two-dimensional Navier-Stokes algorithm and the SST k- turbulence model were used to investigate incom- pressible viscous flow past the wind turbine two-dimensional airfoil under clean and roughness surface conditions. The NACA 63-430 airfoil is chosen to be the subject, which is widely used in wind turbine airfoil and generally located at mid-span of the blade with thickness to chord length ratio of about 0.3. The numerical simulation of the airfoil under clean surface condition has been done. As a result, the numerical results had a good consistency with the experimental data. The wind turbine blade surface dust accumulation according to the operational periods in natural environment has been taken into consideration. Then, the lift coefficients and the drag coefficients of NACA 63-430 airfoil have been computed under different roughness heights, different roughness areas and different roughness locations. The role that roughness plays in promoting premature transition to turbulence and flow separation has been verified by the numeri- cal results. The trends of the lift coefficients and the drag coefficients with the roughness height and roughness area increasing have been obtained. What’s more, the critical values of roughness height, roughness area, and roughness location have been proposed. Furthermore, the performance of the airfoil under different operational periods has been simulated, and an advice for the period of cleaning wind turbine blades is proposed. As a result, the numerical simula- tion method has been verified to be economically available for investigation of the dust effect on wind turbine airfoils. Keywords: NACA 63-430 Airfois, Lift Coefficient, Drag Coefficient, Roughness Height, Roughness Area, Roughness Location 1. Introduction As is known to all, the world energy crisis is more and more serious in our modern society. Wind energy, which is the most mature technology among so many kinds of clean and renewable energy, is developing with an amazing speed now. The crucial to rotor design is the subject of airfoils. One of the most critical problem for wind turbine rotors is degradation of the performance, and the unpredictability of stall due to dust accumulation on blade surface area. The objective of this work is to provide a better understanding for the effect of blade surface roughness on the performance of the wind turbine thick airfoil. It is very useful to enable wind turbine designers to predict loads and energy losses during wind turbines operating under dust conditions, it is necessary to qualitatively and quantitatively know the change in the aerodynamic properties due to the dust accumulation on the surface of the blade. So, the analysis of airfoil surface roughness has practical application interest in addition to academic interest. Now, the importance of the dust effect on the performance of the wind turbine airfoil is well realized. Generally, roughness has a large effect on the flow dynamic processes. Therefore, the stall-regulation phe- nomena in wind turbines are affected by a high degree due to the increase of the blade surface roughness. De- spite some previous experimental and numerical work where surface roughness is involved, the information that has been obtained on this subject still remains far from complete [1-3], and the processes of boundary-layer separation and stall phenomena, which occur on the wind turbines blade in the presence of surface roughness, are not fully understood. To obtain more detailed information about the effect of the surface roughness on the lift coef- ficients and the drag coefficients of mid-span thick air- foils, the full two-dimensional Navier-Stokes algorithm and the SST k- turbulence model are used to investigate incompressible viscous flow past the wind turbine two- dimensional airfoil with surface roughness. The NACA 63-430 airfoil is chosen to be the subject, which is widely used in wind turbine airfoil and generally located at mid-span of the blade with thickness to chord length ratio 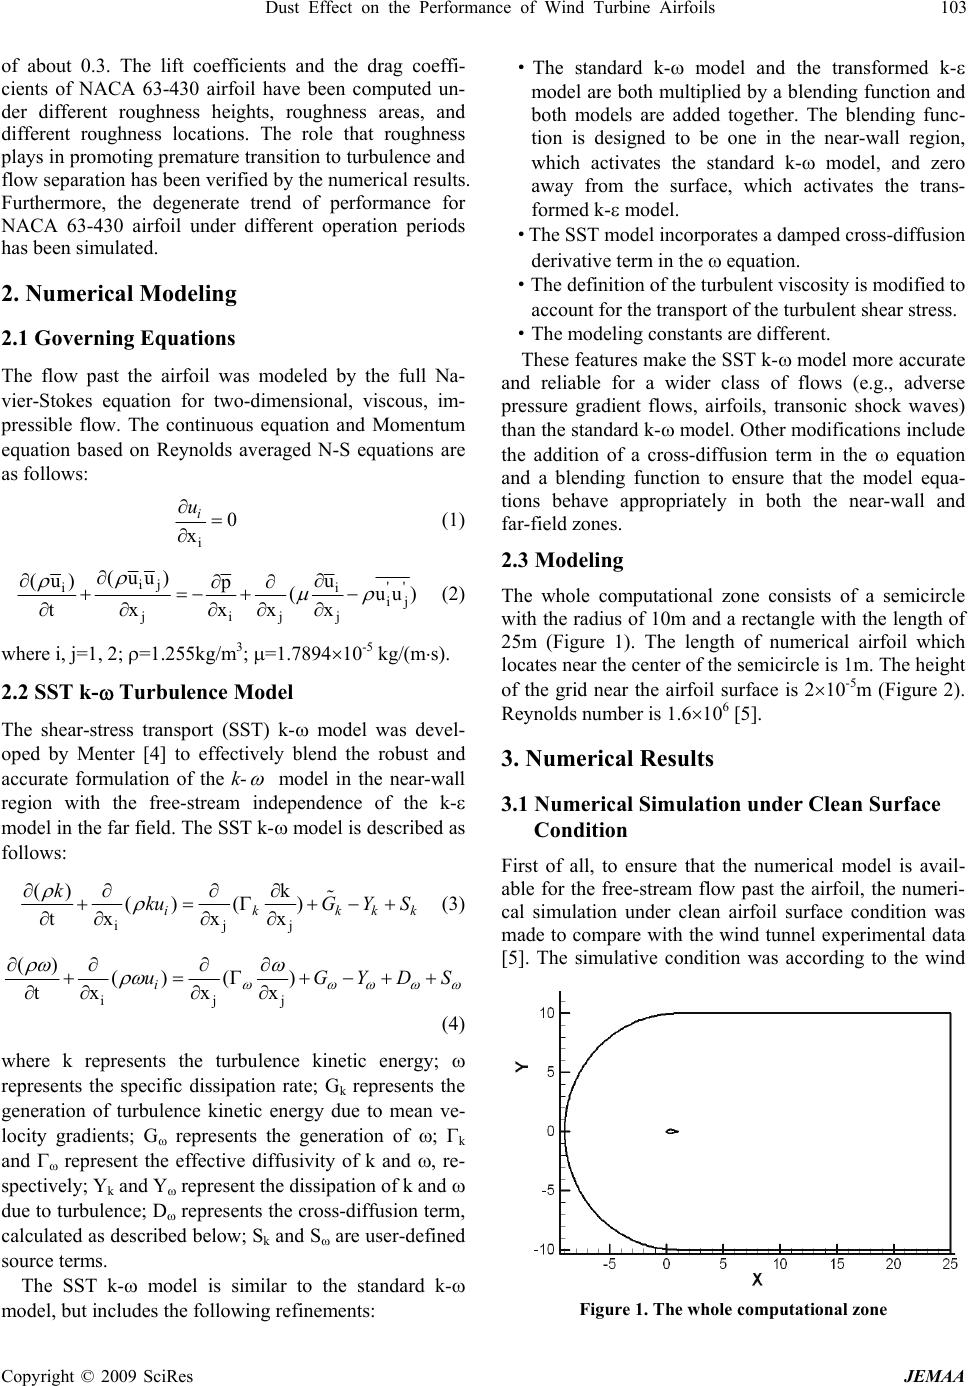 Dust Effect on the Performance of Wind Turbine Airfoils 103 of about 0.3. The lift coefficients and the drag coeffi- cients of NACA 63-430 airfoil have been computed un- der different roughness heights, roughness areas, and different roughness locations. The role that roughness plays in promoting premature transition to turbulence and flow separation has been verified by the numerical results. Furthermore, the degenerate trend of performance for NACA 63-430 airfoil under different operation periods has been simulated. 2. Numerical Modeling 2.1 Governing Equations The flow past the airfoil was modeled by the full Na- vier-Stokes equation for two-dimensional, viscous, im- pressible flow. The continuous equation and Momentum equation based on Reynolds averaged N-S equations are as follows: i 0 x i u (1) ij '' i ij jijj (uu) (u)u p(u tx xxx i u) (2) where i, j=1, 2; =1.255kg/m3; =1.789410-5 kg/(ms). 2.2 SST k- Turbulence Model The shear-stress transport (SST) k- model was devel- oped by Menter [4] to effectively blend the robust and accurate formulation of the k- model in the near-wall region with the free-stream independence of the k- model in the far field. The SST k- model is described as follows: ijj () k () () txx x ikkk kkuG YS k (3) ijj () () () txx x i uGYDS (4) where k represents the turbulence kinetic energy; represents the specific dissipation rate; Gk represents the generation of turbulence kinetic energy due to mean ve- locity gradients; G represents the generation of ; k and represent the effective diffusivity of k and , re- spectively; Yk and Y represent the dissipation of k and due to turbulence; D represents the cross-diffusion term, calculated as described below; Sk and S are user-defined source terms. The SST k- model is similar to the standard k- model, but includes the following refinements: ·The standard k- model and the transformed k- model are both multiplied by a blending function and both models are added together. The blending func- tion is designed to be one in the near-wall region, which activates the standard k- model, and zero away from the surface, which activates the trans- formed k- model. ·The SST model incorporates a damped cross-diffusion derivative term in the equation. ·The definition of the turbulent viscosity is modified to account for the transport of the turbulent shear stress. ·The modeling constants are different. These features make the SST k- model more accurate and reliable for a wider class of flows (e.g., adverse pressure gradient flows, airfoils, transonic shock waves) than the standard k- model. Other modifications include the addition of a cross-diffusion term in the equation and a blending function to ensure that the model equa- tions behave appropriately in both the near-wall and far-field zones. 2.3 Modeling The whole computational zone consists of a semicircle with the radius of 10m and a rectangle with the length of 25m (Figure 1). The length of numerical airfoil which locates near the center of the semicircle is 1m. The height of the grid near the airfoil surface is 210-5m (Figure 2). Reynolds number is 1.6106 [5]. 3. Numerical Results 3.1 Numerical Simulation under Clean Surface Condition First of all, to ensure that the numerical model is avail- able for the free-stream flow past the airfoil, the numeri- cal simulation under clean airfoil surface condition was made to compare with the wind tunnel experimental data [5]. The simulative condition was according to the wind Figure 1. The whole computational zone Copyright © 2009 SciRes JEMAA  104 Dust Effect on the Performance of Wind Turbine Airfoils Figure 2. Local amplified grids for the airfoil tunnel set-ups, for example, Reynolds number 1.6106; free stream turbulence level of 1%. The lift coefficients and the drag coefficients of the NACA 63-430 airfoil were computed under the angle of attack between 0 and 25 degree, based on the full two-dimensional Navier- Stokes algorithm and the SST k- turbulence model. The comparison between numerical results and experimental data shows in Figures 3-4. In the above two figures, it was obvious that the nu- merical results had a good consistency with the experi- mental data, despite small discrepancy in comparison of drag coefficient curves. Therefore, the numerical model was confirmed to be available for the free-stream flow past the NACA 63-430 airfoil. Then, in the following of the paper, the numerical model would be used to investi- gate the airfoil surface roughness effect. 3.2 Numerical Simulation under Different Sur- face Roughness Heights It is supposed that all the surface of the airfoil is rough- ness area and the angle of attack is 10.6 degree. That’s because at this angle of attack the numerical results have a perfect consistency with the experimental data. Then, numerical simulations of the NACA 63-430 airfoil under different surface roughness heights has been done and the results are shown in Figure 5. Figure 3. Comparison of lift coefficient curves NACA 63-430 Airfoil 0.00 0 5 Angl e) Dra Figure 4. Comparison of drag coefficient curves Figure 5. Numerical results of Cl and Cd under different roughness heights In Figure 5, it is evident that the lift coefficient curve decreased very rapidly when the roughness height is less than 0.3mm. However, the lift coefficient curve decreases very slowly when the roughness height is more than 0.3mm. The same trend of the change also happened in the drag coefficient curve, which increases very rapidly when the roughness height is less than 0.3mm, but in- creases very slowly when the roughness height is more than 0.3mm. That’s because the surface roughness plays a role in promoting premature transition to turbulence and flow separation. When the roughness height is less than 0.3mm, the effect of roughness is very obvious. But, when the roughness height is more than 0.3mm, the whole airfoil has already fully become turbulent bound- ary and at the same time the flow separation is very serious, so the effect of roughness on the performance of the airfoil seems no longer evident. Therefore, the roughness height of 0.3mm could be viewed as a roughness critical height. Besides lift coefficients information and drag coeffi- cients information of the airfoil, the numerical results contain more information of the flow past the airfoil un- NACA 63-430 Airfoil 0 0 1 0 Ro C ue .0 .2 0 0 0 1 l and Cd val .4 .6 .8 .0 .2 .00.5 1.0 ughness height(mm) Lift coefficient Drag coefficient NACA 63-430 Airfoil Lift coefficient Drag coefficient Roughness height (mm) 0.0 0.5 1.0 C1 and Cd value 1.2 1.0 0.8 0.6 0.4 0.2 0.0 NACA 63-430 Airfoil 0.0 0.2 0.4 0.6 0.8 1.0 0 Angl ) L t 1.2 1.4 510 1520 25 e of attack(degree ift coefficien Numerical results Experimental data 0 5 10 15 20 25 Angle of attack(degree) N umerical results Experimental data NACA 63-430 Airfoil Lift coefficient 1.4 1.2 0.8 0.6 0.4 0.2 0.0 0.05 0.10 0.15 0.20 0.25 51015 202 e of attack(degre g coefficient Numerical results Experimental data NACA 63-430 Airfoil N umerical results Experimental data 0 5 10 15 20 25 Angle of attack (degree) Drag coefficient 0.25 0.20 0.15 0.10 0.05 0.00 Copyright © 2009 SciRes JEMAA  Dust Effect on the Performance of Wind Turbine Airfoils 105 der different roughness conditions, which are also very useful to clarify the physical mechanism of the surface roughness effect. For example, the turbulent intensity distribution and pressure coefficient distribution of the airfoil surface are shown in Figure 6 and Figure 7, re- spectively. In Figure 6, it is clear that the turbulent intensity of the airfoil under clean condition is very small, however, with the roughness height increasing from 0 to 0.3mm, turbu- lent intensity increases very obviously, especially for the leading edge of the airfoil. In Figure 7, the area enclosed by the pressure coefficient curve of the airfoil obviously decreases with the roughness height increasing from 0 to 0.3mm, especially for the location at the front 50% of the chord length. Furthermore, the two pictures could be better to dem- onstrate and clarify that surface roughness plays a role in promoting premature transition to turbulence and flow separation. By the way, it also could be found that the increase of turbulent intensity and the change of the pressure coefficient are no longer evident when the roughness height is more than 0.3mm. Figure 6. Turbulent intensity curves under different rough- ness heights Figure 7. Pressure coefficient curves under different rough- ness heights 3.3 Numerical Simulation under Different Roughness Areas To clarify the effect of different roughness areas on per- formance of the airfoil, simulations under the angle of attack 10.6 degree and roughness height 0.3mm were done. The roughness area is denoted by the ratio of the chord length covered with roughness, which is calculated from the leading edge. The simulation results are shown in Figure 8. It is obvious that the lift coefficient curve decreases rapidly when the roughness area is less than 0.5. However, the lift coefficient curve decreases very slowly when the roughness height is more than 0.5. It can be concluded that the front 50% of the chord length more easily promotes premature transition to turbulence and flow separation. In the flowing section, further study and explanation will be given. 3.4 Numerical Simulation under Different Roughness Locations Furthermore, to see the effect of different roughness lo- cations on performance of the airfoil more clearly, simu- lations under the angle of attack 10.6 degree and rough- ness height 0.3mm have been done. The whole NACA 63-430 airfoil is averagely divided into 10 parts, and each part is with a length of 0.1m. The simulation results are shown in Figure 9. The decrease percentage of the lift coefficient is defined by: NACA 6 % 100% clean roughness decrease clean Cl Cl Cl Cl (5) From the Figure 9, it could be seen that the influence of surface roughness located at the front 50% of the chord length is more obvious than that located at the back 50% of the chord length. On one hand, it is because the roughness located at the front 50% of the chord length more easily promotes premature transition to turbulence and flow separation. On the other hand, it is also because the airfoil at font 50% of the chord length is generally thicker than that at the back 50% of the chord length. Therefore, the roughness location at 25% of the chord length had the most obvious effect, where is the location of the largest thickness. It is worth to be noticed that, when the roughness loca- tion is at the trailing edge 10% of the chord length, the lift coefficient under surface roughness condition is about 3% larger than that under clean surface condition. So, it could be concluded that properly increasing the surface roughness of trailing edge could be benefit to promote the airfoil’s lift coefficient to some degree, which has a good agreement with experimental data [6]. The conclusion would be useful for practical projects. 3-430 Airfoilclean 0 0.0 0.1 Turbulent intensity 5 0.1 5 0.2 00.2 0.40.6 0.81 x/c 0.1mm roughness 0.3mm roughness 1mm rou g hness 0 0.2 0.4 0.6 0.8 1 x/c NACA 63-430 Airfoil Turbulent intensity 0.2 0.15 0.1 0.05 clean 0.1mm roughness 0.3mm roughness 1mm roughness 0 NACA 63-430 Airfoil -2.5 0 0.20.40.60.8 1 -2 - - Pressure coefficient 1.5 -1 0.5 0 0.5 1 1.5 x/c clean 0.1mm roughness 0.3mm roughness 1mm rou g hness NACA 63-430 Airfoil 1.5 1 Pressure coefficient 0.5 0 -0.5 -1 -1.5 clean 0.1mm roughness -2 0.3mm roughness 1mm roughness -2.5 x/c Copyright © 2009 SciRes JEMAA  106 Dust Effect on the Performance of Wind Turbine Airfoils Figure 8. Lift coefficient under different roughness areas Figure 9. Lift coefficient under different roughness locations 3.5 Numerical Simulation Under Different Operational Periods In this section, considering the effect of the blade surface dust accumulation, the performance of the wind turbine NACA 63-430 airfoil under different operational periods has been studied. The relationship between surface roughness and operational period is determined by field investigation, which was done by Khalfallah [2]. Then, the roughness heights and the roughness areas under different operational periods can be calculated by the following linearization function proposed by Khalfallah, which is not taken the rain washing effect into consid- eration. As a result, the specific four operation periods are list in Table 1. 0.08 0.02 d DT (6) /25 a DT (7) where, Dd is the dust size (diameter in mm); T is length of operational period in months; Da is the dust area in per- centage of the chord length. Subsequently, the former available numerical model has been used again to investigate the performance of the NACA 63-430 airfoil under the four operation periods and the numerical results are shown in Figure 10 and Figure 11. It can be seen that, the dust effect on the performance of wind turbine airfoil is obvious when the operation pe- riod is 5months. The decrease of the lift coefficient and the increase of the drag coefficient are remarkable to a large degree, especially for the angle of attack around 13 degrees. That’s because the roughness height of the 5months operational period is 042mm, which is larger than the critical value 0.3mm. As the operation period increasing from 5months to 12.5months, the roughness area is increasing from 0.2 to 0.5, which just reaches the critical roughness area value (0.5). Therefore, the lift co- efficient further decreases to a large degree at the angle of attack less than 13 degrees. But, when the operational period is longer than 12.5 months, the change of the lift coefficient is rather small. That’s because that, when the operational period is longer than 12.5 months, the rough- ness height and roughness area both larger than the criti- cal values proposed in the previous section. As a result, the effect of the surface roughness on promoting prema- ture transition to turbulence and flow separation tends to be neglectable. NACA 63-430 Table 1. Roughness heights and roughness areas according to different wind turbine operational periods T(months) Dd (mm) Da 2.5 0.22 0.1 5 0.42 0.2 12.5 1.02 0.5 20 1.62 0.8 Figure 10. The comparison of lift coefficient curves during different operation periods -1 x/c 0% 0% 10% 20% 30% 5%15%25% 35% 45%55% 65% 75%85% 95% Cl decrease percentage NACA 3-430 6 5% 15% 25% 35% 45% 55% 65% 75% 85% 95% x/c 30% 20% 10% 0% -10% C1 decrease percentage Copyright © 2009 SciRes JEMAA  Dust Effect on the Performance of Wind Turbine Airfoils 107 Copyright © 2009 SciRes JEMAA ·The performance of NACA 63-430 airfoil is more sen- sitive to roughness location at the front 50% of the chord length than roughness location at the back 50% of the chord length. In particular, proper roughness height at the trailing edge can be benefit to promote the lift coefficient to some degree. This conclusion is very useful for the wind turbine blade designer to further improve the performance of the blade. ·Considering the dust accumulation effect, the per- formance degenerate trend of NACA 63-430 airfoil under different operation periods has been studied. As a result, the period of 3 months without any rain is proposed as the proper period of cleaning the blade surface. As a result, the numerical simulation method has been verified to be economically available for the investigation of the dust effect on the performance of the wind turbine airfoil. Figure 11. The comparison of drag coefficient curves during different operation periods In practical project, it is of great economic interest to keep the good performance of the wind turbine blade, so it is very meaningful to periodically clean the dust of the blade surface when there is no rain washing for a long time. Considering the performance degenerate trend of the wind turbine airfoil according to the operational pe- riod, the period of 3 months is proposed for the proper period of cleaning the blade surface. 5. Acknowledgments The support of the National Science Foundation of China under project No. 50538020 and the National Science and Technology Planning under project No. 2006BAJ03B00 is gratefully acknowledged. 4. Conclusions REFERENCES In this paper, the full two-dimensional Navier–Stokes algorithm and the SST k- turbulence model were used to investigate incompressible viscous flow past the wind turbine NACA 63-430 airfoil under clean and roughness surface conditions. The key findings can be summarized as follows: [1] R. Van and W. A. Timmer, “Roughness sensitivity considerations for thick rotor blade airfoils,” in 41st Aerospace Sciences Meeting, Reno, USA, pp. 472-480, 2003. [2] G. K. Mohammed and M. K. Aboelyazied, “Effect of dust on the performance of wind turbines,” Desalination, Vol. 209, No. 1-3, pp. 209-220, April 30, 2007. ·The full two-dimensional Navier-Stokes algorithm and the SST k- turbulence model have been verified to be available for predicting the performance of the wind turbine airfoil under clean and roughness surface condi- tions. The numerical results under clean surface condi- tion have a good consistency with the experimental data, despite small discrepancy in comparison of drag coeffi- cient curves. [3] W. H. Wade and P. R. Alric, “Numerical prediction of unsteady vortex shedding for large leading-edge roughness,” Computers & Fluids, Vol. 33, No. 3, pp. 405- 434, March 2004. [4] F. R. Menter, “Zonal two-equation model k–w models for aerodynamic flows,” in 24th Fluid Dynamics Conference, Orlando, Florida, 1993. [5] P. Fuglsang, I. Antoniou, and S. D. Kristian, “Wind tunnel tests of the FFA-W3-241, FFA-W3-301 and NACA 63-430 airfoils,” http://www.risoe.dk/rispubl/VEA/veapdf/ ris-r-1041.pdf. ·The lift coefficient and the drag coefficient of NACA 63-430 airfoil is influenced more obviously by the roughness height less than 0.3mm than by the roughness height more than 0.3mm. In other words, the performance of airfoils is more sensitive to small roughness height. As a result, the roughness height of 0.3mm is proposed to be roughness critical height. [6] N . S. Bao, F. E. Huo, and Z. Q. Ye, “Aerodynamic performance with roughness on wind turbine airfoil surface (in Chinese),” Acat Energiae Solars Sinca, Vol. 4, No. 8, pp. 458-462, 2005. |