

Paper Menu >>
Journal Menu >>
 Vol.3, No.4, 259-267 (2011) Natural Science http://dx.doi.org/10.4236/ns.2011.34033 Copyright © 2011 SciRes. OPEN ACCESS Stratospheric “wave hole” and interannual variations of the stratospheric circulation in late winter Evgeny A. Jadin P. P. Shirshov Institute of Oceanology, Moscow, Russia; [email protected] Received 11 November 2010; revised 20 December 2010; accepted 20 January 2011. ABSTRACT Using the monthly mean NCEP dataset, the analysis of the upward and downward propaga- tion of planetary waves was conducted by means of the three-dimensional Eliassen-Palm (EP) fluxes in the stratosphere. It is shown that the upward/downward EP fluxes are observed in different regions of the atmosphere: their well- known upward propagation takes place over North Eurasia, while the downward one revealed over North Atlantic and Canada in a region of the so-called stratospheric “wave hole”. Gen- eration of the downward wave signal may be associated with a reflection of planetary waves in the upper stratosphere. It is shown that the downward EP flux responsible for the sink of eddy energy from the stratosphere to the tro- posphere is important in late winter (Janu- ary-February) for an understanding of the stra- tosphere-troposphere coupling on the interan- nual and decadal timescales, in particular the 11-year solar cycle influence on the strato- sphere. Results presented can explain the un- usual behavior of a few winters in the Arctic stratosphere, which are outlier from the known Labitzke, van Loon’s correlations of strato- spheric parameters with the 11-year solar cycle under separation in the west/east phases of the equatorial quasi-biennial oscillation. Keywords: Stratosphere; Planetary Wave Fluxes 1. INTRODUCTION During last decade, a big attention is paid to investi- gations of the stratosphere and its linkage with the tro- posphere and weather events. It is connected with recent understanding that stratospheric processes can affect the climate change not only due to the ozone layer depletion, but also because of the stratosphere-troposphere dy- namical interaction. In addition, there is a possibility to improve the extended-range forecast of extreme weather events using stratospheric predictors [1]. The lifetime of dynamical disturbances in the stratosphere is much long- er (~ one month) than that in the troposphere (~3 - 10 days) and the downward propagation of the zonal wind, temperature and geopotential height is observed from the stratosphere to the troposphere [2]. This is a basis to improve the predictions of extreme weather events in distinct regions using stratospheric predictors. In spite of a large progress in research of the strato- sphere-troposphere coupling, the causes of the down- ward propagation of the stratospheric signal are not good understood [3]. Planetary waves responsible for the stra- tosphere-troposphere coupling can result in the down- ward signal propagation similar to that during strato- spheric warmings. However, the downward propagation of stratospheric parameters is observed not only during stratospheric warmings, but also for usual conditions in the stratosphere [4]. The two-dimensional (2D) Elias- sen-Palm flux diagnostics of planetary wave propagation and their forcing on the zonal wind can not describe the downward planetary wave signal from the stratosphere to the stratosphere because it is responsible only for the upward wave signal from the troposphere [5]. Zyulyaeva and Jadin [6], Jadin and Zyulyaeva [7] used the three- dimensional (3D) Eliassen-Palm (EP) fluxes [8] to sepa- rate the upward/downward wave signals and obtained the first direct confirmation of the downward propaga- tion of planetary waves in the stratosphere. Analysis of the monthly mean 3D vertical EP fluxes indicated the existence of the “stratospheric bridge” forming by the upward planetary wave propagation from the tropo- sphere over North Eurasia in early winter (December) and the downward wave signal from the stratosphere to the troposphere over North Atlantic and Canada in late winter (January-February). It was also shown that the interannual variations of planetary wave activity in early winter influence strongly variations of the stratospheric circulation in subsequent January. Holton and Tan [9] have shown that the warm (cold)  E. A. Jadin / Natural Science 3 (2011) 259-267 Copyright © 2011 SciRes. OPEN ACCESS 260 vortex in the Arctic stratosphere is usually observed in winter for years with the east (west) phase of the equato- rial quasi-biennial oscillation (QBO) (Holton – Tan rela- tionship). There are large difficulties in the understand- ing of the Holton – Tan relationship and its decadal vio- lation [10]. Another unresolved question is the explana- tion of an influence of the 11-year solar cycle on the stratosphere under the separation of years with the west/east phases of the QBO [11]. Labitzke and van Loon [11] indicated significant correlations (hereafter the LvL correlations) of the lower stratospheric tem- perature at North Pole with the 11-year solar cycle (SC) under the grouping of the years into the west QBO (wQBO years) and east QBO (eQBO years) categories. Relations of stratospheric and tropospheric parameters with the SC are most prominent in January-February, not in early winter and for the whole years. The small (~ 1%) solar irradiance changes from the maximum to the minimum of the 11-year SC in the spectrum absorbing by ozone cannot lead directly to such large variations of the temperature at North Pole (~ 20˚C) in the lower stratosphere [11]. These changes are larger in the solar spectrum shorter than 200 nm (~ 7%) [12], therefore, the SC radiation effects on the upper stratospheric circulation can be reasonable. Kodera et al., [13] suggested that the 11-year solar signal propagates downward into the lower stratosphere during the winter- time due to the planetary wave-zonal flow interaction resulting in a possible SC influence on the stratospheric dynamics [14,15]. However, an absence of the clear physical mechanism of the SC influence on the atmos- phere could not explain why the LvL correlations are observed mainly in late winter and why we observe more stratospheric warmings in high solar (HS) activity for the wQBO years and in low solar (LS) activity for eQBO years [16]. A possible mechanism explaining these questions was recently proposed by Jadin et al. [17] who showed that the 11-year solar cycle could modulate the downward wave signal, generating by a reflection of planetary waves in the upper stratosphere [18]. The LvL correlations are stable during last five dec- ades from late 1950’s onwards [19], however, there are a few extreme years which outlier from these correlations. The warm (cold) polar vortex in the Arctic stratosphere is usually observed in the LS (HS)/eQBO years, but very cold vortex took place in February 1997 in contrast with unusual warm vortex in February 1987 (LS/eQBO years). Most prominent violation from the LvL correlations oc- curred in February 2009 (LS/wQBO year) with the ex- treme warm vortex in the Arctic, though cold vortex was expected [20]. The aim of this study is to specify the simple physical mechanism of the stratospheric bridge [6,7,17] and ex- plain the outliers from the LvL correlations with the point of view of this mechanism. 2. DATA AND METHOD OF THE ANALYSIS The monthly mean data from NCEP/NCAR reanalysis [21] dataset were used in this study covering the years from 1958 to 2007. This atmospheric dataset has a 2.5 × 2.5 horizontal resolutions and extends from 1000 to 10 hPa with 17 vertical pressure levels. The three dimen- sional vertical Eliassen-Palm fluxes were calculated as a diagnostic tool to measure the wave activity propagation [8]. After the separation of the longitudinal disturbances, the flux deviations from the averages (anomalies) were calculated for each level and month in 1958-2007, i.e., seasonal cycle was removed. The empirical orthogonal functions (EOF) of the vertical wave flux anomalies at each standard level from 100 to 10 hPa for December, January and February were used for the analysis. 3. UPWARD AND DOWNWARD PROPAGATION OF PLANETARY WAVES The stratosphere undergoes itself large internal varia- tions on the interannual and shorter timescales, which are connected with the wave forcing on zonal flow and the accommodation to the radiation equilibrium (vacilla- tion cycle) [22]. Planetary wave forcing is usually de- scribed by means of the 2D EP flux diagnostics showing the upward wave propagation from the troposphere and its influence on the stratospheric circulation. In contrast with the 2D Eliassen-Palm fluxes, the 3D Plumb wave fluxes allow to indicate the downward propagation of planetary waves in the stratosphere even on the monthly mean timescales. Moreover, there are significant differ- ences between wave forcing in early and late winter, which are associated with the downward wave signal from the stratosphere to the troposphere [6,7]. Figure 1 shows the monthly mean vertical wave fluxes (EPz) at 30 hPa, 100 hPa and 500 hPa for Febru- ary averaged in 1959-2007. In the lower stratosphere, there are the upward wave propagation from the tropo- sphere over North Eurasia and the downward EPz flux over North Atlantic and Canada with a smaller intensity. The downward wave flux has fewer magnitudes in early winter (November-December) than that in late winter (January-February) and it is disappeared in March [6]. Upward and downward propagations of planetary waves in the stratosphere have almost barotropic structures over North Eurasia and North Atlantic and Canada (re- gion of the stratospheric “wave hole”), respectively. Such seesaw feature is pertaining to the EPz fluxes in the 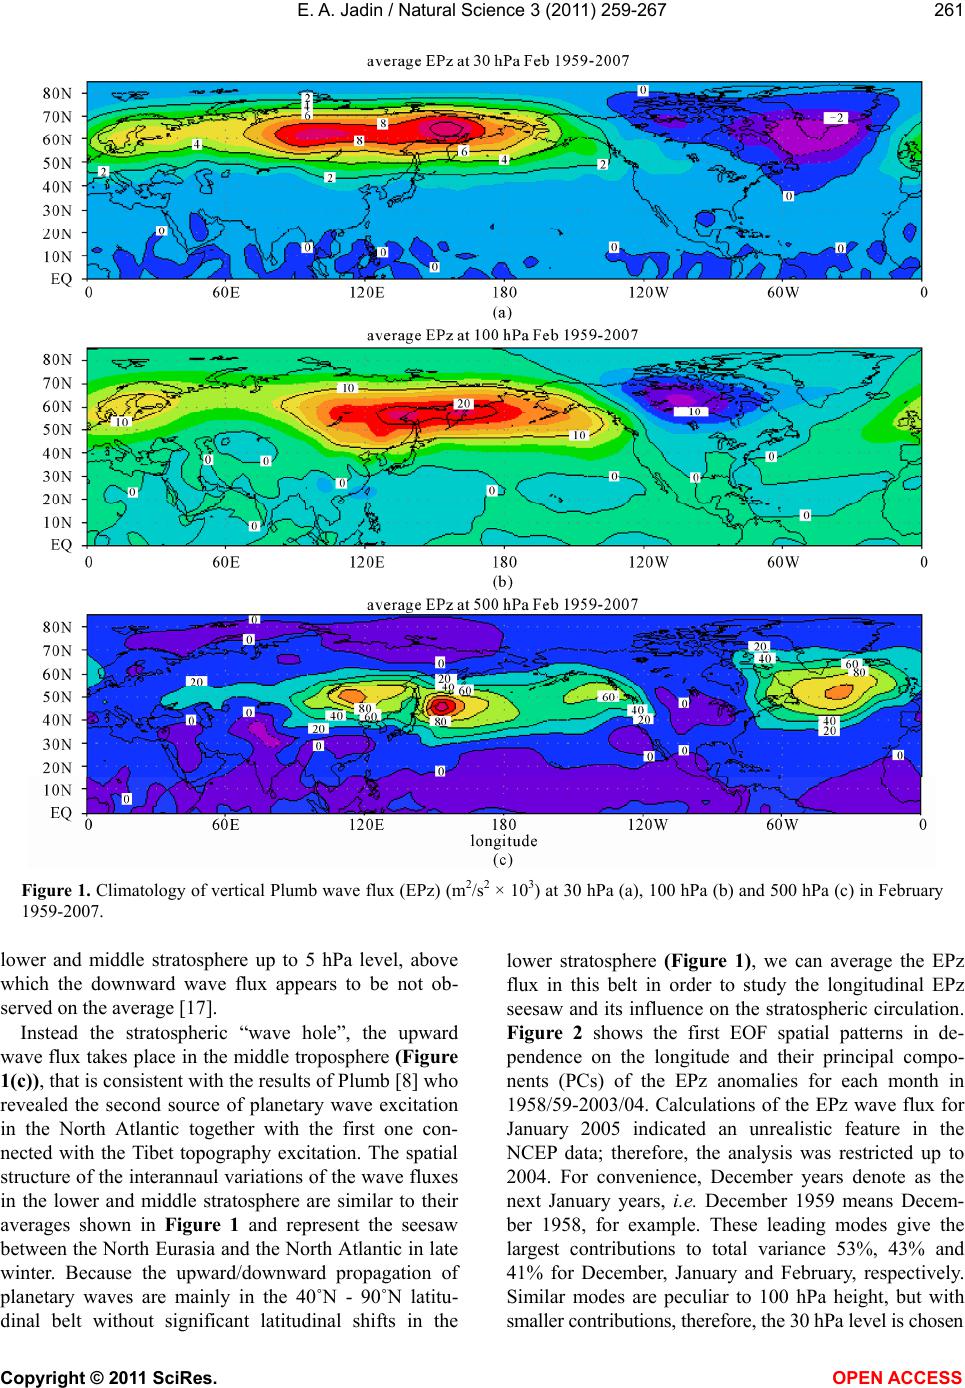 E. A. Jadin / Natural Science 3 (2011) 259-267 Copyright © 2011 SciRes. OPEN ACCESS 261 Figure 1. Climatology of vertical Plumb wave flux (EPz) (m2/s2 × 103) at 30 hPa (a), 100 hPa (b) and 500 hPa (c) in February 1959-2007. lower and middle stratosphere up to 5 hPa level, above which the downward wave flux appears to be not ob- served on the average [17]. Instead the stratospheric “wave hole”, the upward wave flux takes place in the middle troposphere (Figure 1(c)), that is consistent with the results of Plumb [8] who revealed the second source of planetary wave excitation in the North Atlantic together with the first one con- nected with the Tibet topography excitation. The spatial structure of the interannaul variations of the wave fluxes in the lower and middle stratosphere are similar to their averages shown in Figure 1 and represent the seesaw between the North Eurasia and the North Atlantic in late winter. Because the upward/downward propagation of planetary waves are mainly in the 40˚N - 90˚N latitu- dinal belt without significant latitudinal shifts in the lower stratosphere (Figure 1), we can average the EPz flux in this belt in order to study the longitudinal EPz seesaw and its influence on the stratospheric circulation. Figure 2 shows the first EOF spatial patterns in de- pendence on the longitude and their principal compo- nents (PCs) of the EPz anomalies for each month in 1958/59-2003/04. Calculations of the EPz wave flux for January 2005 indicated an unrealistic feature in the NCEP data; therefore, the analysis was restricted up to 2004. For convenience, December years denote as the next January years, i.e. December 1959 means Decem- ber 1958, for example. These leading modes give the largest contributions to total variance 53%, 43% and 41% for December, January and February, respectively. Similar modes are peculiar to 100 hPa height, but with smaller contributions, therefore, the 30 hPa level is chosen 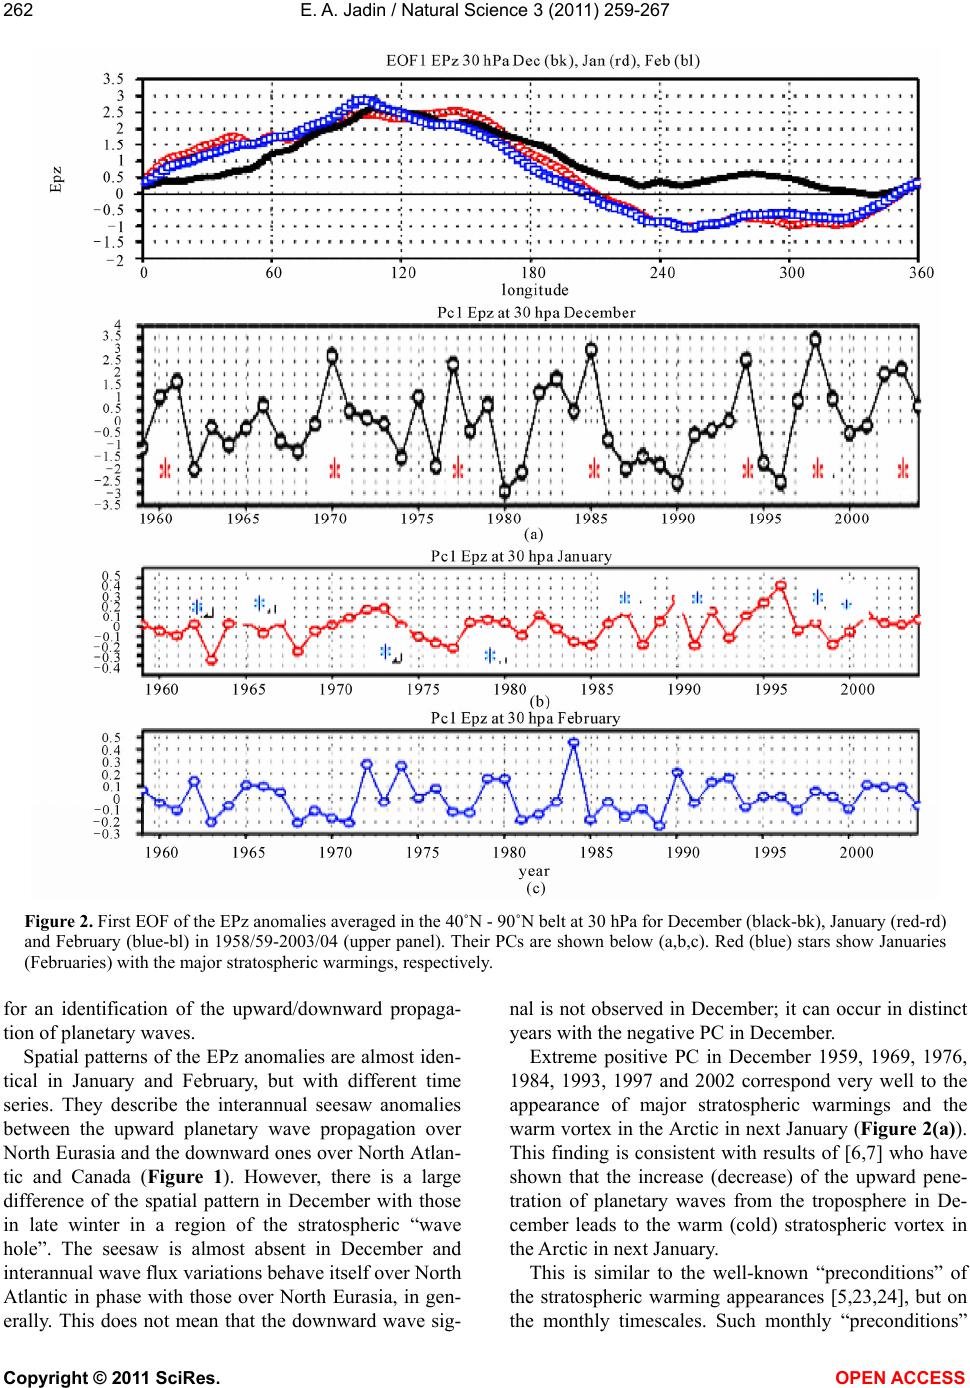 E. A. Jadin / Natural Science 3 (2011) 259-267 Copyright © 2011 SciRes. OPEN ACCESS 262 Figure 2. First EOF of the EPz anomalies averaged in the 40˚N - 90˚N belt at 30 hPa for December (black-bk), January (red-rd) and February (blue-bl) in 1958/59-2003/04 (upper panel). Their PCs are shown below (a,b,c). Red (blue) stars show Januaries (Februaries) with the major stratospheric warmings, respectively. for an identification of the upward/downward propaga- tion of planetary waves. Spatial patterns of the EPz anomalies are almost iden- tical in January and February, but with different time series. They describe the interannual seesaw anomalies between the upward planetary wave propagation over North Eurasia and the downward ones over North Atlan- tic and Canada (Figure 1). However, there is a large difference of the spatial pattern in December with those in late winter in a region of the stratospheric “wave hole”. The seesaw is almost absent in December and interannual wave flux variations behave itself over North Atlantic in phase with those over North Eurasia, in gen- erally. This does not mean that the downward wave sig- nal is not observed in December; it can occur in distinct years with the negative PC in December. Extreme positive PC in December 1959, 1969, 1976, 1984, 1993, 1997 and 2002 correspond very well to the appearance of major stratospheric warmings and the warm vortex in the Arctic in next January (Figure 2(a)). This finding is consistent with results of [6,7] who have shown that the increase (decrease) of the upward pene- tration of planetary waves from the troposphere in De- cember leads to the warm (cold) stratospheric vortex in the Arctic in next January. This is similar to the well-known “preconditions” of the stratospheric warming appearances [5,23,24], but on the monthly timescales. Such monthly “preconditions” 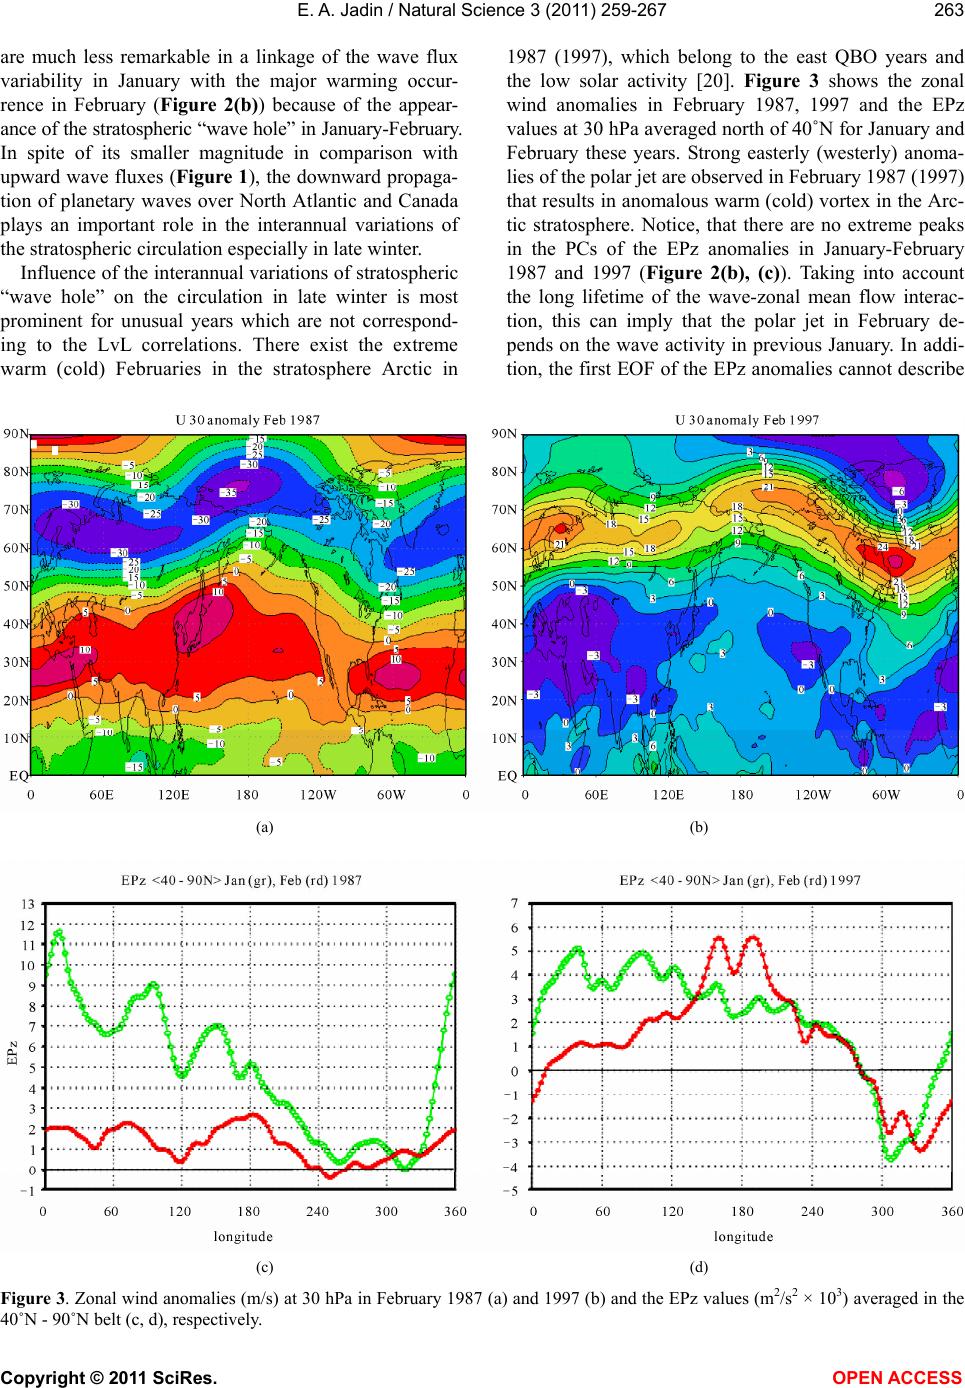 E. A. Jadin / Natural Science 3 (2011) 259-267 Copyright © 2011 SciRes. OPEN ACCESS 263 are much less remarkable in a linkage of the wave flux variability in January with the major warming occur- rence in February (Figure 2(b)) because of the appear- ance of the stratospheric “wave hole” in January-February. In spite of its smaller magnitude in comparison with upward wave fluxes (Figure 1), the downward propaga- tion of planetary waves over North Atlantic and Canada plays an important role in the interannual variations of the stratospheric circulation especially in late winter. Influence of the interannual variations of stratospheric “wave hole” on the circulation in late winter is most prominent for unusual years which are not correspond- ing to the LvL correlations. There exist the extreme warm (cold) Februaries in the stratosphere Arctic in 1987 (1997), which belong to the east QBO years and the low solar activity [20]. Figure 3 shows the zonal wind anomalies in February 1987, 1997 and the EPz values at 30 hPa averaged north of 40˚N for January and February these years. Strong easterly (westerly) anoma- lies of the polar jet are observed in February 1987 (1997) that results in anomalous warm (cold) vortex in the Arc- tic stratosphere. Notice, that there are no extreme peaks in the PCs of the EPz anomalies in January-February 1987 and 1997 (Figure 2(b), (c)). Taking into account the long lifetime of the wave-zonal mean flow interac- tion, this can imply that the polar jet in February de- pends on the wave activity in previous January. In addi- tion, the first EOF of the EPz anomalies cannot describe (a) (b) (c) (d) Figure 3. Zonal wind anomalies (m/s) at 30 hPa in February 1987 (a) and 1997 (b) and the EPz values (m2/s2 × 103) averaged in the 40˚N - 90˚N belt (c, d), respectively. 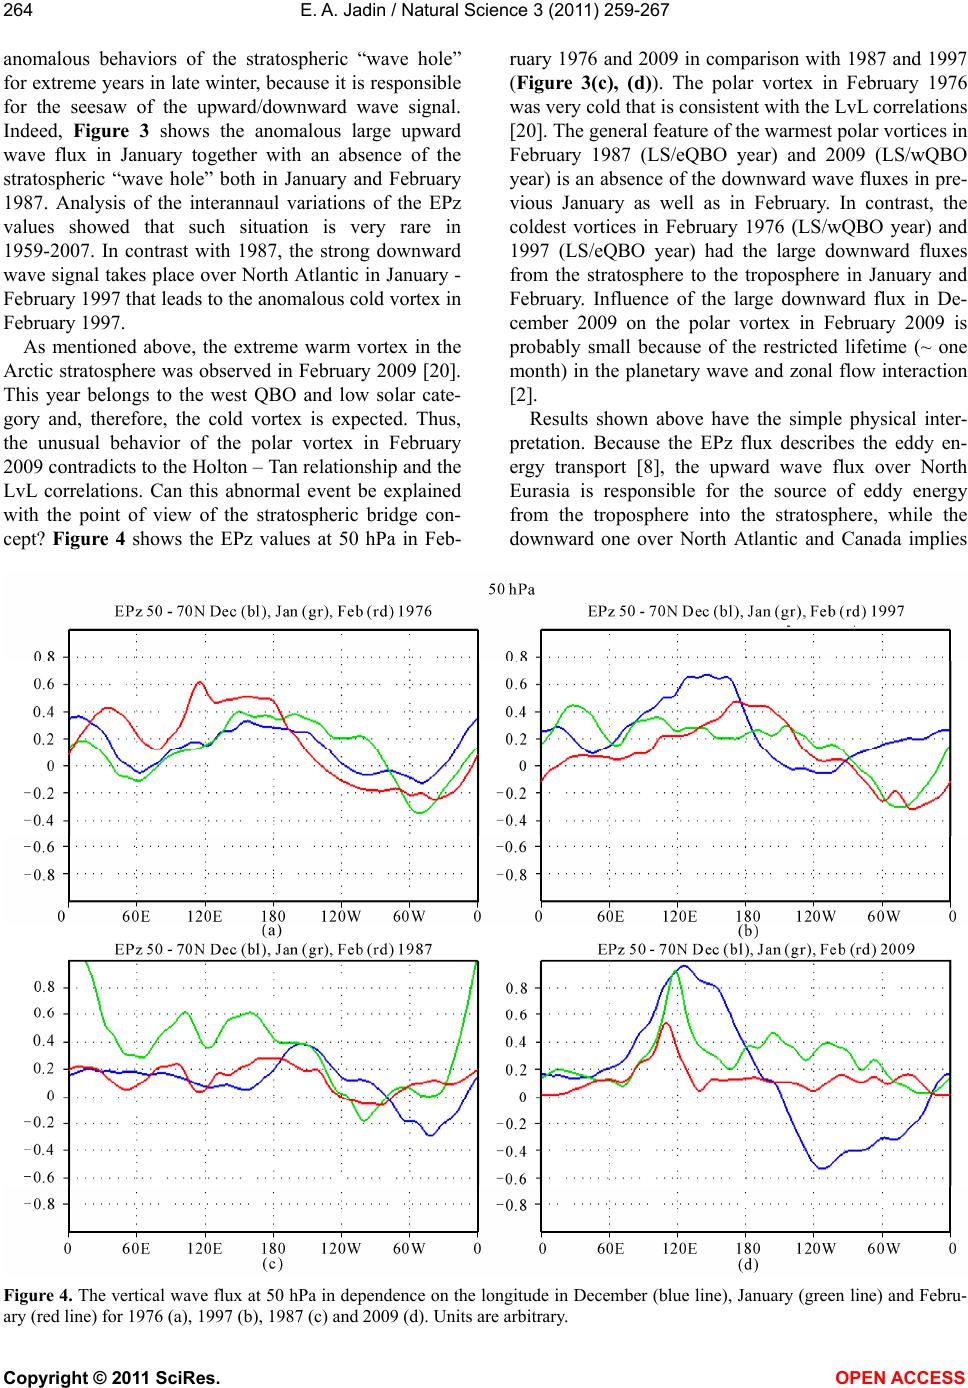 E. A. Jadin / Natural Science 3 (2011) 259-267 Copyright © 2011 SciRes. OPEN ACCESS 264 anomalous behaviors of the stratospheric “wave hole” for extreme years in late winter, because it is responsible for the seesaw of the upward/downward wave signal. Indeed, Figure 3 shows the anomalous large upward wave flux in January together with an absence of the stratospheric “wave hole” both in January and February 1987. Analysis of the interannaul variations of the EPz values showed that such situation is very rare in 1959-2007. In contrast with 1987, the strong downward wave signal takes place over North Atlantic in January - February 1997 that leads to the anomalous cold vortex in February 1997. As mentioned above, the extreme warm vortex in the Arctic stratosphere was observed in February 2009 [20]. This year belongs to the west QBO and low solar cate- gory and, therefore, the cold vortex is expected. Thus, the unusual behavior of the polar vortex in February 2009 contradicts to the Holton – Tan relationship and the LvL correlations. Can this abnormal event be explained with the point of view of the stratospheric bridge con- cept? Figure 4 shows the EPz values at 50 hPa in Feb- ruary 1976 and 2009 in comparison with 1987 and 1997 (Figure 3(c), (d)). The polar vortex in February 1976 was very cold that is consistent with the LvL correlations [20]. The general feature of the warmest polar vortices in February 1987 (LS/eQBO year) and 2009 (LS/wQBO year) is an absence of the downward wave fluxes in pre- vious January as well as in February. In contrast, the coldest vortices in February 1976 (LS/wQBO year) and 1997 (LS/eQBO year) had the large downward fluxes from the stratosphere to the troposphere in January and February. Influence of the large downward flux in De- cember 2009 on the polar vortex in February 2009 is probably small because of the restricted lifetime (~ one month) in the planetary wave and zonal flow interaction [2]. Results shown above have the simple physical inter- pretation. Because the EPz flux describes the eddy en- ergy transport [8], the upward wave flux over North Eurasia is responsible for the source of eddy energy from the troposphere into the stratosphere, while the downward one over North Atlantic and Canada implies Figure 4. The vertical wave flux at 50 hPa in dependence on the longitude in December (blue line), January (green line) and Febru- ary (red line) for 1976 (a), 1997 (b), 1987 (c) and 2009 (d). Units are arbitrary. 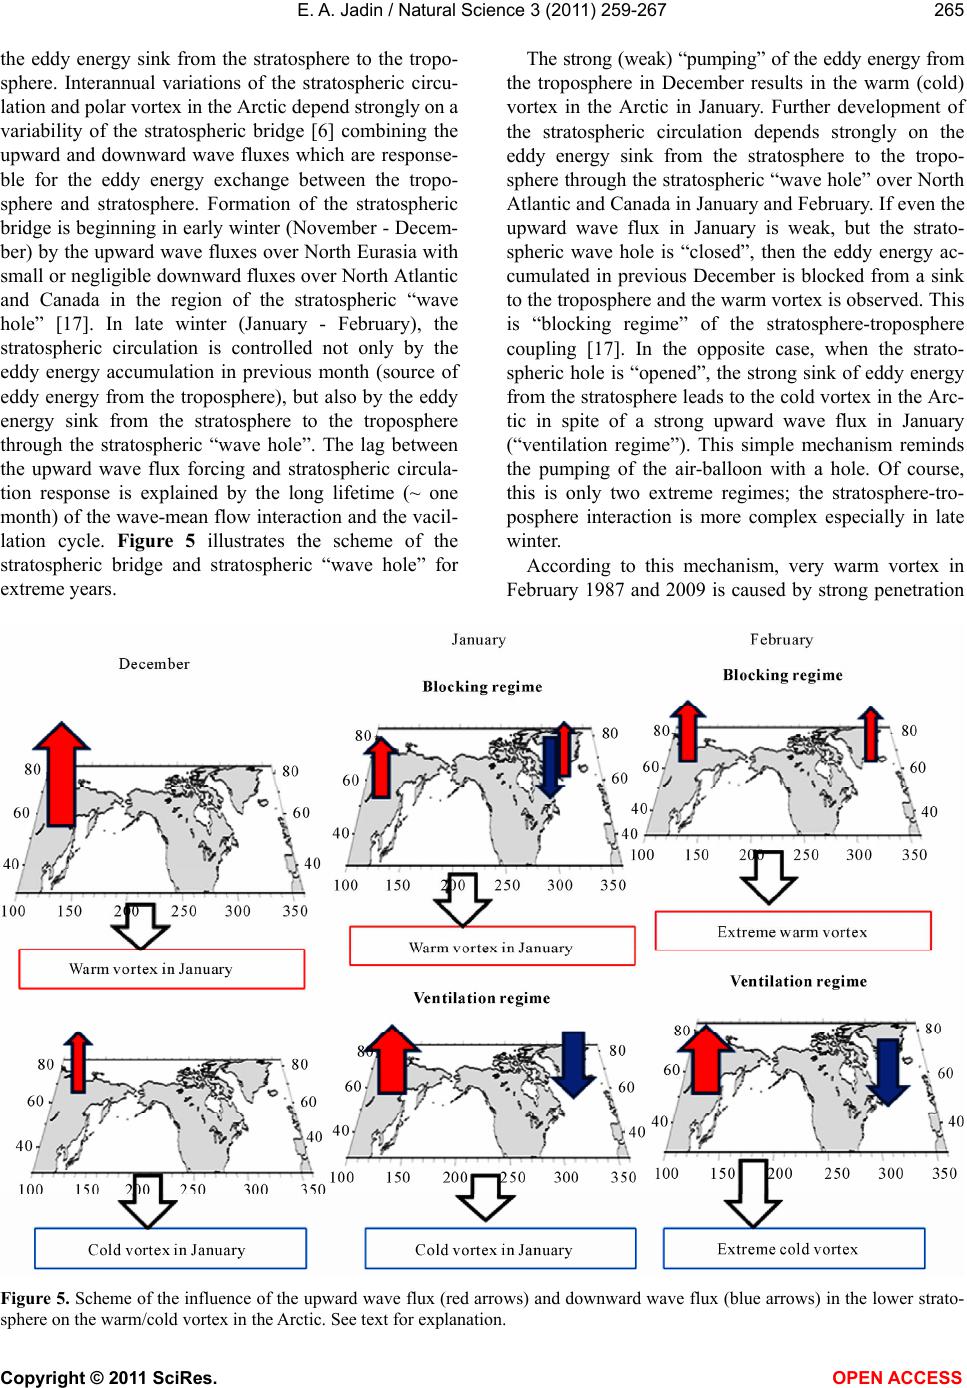 E. A. Jadin / Natural Science 3 (2011) 259-267 Copyright © 2011 SciRes. OPEN ACCESS 265 the eddy energy sink from the stratosphere to the tropo- sphere. Interannual variations of the stratospheric circu- lation and polar vortex in the Arctic depend strongly on a variability of the stratospheric bridge [6] combining the upward and downward wave fluxes which are response- ble for the eddy energy exchange between the tropo- sphere and stratosphere. Formation of the stratospheric bridge is beginning in early winter (November - Decem- ber) by the upward wave fluxes over North Eurasia with small or negligible downward fluxes over North Atlantic and Canada in the region of the stratospheric “wave hole” [17]. In late winter (January - February), the stratospheric circulation is controlled not only by the eddy energy accumulation in previous month (source of eddy energy from the troposphere), but also by the eddy energy sink from the stratosphere to the troposphere through the stratospheric “wave hole”. The lag between the upward wave flux forcing and stratospheric circula- tion response is explained by the long lifetime (~ one month) of the wave-mean flow interaction and the vacil- lation cycle. Figure 5 illustrates the scheme of the stratospheric bridge and stratospheric “wave hole” for extreme years. The strong (weak) “pumping” of the eddy energy from the troposphere in December results in the warm (cold) vortex in the Arctic in January. Further development of the stratospheric circulation depends strongly on the eddy energy sink from the stratosphere to the tropo- sphere through the stratospheric “wave hole” over North Atlantic and Canada in January and February. If even the upward wave flux in January is weak, but the strato- spheric wave hole is “closed”, then the eddy energy ac- cumulated in previous December is blocked from a sink to the troposphere and the warm vortex is observed. This is “blocking regime” of the stratosphere-troposphere coupling [17]. In the opposite case, when the strato- spheric hole is “opened”, the strong sink of eddy energy from the stratosphere leads to the cold vortex in the Arc- tic in spite of a strong upward wave flux in January (“ventilation regime”). This simple mechanism reminds the pumping of the air-balloon with a hole. Of course, this is only two extreme regimes; the stratosphere-tro- posphere interaction is more complex especially in late winter. According to this mechanism, very warm vortex in February 1987 and 2009 is caused by strong penetration Figure 5. Scheme of the influence of the upward wave flux (red arrows) and downward wave flux (blue arrows) in the lower strato- sphere on the warm/cold vortex in the Arctic. See text for explanation. 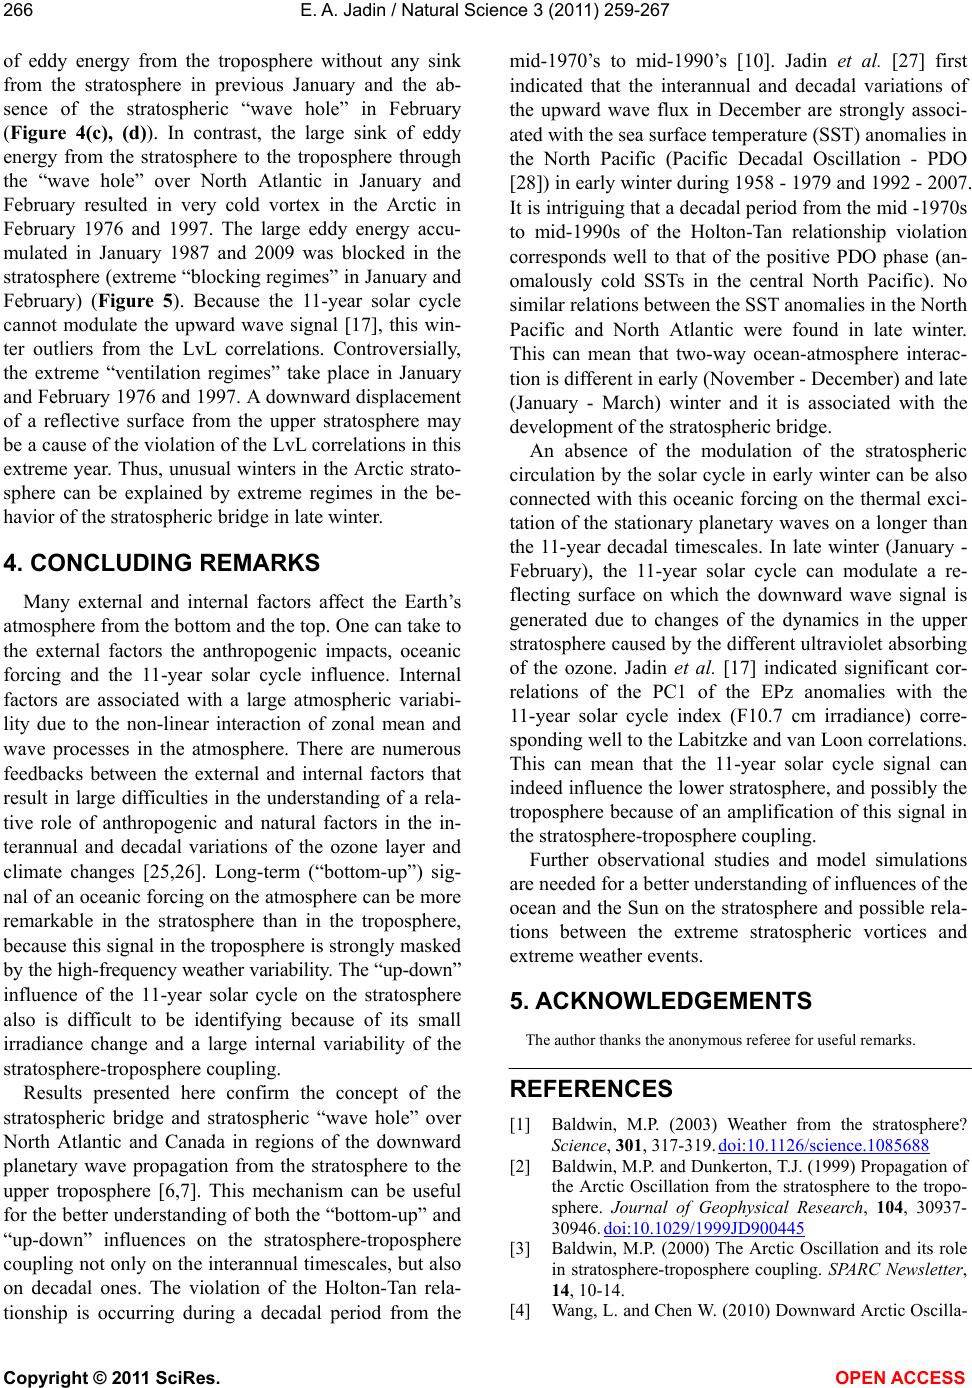 E. A. Jadin / Natural Science 3 (2011) 259-267 Copyright © 2011 SciRes. OPEN ACCESS 266 of eddy energy from the troposphere without any sink from the stratosphere in previous January and the ab- sence of the stratospheric “wave hole” in February (Figure 4(c), (d)). In contrast, the large sink of eddy energy from the stratosphere to the troposphere through the “wave hole” over North Atlantic in January and February resulted in very cold vortex in the Arctic in February 1976 and 1997. The large eddy energy accu- mulated in January 1987 and 2009 was blocked in the stratosphere (extreme “blocking regimes” in January and February) (Figure 5). Because the 11-year solar cycle cannot modulate the upward wave signal [17], this win- ter outliers from the LvL correlations. Controversially, the extreme “ventilation regimes” take place in January and February 1976 and 1997. A downward displacement of a reflective surface from the upper stratosphere may be a cause of the violation of the LvL correlations in this extreme year. Thus, unusual winters in the Arctic strato- sphere can be explained by extreme regimes in the be- havior of the stratospheric bridge in late winter. 4. CONCLUDING REMARKS Many external and internal factors affect the Earth’s atmosphere from the bottom and the top. One can take to the external factors the anthropogenic impacts, oceanic forcing and the 11-year solar cycle influence. Internal factors are associated with a large atmospheric variabi- lity due to the non-linear interaction of zonal mean and wave processes in the atmosphere. There are numerous feedbacks between the external and internal factors that result in large difficulties in the understanding of a rela- tive role of anthropogenic and natural factors in the in- terannual and decadal variations of the ozone layer and climate changes [25,26]. Long-term (“bottom-up”) sig- nal of an oceanic forcing on the atmosphere can be more remarkable in the stratosphere than in the troposphere, because this signal in the troposphere is strongly masked by the high-frequency weather variability. The “up-down” influence of the 11-year solar cycle on the stratosphere also is difficult to be identifying because of its small irradiance change and a large internal variability of the stratosphere-troposphere coupling. Results presented here confirm the concept of the stratospheric bridge and stratospheric “wave hole” over North Atlantic and Canada in regions of the downward planetary wave propagation from the stratosphere to the upper troposphere [6,7]. This mechanism can be useful for the better understanding of both the “bottom-up” and “up-down” influences on the stratosphere-troposphere coupling not only on the interannual timescales, but also on decadal ones. The violation of the Holton-Tan rela- tionship is occurring during a decadal period from the mid-1970’s to mid-1990’s [10]. Jadin et al. [27] first indicated that the interannual and decadal variations of the upward wave flux in December are strongly associ- ated with the sea surface temperature (SST) anomalies in the North Pacific (Pacific Decadal Oscillation - PDO [28]) in early winter during 1958 - 1979 and 1992 - 2007. It is intriguing that a decadal period from the mid -1970s to mid-1990s of the Holton-Tan relationship violation corresponds well to that of the positive PDO phase (an- omalously cold SSTs in the central North Pacific). No similar relations between the SST anomalies in the North Pacific and North Atlantic were found in late winter. This can mean that two-way ocean-atmosphere interac- tion is different in early (November - December) and late (January - March) winter and it is associated with the development of the stratospheric bridge. An absence of the modulation of the stratospheric circulation by the solar cycle in early winter can be also connected with this oceanic forcing on the thermal exci- tation of the stationary planetary waves on a longer than the 11-year decadal timescales. In late winter (January - February), the 11-year solar cycle can modulate a re- flecting surface on which the downward wave signal is generated due to changes of the dynamics in the upper stratosphere caused by the different ultraviolet absorbing of the ozone. Jadin et al. [17] indicated significant cor- relations of the PC1 of the EPz anomalies with the 11-year solar cycle index (F10.7 cm irradiance) corre- sponding well to the Labitzke and van Loon correlations. This can mean that the 11-year solar cycle signal can indeed influence the lower stratosphere, and possibly the troposphere because of an amplification of this signal in the stratosphere-troposphere coupling. Further observational studies and model simulations are needed for a better understanding of influences of the ocean and the Sun on the stratosphere and possible rela- tions between the extreme stratospheric vortices and extreme weather events. 5. ACKNOWLEDGEMENTS The author thanks the anonymous referee for useful remarks. REFERENCES [1] Baldwin, M.P. (2003) Weather from the stratosphere? Science, 301, 317-319. doi:10.1126/science.1085688 [2] Baldwin, M.P. and Dunkerton, T.J. (1999) Propagation of the Arctic Oscillation from the stratosphere to the tropo- sphere. Journal of Geophysical Research, 104, 30937- 30946. doi:10.1029/1999JD900445 [3] Baldwin, M.P. (2000) The Arctic Oscillation and its role in stratosphere-troposphere coupling. SPARC Newsletter, 14, 10-14. [4] Wang, L. and Chen W. (2010) Downward Arctic Oscilla-  E. A. Jadin / Natural Science 3 (2011) 259-267 Copyright © 2011 SciRes. OPEN ACCESS 267 tion signal associated with moderate weak stratospheric polar vortex and the cold December 2009. Geophysical Research Letters, 37, L09707. doi:10.1029/2010GL042659 [5] Polvani, L.M. and Waugh, D.W. (2004) Upward wave activity flux as a precursor to extreme stratospheric events and subsequent anomalous surface weather re- gime. Journal of Climate, 17, 3548-3554. doi:10.1175/1520-0442(2004)017<3548:UWAFAA>2.0. CO;2 [6] Zyulyaeva Yu.A. and Jadin, E.A. (2009) Analysis of three-dimensional Eliassen-Palm fluxes in the lower stratosphere. Russian Meteorology and Hydrology, 8, 5-14. http://ao.atmos.colostate.edu [7] Jadin, E.A. and Zyulyaeva, Yu.A. (2010) Interannual variations in the total ozone, stratospheric dynamics, ex- tratropical SST anomalies and predictions of abnormal winters in Eurasia. International Journal of Remote Sensing, 31, 851-866. doi:10.1080/01431160902897874 [8] Plumb, R.A. (1985) On the three-dimensional propaga- tion of stationary waves. Journal of Atmospheric Science, 42, 238-251. doi:10.1175/1520-0469(1985)042<0217:OTTDPO>2.0.C O;2 [9] Holton, J.R. and Tan, H.C. (1980) The influence of the equatorial quasi - biennial oscillation on the global cir- culation at 50 mb. Journal of Atmospheric Science, 37, 2200-2208. doi:10.1175/1520-0469(1980)037<2200:TIOTEQ>2.0.C O;2 [10] Lu, H., Baldwin, M.P., Gray, L.J. and Jarvis, M.J. (2008) Decadal-scale changes in the effect of the QBO on the northern stratospheric polar vortex. Journal of Geophy- sical Research, 113 , D10114. doi:10.1029/2007JD009647 [11] Labitzke, K. and Loon, van H. (1988) Association be- tween the 11-year solar cycle, the QBO, and the atmos- phere. Part I. The troposphere and the stratosphere in the northern hemisphere in winters. Journal of Atmospheric and Terrestrial Physics, 50, 197-206. doi:10.1016/0021-9169(88)90068-2 [12] Rottman, G. (1999) Solar ultraviolet irradiance and its temporal variability. Journal of Atmospheric and Solar- Terrestrial Physics, 61, 37-44. doi:10.1016/S1364-6826(98)00114-X [13] Kodera, K., Yamazaki, K., Chiba, M. and Shibata, K. (1990) Downward propagation of upper stratospheric mean zonal wind perturbation to the troposphere. Geo- physical Research Letters, 73, 1263-1266. doi:10.1029/GL017i009p01263 [14] Kodera, K. and Kuroda, Y. (2002) Dynamical response to the solar cycle. Journal of Geophysical Research, 107, D4749. [15] Kuroda, Y. (2007) Effect of QBO and ENSO on the solar cycle modulation of wither North Atlantic Oscillation. Journal of Meteorological Society of Japan, 85, 889-898. doi:10.2151/jmsj.85.889 [16] Lu, H., Gray, L.J., Baldwin, M.P. and Jarvis, M.J. (2009) Life cycle of the QBO-modulated 11-year solar cycle signals in the Northern Hemisphere winter. Quarterly Journal of the Royal Meteoroogical Society, 135, 1030- 1043. doi:10.1002/qj.419 [17] Jadin, E.A., Wei, K., Chen, W. and Wang, L. (2010) Stratospheric bridge and its modulation by the quasi-bi- ennial oscillation and 11-year solar cycle. Proceedings of the COSPAR 2010 38-th General Assembly, Bremen, 18-25 July 2010. [18] Perlwitz, J. and Harnik, N. (2003) Observational evi- dence of a stratospheric influence on the troposphere by planetary wave reflection. Journal of Climate, 16, 3011- 3026. doi:10.1175/1520-0442(2003)016<3011:OEOASI>2.0.C O;2 [19] Labitzke, K. (2005) On the solar cycle-QBO relationship: A summary. Journal of Atmospheric and Solar-Terres- trial Physics, 67, 45-54. doi:10.1016/j.jastp.2004.07.016 [20] Labitzke, K. and Kunze, M. (2009) On the remarkable Arctic winter in 2008/2009. Journal of Geophysical Re- search, 114, D00I02. doi:10.1029/2009JD012273 [21] Kalnay, E.M. and coauthors (1996) The NCEP/NCAR reanalysis project. Bulletin of American Meteorological Society, 77, 437-471. doi:10.1175/1520-0477(1996)077<0437:TNYRP>2.0.C O;2 [22] Holton, J.R. and Mass, C. (1976) Stratospheric vacilla- tion cycle. Journal of Atmospheric Science, 33, 2218- 2225. doi:10.1175/1520-0469(1976)033<2218:SVC>2.0.CO;2 [23] Labitzke K. (1982) On the interannual variability of the middle atmosphere during the northern winters. Journal of Meteorological Society of Japan, 60, 124-139. [24] McIntyre, M.E. (1982) How well do we understand the dynamics of stratospheric warmings? Journal of Mete- orological Society of Japan, 1, 37-56. [25] Jadin, E.A. and Vargin, P.N. (2005) Antarctic ozone hole in 2002. Izvestiya of Russian Academy of Sciences, Physics of Atmosphere and Ocean, 40, 696-705. [26] Jadin, E.A. (2001) Arctic Oscillation and interannual variations of the sea surface temperature in the Atlantic and Pacific. Russian Meteorology and Hydrology, l8, 28-40. [27] Jadin, E.A., Wei, K., Zyulyaeva, Yu.A., Chen, W. and Wang L. (2010) Stratospheric wave activity and the Pa- cific Decadal Oscillation. Journal of Atmospheric and Solar-Terrestrial Physics, 72, 1163-1170. doi:10.1016/j.jastp.2010.07.009 [28] Mantua, N.J. and Hare, S.R. (2002) The Pacific Decadal Oscillation. Journal of Oceanography, 58, 35-44. doi:10.1023/A:1015820616384 |