

Paper Menu >>
Journal Menu >>
 Journal of Geoscience and Environment Protection, 2014, 2, 1-7 Published Online June 2014 in SciRes. http://www.scirp.org/journal/gep http://dx.doi.org/10.4236/gep.2014.23001 How to cite this paper: Adebayo, A., & Mahmoud, M. (2014). An Experimental Study of the Effect of Rock/Fluid Interaction on Resistivity Logs during CO2 Sequestration in Carbonate Rocks. Journal of Geoscience and Environment Protection, 2, 1-7. http://dx.doi.org/10.4236/gep.2014.23001 An Experimental Study of the Effect of Rock/Fluid Interaction on Resistivity Logs during CO2 Sequestration in Carbonate Rocks Abdulrauf Adebayo, Mohammed Mahmoud Petroleum Engineering Department, King Fahd University of Petroleum & Minerals, Dhahran, Saudi Arabia Email: [email protected] Received January 2014 Abstract Accurate laboratory measurements and analysis of electrical properties of core samples are a prerequisite step to the evaluation of oil and gas reserves. In recent times, this evaluation tech- nique has been adopted in carbon dioxide sequestration projects for estimating and monitoring carbon dioxide (CO2) accumulation in saline aquifers. Several papers have reported laboratory success in the use of resistivity measurements to monitor the flow and also estimate the volume of CO2 plume in geological formations. Such laboratory experiments did not capture the effect of CO2 -brine-rock interaction (CBRI) on saturation estimation. The possibility of a change in value resis- tivity due to CO2/brine/ rock interactions, and the possible effect on CO2 monitoring and estima- tion are of immediate interest here. Preliminary results of an ongoing research work showed that a much longer experiment time accommodates CO2-brine-rock interaction which ultimately lead to change in rock resistivity. We hereby present the electrical behavior of carbonates to CO2/ brine/rock interaction during prolonged CO2 sequestration and the effect on saturation estima- tion. This electrical behavior and its possible effect on CO2 monitoring and estimation are dis- cussed. Keywords Carbon Dioxide Sequestration and Monitoring, Resistivity Log, Rock Fluid Interaction, Archie Equa tion 1. Introduction CO2 is normally injected into underground formation at high pressure and temperature such that the CO2 exists in a supercritical state. The supercritical state will reduce the volume of rock space occupied by injected CO2 per unit volume of CO2 existing at atmospheric condition. The pressure and temperature at which CO2 exist in this state can be found in aquifers at depth of about 800 meters or more. Hence candidate formations for carbon cap-  A. Adebayo, M. Mahmoud 2 ture and sequestration (CCS) must be at this depth (Benson, 2008). While CO2 is injected into a subsurface for- mation, four major trapping mechanisms ensue namely: 1) Physical/Structural trapping—a process whereby impermeable cap rock at the top of the formation prevent the CO2 from escaping out of the formation, keeping it in place (Benson, 2008; W ang, 2010), 2) Solubility trapping—a process whereby injected CO2 dissolves in for- mation pore water, 3) Mineral trapping—occurs when aqueous CO2 reacts with formation rock minerals pro- ducing precipitates of carbonate minerals, and 4) Residual or Capillary trapping which occurs after CO2 injec- tion stops and water begins to imbibe into the aquifer displacing the CO2 already in the aquifer. Not all the CO2 is displaced but some are left behind as residual CO2 (residual trapping). Dissolved CO2 can acidify formation water and subsequently mobilize and transport trace metals as it migrates in the formation (Gaus, 2010). A stor- age formation with strong cap rock is thus crucial to avoid leakages of trace metals and compounds into overly- ing portable aquifers. There is also the need for proper monitoring of CO2 migration so as to observe its behav- ior, distribution, and possible leakages. Hence, evaluation of the reliability of CO2 monitoring techniques should be first step in risk assessment of any CCS project (Wang, 2004). Techniques required for monitoring CO2 mi- gration can be borrowed from a variety of other applications such as those used in the oil and gas industry, and those used in ground water monitoring (Benson, 2008). Examples of such techniques are seismic, gravity, and resistivity measurements. Seismic is the most extensively used technique. The use of resistivity measurements is also promising. Resistivity technique is applicable because rocks contain saline water and are thus conductive. The use of resistivity measurements to monitor and quantify CO2 in underground geological formation depends on the fact that formation resistivity is higher at locations occupied by CO2 compared to locations un-invaded by CO2, and the resistivity increases as CO2 saturation increases. The amount of resistivity changes depend on the volume of CO2 present. With the use of Archie’s equation or modified Archie’s equation, CO2 saturation distri- bution, migration, and volume can be estimated. Many experimental and field studies have successfully used re- sistivity measurements to monitor CO2 migration (Ramire z, 2003; Wa ng, 2010; Gie se, 200 9; Chr iste nse n, 2006; Nakat su ka, 2010). Archie’s equation is given in Equation (1). 1n w wmt aR SR = ∅ (1) where “a” is a constant determined as the intercept passing through 100% porosity on a formation fac- tor-porosity plot, while “m” and “n” are cementation factor and saturation exponent respectively and are ob- tained from laboratory resistivity measurements on core samples. Kiessling et al. (2010) applied Archie’s equation to estimate CO2 saturation distribution in a CO2 SINK test site close to Ketzin (Germany). Similarly, Nakatsuka et al. (2010) reported the use of Archie and modified Archie equation to estimate CO2 distribution in the Nagaoka pilot CO2 injection site. Time lapse resistivity measurements in both cases were used to monitor movement of CO2 to and away from different zones of interest. Changing resistivity values were interpreted as change in CO2 saturation. Figure 1 shows the time lapse resis- tivity logs for both cases. This study is new compared to previous works in the following sense: Many previous laboratory works have fo- cused on the applicability of electrical resistivity measurements to track CO2 migration by way of resistivity change as a function of CO2 saturation changes during CO2 sequestration. Such experiments were also conducted only within several hours or less. The fate of formation resistivity in the event that the CO2 remained trapped in the pores for an extended period of time and the subsequent effect of the CO2/brine/rock reactions on resistivity and on CO2 monitoring and estimation has not been addressed. This paper investigates the effect of CO2 brine rock reac- tion on resistivity and CO2 saturation estimation. 2. Materials and Methods All samples were collected from the same quarry rock of Indiana lime stone with recorded high level of homo- geneity. Cylindrical samples with dimension of 3.74 cm diameter and length of 7 cm were cut and surface grinded to ensure very flat end faces. Samples were cleaned by solvent reflux method and vacuum dried in oven at 80˚C. Sample properties were then measured and tabulated in Table 1. De-aerated synthetic brine with com- position and properties shown in Table 2 wer e prepared and used to saturate core samples. 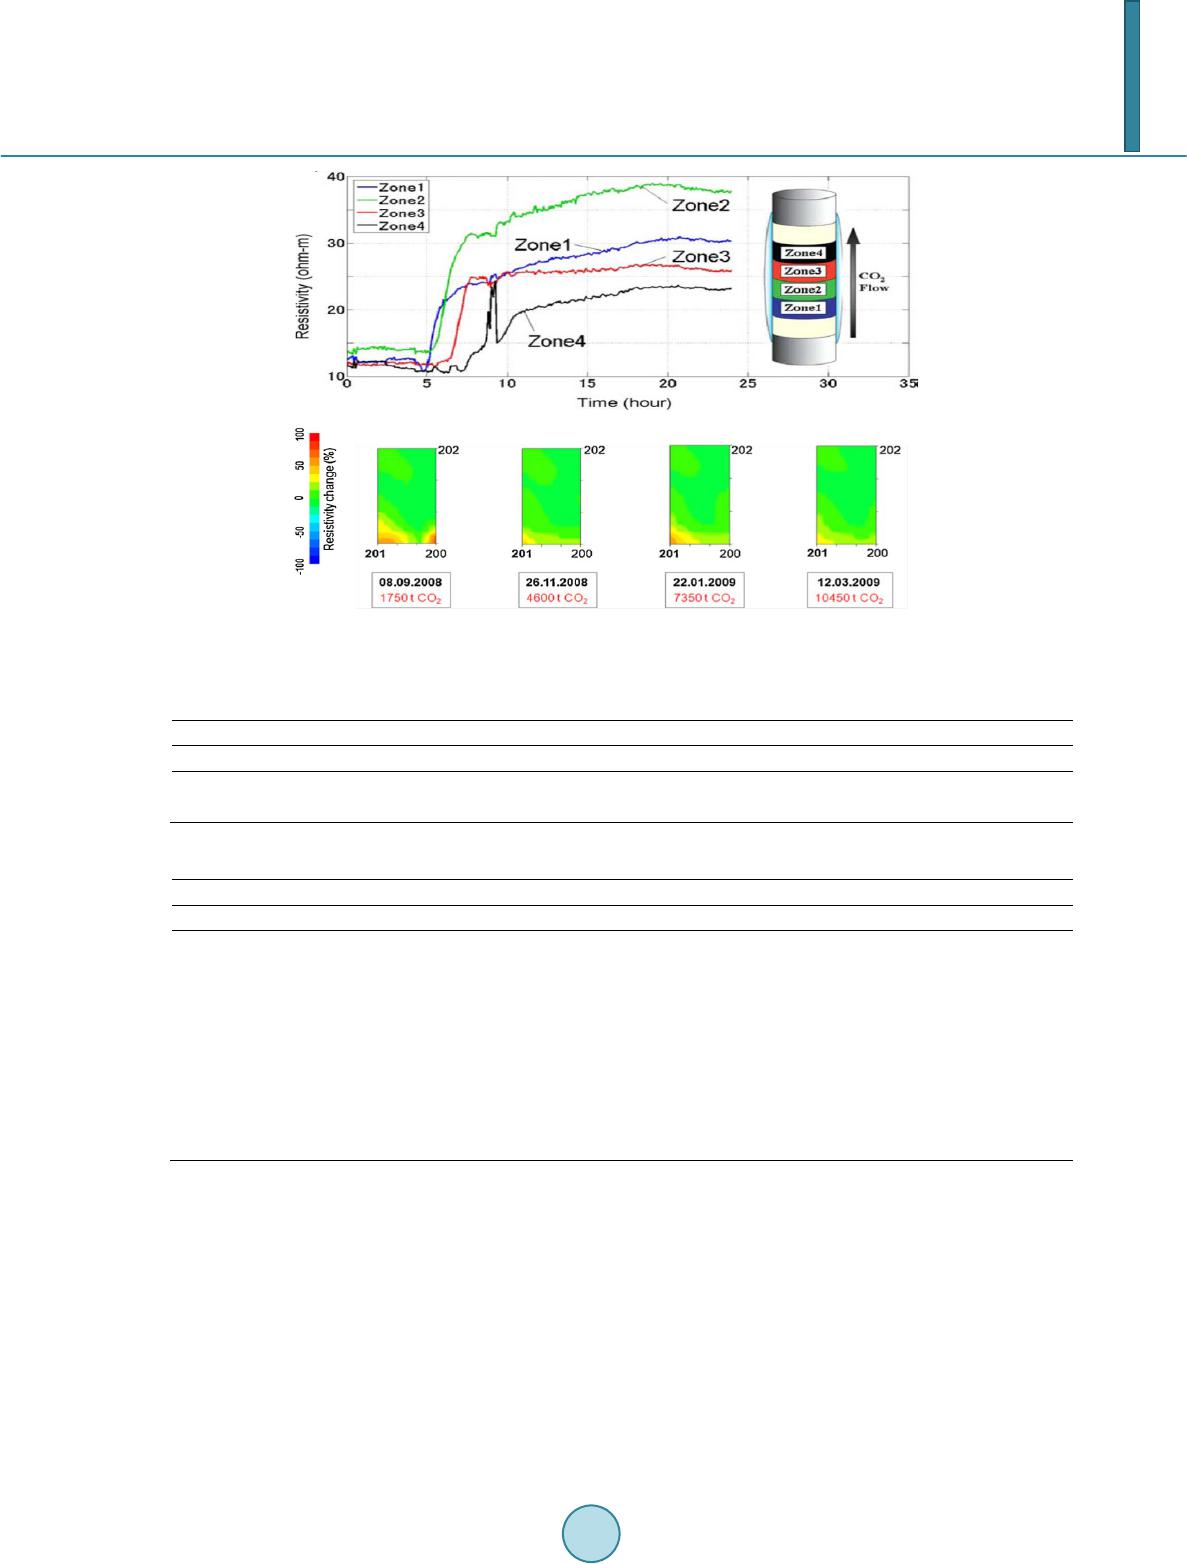 A. Adebayo, M. Mahmoud 3 (A) (B) Figure 1. Time lapse resistivity logs: (A) laboratory data taken with permission from Nakatsu- ka et al. (2010) (B) field data taken with permission from Kiessling et al. (20 10) . Table 1. Sample properties. L D Bulk Vol. He. Pore Vol. 500psi He Porosity (500psi) K ID (cm) (c m) (cc) (cc) (%) (mD) 209 7.03 3.741 77.37 14.70 19.002 324 206 7.06 3.736 77.43 13.78 17.790 423 Table 2. Synthetic formation brine. Saline Aquifer Composition Weight (g/l) Sodium Chloride 44.5 (NaCl) Calcium Chloride (CaCl2∙2H2O) 9.65 Magnesium Chloride (MgCl2∙6H2O) 3.41 Sodium Bicarbonate (NaHCO3) 0.15 Sodium phosphate (Na 2 SO 4 ) 0.28 TDS (g/l) 57.99 Density, g/cc 1.02 Resistivity @ 22.5˚C, (o h m-m) 0.401 3. CO2 Injection Apparatus and Procedure Figure 1 is the CO2 injection set up. The setup is designed to store supercritical CO2 in a brine saturated core sample at a typical reservoir condition of 40˚C and 2000 psi overburden pressure. It consists of a CO2 source, a core resistivity assembly, a test cell, pressure system, a heater, gauges, a LCR meter, and a data acquisition sys- tem to record resistivity measurement as a function of time as CO2 aging lasts. A 3.7 cm diameter by 7 cm long carbonate core was placed in a Viton sleeve embedded with two electric current potential electrodes. A Teflon tape was wrapped along the circumference of the core (except the portion that would be in contact with the elec- tric potential electrodes) prior to placing it inside the Viton sleeve so as to delay the breakthrough of CO2 through the sleeve. The core together with the sleeve was then coupled with the pore inlet and outlet tubing which doubled as current inlet and outlet electrodes respectively. The core assembly was placed into a test cell 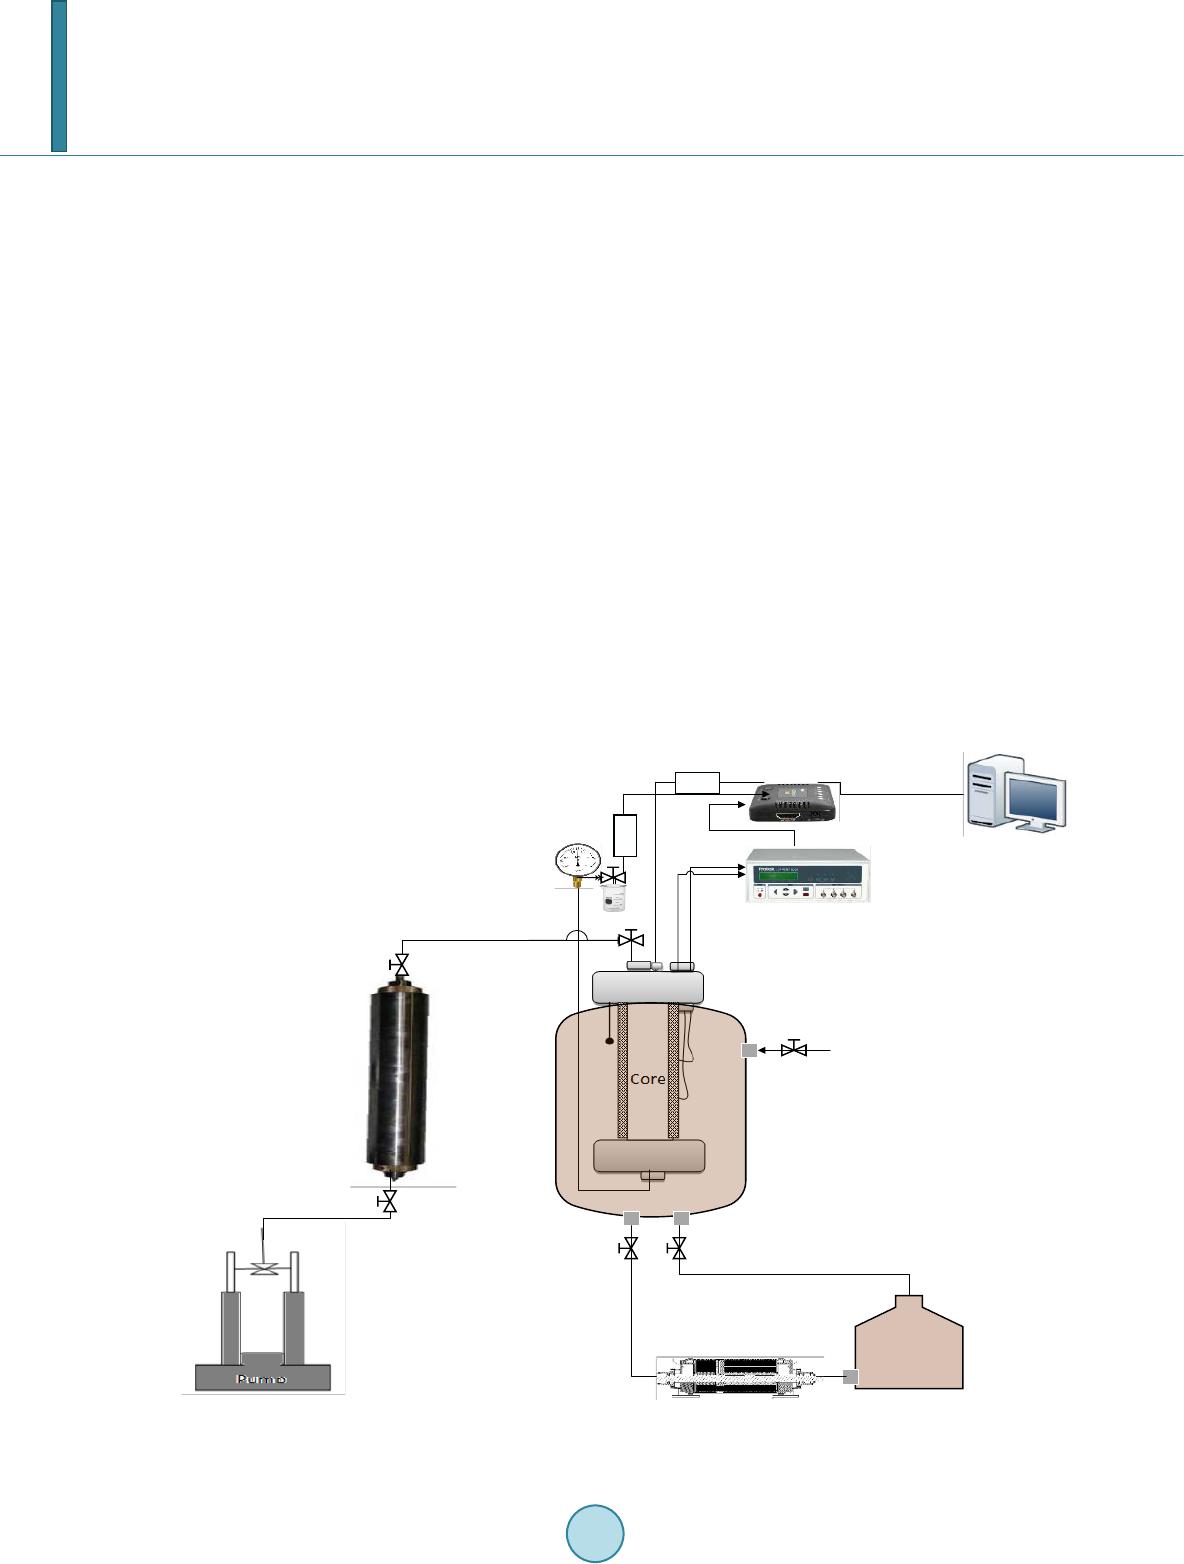 A. Adebayo, M. Mahmoud 4 and then subjected to overburden pressure of 500 psi after which the core was circulated with brine to remove trapped air from the core’s pore space. An inlet valve and outlet valve attached to the core assembly served as means of either closing up the core after CO2 injection or for fluid sampling at the end of storage. At the end of brine circulation, cell temperature was raised to 45˚C, the overburden pressure too was raised to 2000 psi and the system left for over 24 hours for the core to equilibrate with the surrounding temperature and pressure. At this point, the outlet valve was closed and CO2 was applied at the inlet tubing at a pressure of 2000 psi making the CO2 to exist in a supercritical state in the core. After few hours, the inlet valve was closed. CO2 inlet was from the bottom of the core and the outlet tubing was at the top. The outlet tubing was also connected to a pres- sure gauge used to monitor CO2 pressure (Figure 2). The same procedure applied for the second core. Core sample IL-206 was aged for 3 weeks (46 days) and IL-209 was aged for (90 days). During these aging times, the DAQ system recorded measurements of resistivity, pressure, and temperature of the core as a function of time. 3. Results and Discussions Results after prolonged storage showed that rock electrical signature was constant prior to CO2 injection and later increased in response to CO2 influx and remained constant again around this resistivity value until after quite a number of days when constant resistivity pattern changed to a more turbulent pattern suggesting the on- set of chemical reactions between the three phases—CO2, brine, and carbonate grains. Considering the first 300 hours of CO2 storage (between 200th hour marking the beginning of CO2 storage till 500th hour) in sample IL-206 (Figure 3(a)). It can be seen that although CO2 pressure is fairly the same during this period but the for- mation resistivity dropped at about 150 hours after CO2 storage and later increased to the CO2 base line. Esti- mating CO2 saturation within this period using Equation (1) would give different saturation profile whereas in the true sense the brine saturation is the same since no outflow was allowed. The same phenomenon can be seen Figure 2. CO2 sequestration and online resistivity measurement system. Flask Temperature Control and Pressure Bath Overburden Oil Pressurized CO2 Cylinde r Syringe Pump Analogue to Digital Converter C omputer LCR Meter P Pressure Transducer Pressure Gauge Core Holder P Th erm oc ouple Overburden Pump Air Supply for Overburden Oil Drainage 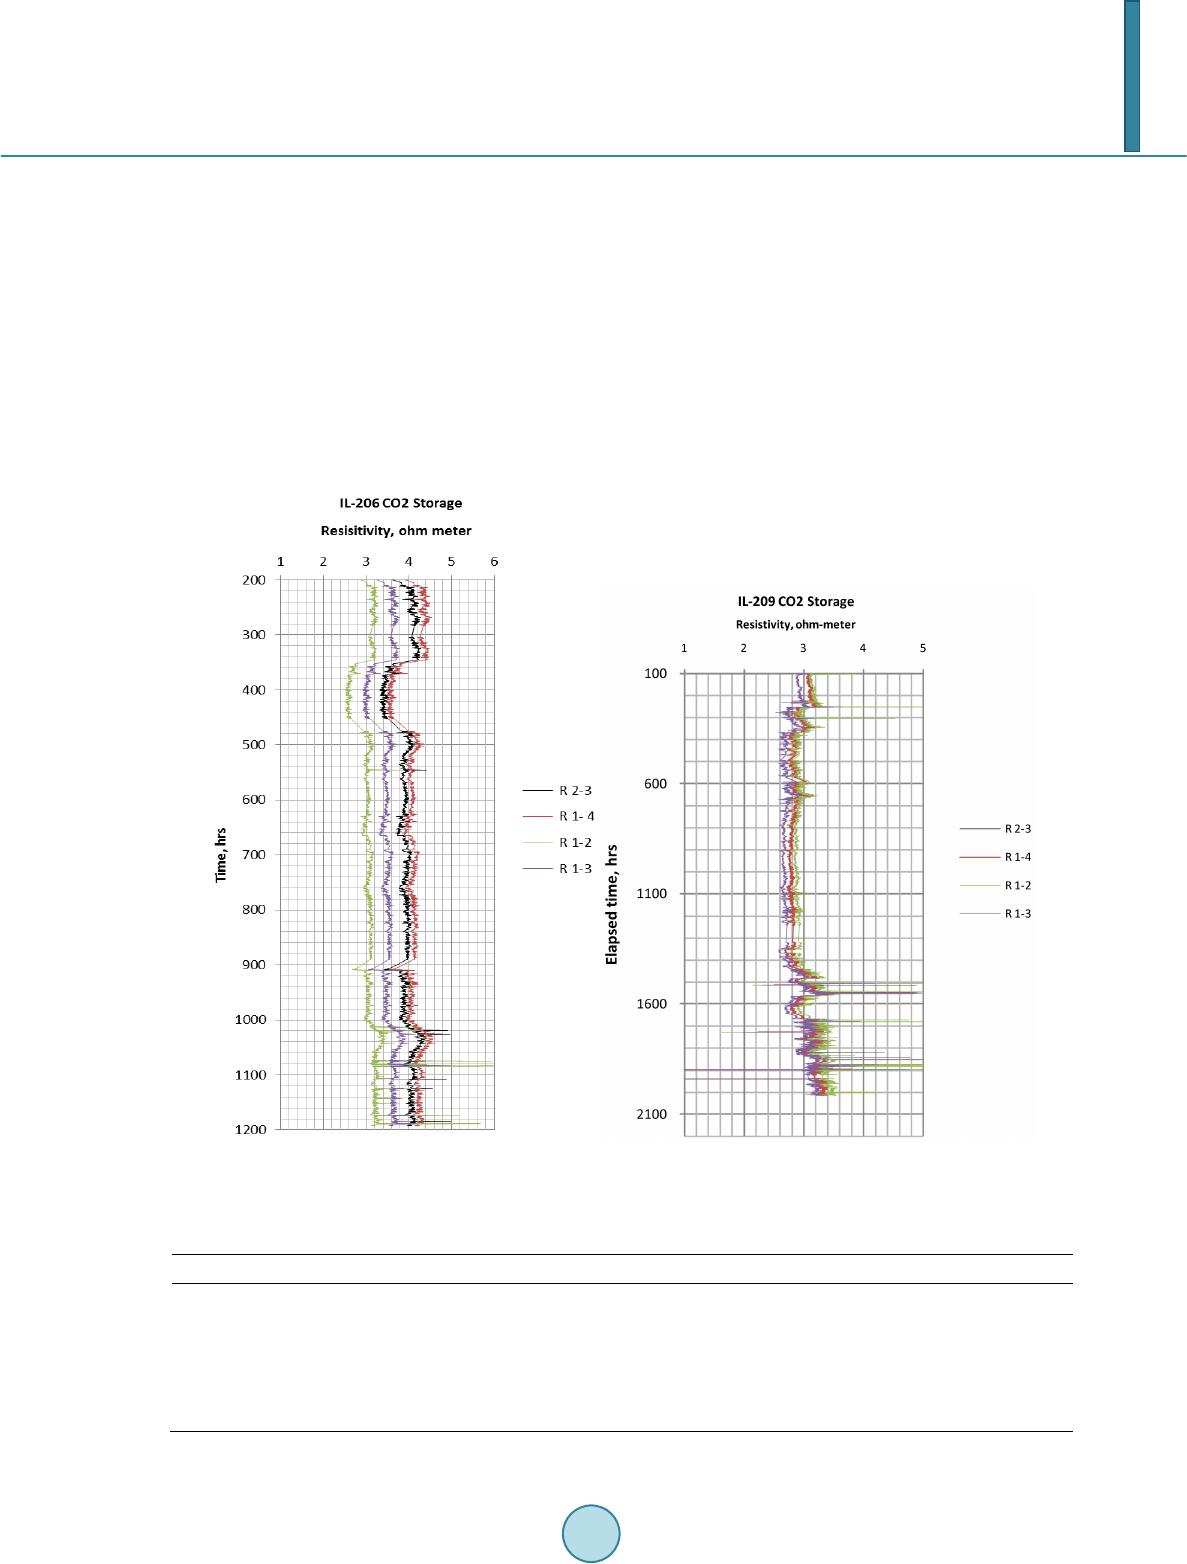 A. Adebayo, M. Mahmoud 5 later at about 1000th hour to 1100th hour. The same phenomenon was observed in another experiment done on a different sample (IL-209) confirming repeatability (Figure 3(b)). The effect of such variation in resistivity measurements is best described in Table 3. This behavior showed that drop in formation resistivity does not necessarily mean migration of CO2 away from the location but can be due to CO2/brine/rock interaction. To be able to explain the reason for such electrical behavior in Figure 3, we carried out elemental analysis (XRFD) on precipitates seen at the bottom of brine effluents taken from samples at the end of storage (Figure 4). The pre- cipitates were identified to be carbonate grains which confirm carbonate grain dissolution (Figure 5). Samples’ permeability also reduced from 423mD to 201mD in IL-206 and from 324mD to 297mD in IL-209 (Figure 6). However, porosity remains either the same or a bit lower. 4. Conclusions 1) Resistivity logging in sequestration project can give information on fluid rock interaction. (a) (b ) Figure 3. Resistivity versus time while CO2 reacts with brine saturated carbonate (A) IL-206 (B) IL-209. Table 3. The effect of Archie’s parameters on saturation estimation (Bennion et al., 96). Effect on Sx (If Under Estimated) Effect on Sw (If Over Estimated) Effect of Small Error Satnration Exponent (n) Value too low Value too high Strong Archie Constant (a) Value too low Value too high Moderate Water Resistivity (Rw) Value too low Value too high Strong Cementation Exponent (m) Value too low Value too high Moderate Total Resistivity (Rr) Value too low Value too high Strong 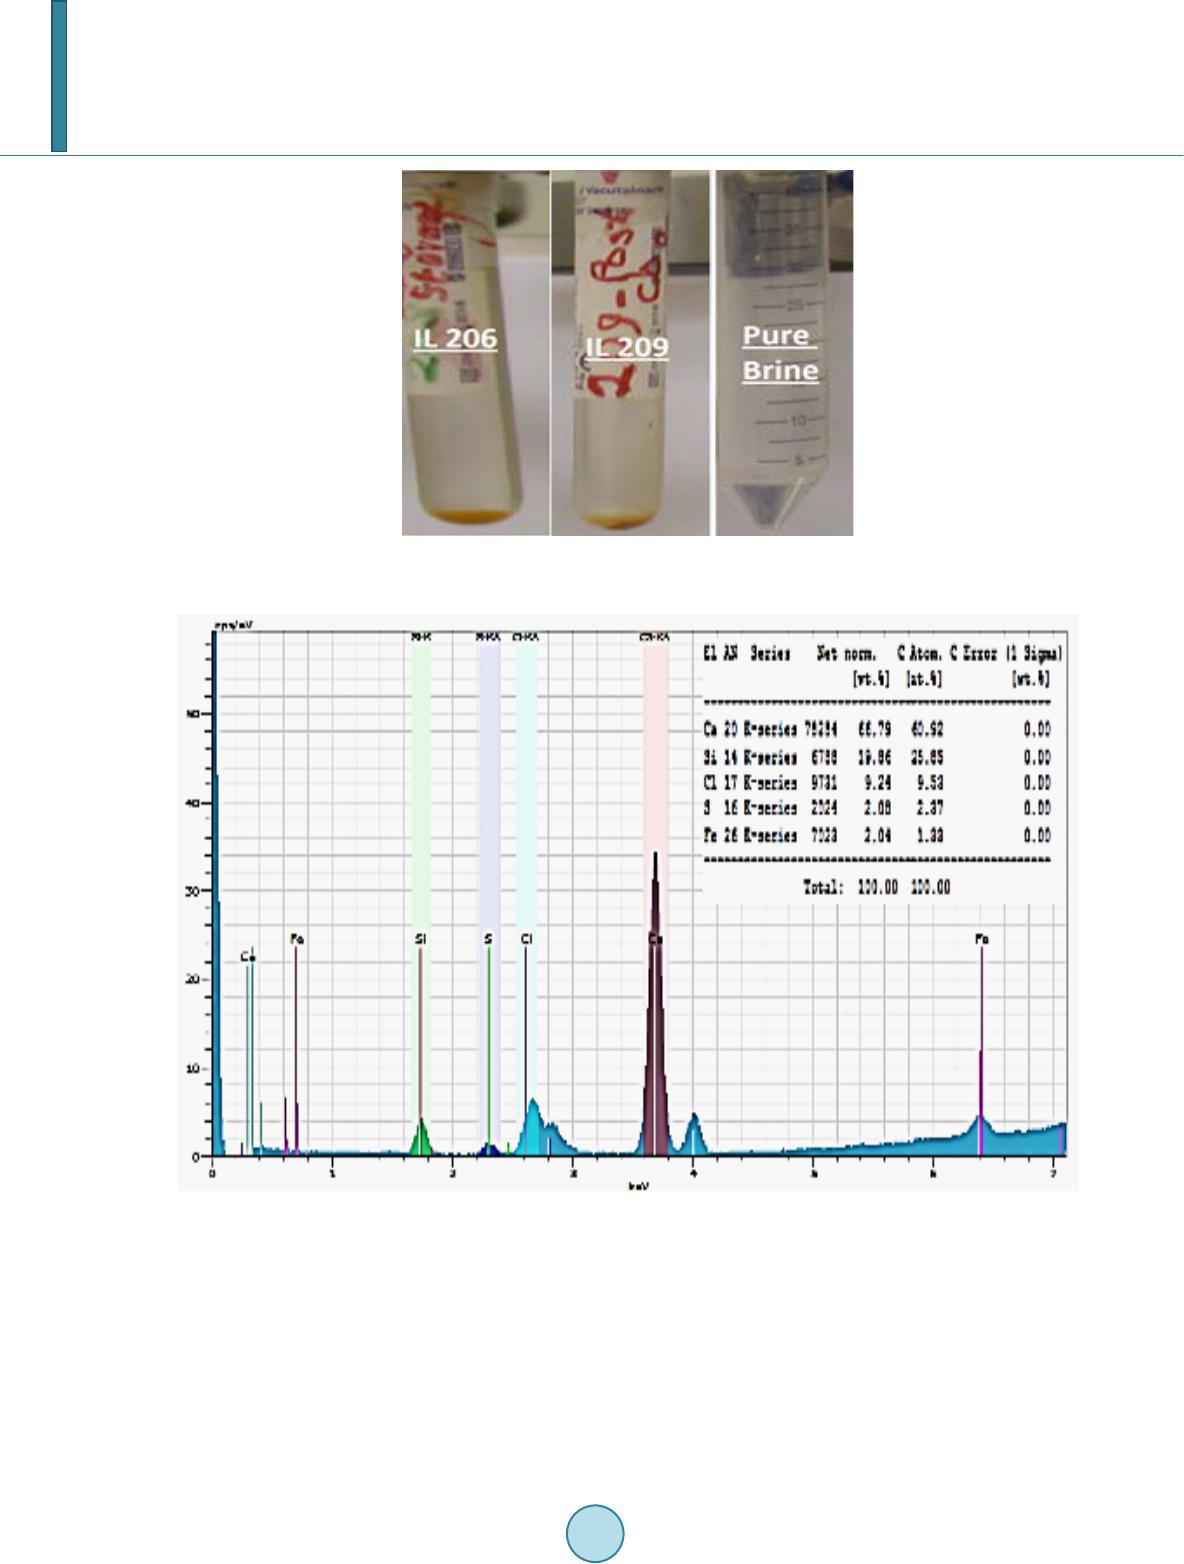 A. Adebayo, M. Mahmoud 6 Figure 4. Brine effluent after CO2 storage. Sediments seen at the bottom. Figure 5. XRFD analysis on precipitates. 2) Successful interpretation of this electrical signature can be a breakthrough in the understanding of miner- alization process in CO2 sequestration projects. 3) Results showed that drop in formation resistivity does not necessarily mean migration of CO2 away from the location but can be due to CO2/brine/rock interaction 4) Collected brine effluents from storage showed carbon dioxide-rock fluid-rock interaction while XRFD analysis on precipitates showed that carbonate minerals and cementing materials dissolved in brine solution. 5) Rock permeability have also been found to be significantly impaired by formation damage while porosity seems to be slightly improved or remained unchanged.  A. Adebayo, M. Mahmoud 7 Figure 6. Porosity and permeability for IL-206 and IL-209. Acknowledgements The authors are grateful to the King Fahd University of Petroleum & Minerals and the King Abdul-Aziz Center for Science and Technology-Technology Innovation Center on Carbon Capture and Sequestration (KAC S T- TIC-CCS) for their support under project number KACST-TIC-CCS-6. References Bennion, D. B., Thomas, F. B., & Bietz, R. F. (P0003-96). Determination of Initial Fluid Saturations—A Key Factor in By-passed Pay Determination. Benson, S. M., & Cole, D. R. (2008 ). CO2 Sequestration in Deep Sedimentary Formations. Elements, 4, 325-331. http://dx.doi.org/10.2113/gselements.4.5.325 Christensen, N. B., Sherlock, D., & Dodds, K. (2006). Monitoring CO2 Injection with Cross Hole Electrical Resistivity To- mography. Exploration Geophysics, 37, 44-49. http://dx.doi.org/10.1071/EG06044 Gaus, I. (2010). Role and Impact of CO2 Rock Interactions during CO2 Storage in Sedimentary Rocks. International Journal of Greenhouse Gas Control, 4, 73-89. http://dx.doi.org/10.1016/j.ijggc.2009.09.015 Giese, R., Henninges, J., Lüth, S., Morozova, D., Schmidt-Hattenberger, C., Würdemann, H., Zimmer, M., Cosma, C., Juhlin, C., & CO2 SINK Group (2009). Monitoring at the CO2 Sink Site: A Concept Integrating Geophysics, Geochemistry and Microbiology. Energy Procedia, 1, 2251 -2259. http://dx.doi.org/10.1016/j.egypro.2009.01.293 Kiessling, D., Schmidt-hattenberger, C., Schuett, H., Schilling, F., Krueger, K., Schoebel, B., Danckwardt, & Kummero w, E. J. (2010). Geoelectrical Methods for Monitoring Geologi cal CO2 Storage: First Resu lt s from Cross-Hole and Sur- fac e-Do wnhole Measurements fr o m the CO2 SINK Te st s It Eat Ketzin (Germany). International Journal of Greenhouse Gas Control, 4, 816-82 6. ht tp ://dx. do i.o rg/ 10. 1016 /j .i jggc. 201 0.05. 001 Nakatsuka, Y., Xue, Z., Garcia, H., & Matsuoka, T (2010). Experimental Study on Monitoring and Quantification of Stored CO2 in Saline Formation Using Resistivity Measure ments. International Journal of Greenhouse Gas Control, 4, 209-216 . http://dx.doi.org/10.1016/j.ijggc.2010.01.001 Wang, S., & Jaffe, P. R. (2004). Dissolution of a Mineral Phase in Potable Aquifers Due to CO2 Releases from Deep Forma- tions; Effect of Dissolution Kinetics. Energy Conversion and Management, 45, 2833-2848. http://dx.doi.org/10.1016/j.enconman.2004.01.002 Wang, S., Lee, M., Park, M.K., & Kim, J (2010). Box Experiments on Monitoring the CO2 Migration in a Homogeneous Medium Using Electrical Resistivity Survey. Geoscience Journal, 14, 77-85. http://dx.doi.org/10.1007/s12303-010-0009-1 |