

Paper Menu >>
Journal Menu >>
 Journal of Intelligent Learning Systems and Applications, 2011, 3, 82-89 doi:10.4236/jilsa.2011.32010 Published Online May 2011 (http://www.SciRP.org/journal/jilsa) Copyright © 2011 SciRes. JILSA Predicting Stock Prices Using Polynomial Classifiers: The Case of Dubai Financial Market Khaled Assaleh1, Hazim El-Baz2, Saeed Al-Salkhadi2 1Department of Electrical Engineering, American University of Sharjah, Sharjah, UAE; 2Engineering Systems Management Graduate Program, American University of Sharjah, Sharjah, UAE. Email: [email protected] Received July 10th, 2010; revised October 1st, 2010; accepted December 1st, 2010. ABSTRACT Predicting stock price movements is a challenging task for academicians and practitioners. In particular, forecasting price movements in emerging markets seems to be more elusive because they are usually more volatile often accompa- nied by thin trading-volumes and they are susceptible to more manipulation compared to mature markets. Technical analysis of stocks and commodities has become a science on its own; quantitative methods and techniques have been applied by many practitioners to forecast price movements. Lagging and sometimes leading technical indicators pro- vide rich quantitative tools for traders and investors in their attempt to gain advantage when making investment or trading decisions. Artificial Neural Networks (ANN) have been used widely in predicting stock prices because of their capability in capturing the non-linearity that often exists in price movements. Recently, Polynomial Classifiers (PC) have been applied to various recognition and classification application and showed favorable results in terms of recog- nition rates and computational complexity as compared to ANN. In this paper, we present two prediction models for predicting securities’ prices. The first model was developed using back propagation feed forward neural networks. The second model was developed using polynomial classifiers (PC), as a first time application for PC to be used in stock prices prediction. The inputs to both models were identical, and both models were trained and tested on the same data. The study was conducted on Dubai Financial Market as an emerging market and applied to two of the market’s leading stocks. In general, both models achieved very good results in terms of mean absolute error percentage. Both models show an average error around 1.5% predicting the next day price, an average error of 2.5% when predicting second day price, and an average error of 4% when predicted the third day price. Keywords: Dubai Financial Market, Polynomial Classifiers, Stock Market, Neural Networks 1. Introduction Accurate prediction of stock prices presents a challeng- ing task for traders and investors. Multitude of economi- cal, social, political and psycho logical factors interacts in a complex way to form stock movement patterns. The early Efficient Market Theory (EMT) claims that prices move in a random way and it is not possible to develop an algorithm of any kind that predicts stock prices [1]. Other researchers contradicted this claim and presented considerable evidence showing that stock prices are, to some extent, predictable. Forecasting or predicting stock prices may be done following one or a combination of four approaches: fundamental analysis approach, techni- cal analysis approach, time series forecasting and ma- chine learning. Each approach has its own merits as well as limitations. In recent years, ANN has been successfully used for modeling financial time series. For example, the back propagation ANN was used to forecast future price movements of Kuala Lumpur Stock Exchange which is major emerging market [2]. Brownstone [3] reported the prediction error of neural networks measured by the mean square error and the root mean square error to pre- dict daily market close 5 days and 25 days ahead for the Financial Times Stock Exchange (FTSE) in the UK. Lee and Jo [4] developed an expert system using the Japanese Candlestick chart patterns to predict th e proper timing of stocks and reported a success ratio of 72% of their sys- tem. Template matching, from pattern recognition, and the feed forward neural networks were combined and used to forecast stock market activity in the New York Stock Exchange Composite index [5]. Another learning system that integrates genetic algorithm (GA) and Sup-  Predicting Stock Prices Using Polynomial Classifiers: The Case of Dubai Financial Market83 port Vector machines (SVM) for stock market prediction was reported by Choudhry and Garg [6]. The next day stock price of stock market indexes using a hybrid ap- proach that integrates both GA and ANN was reported by Armano et al. [7]. In a different but related application, the NN was used to capture the underlying rules of movements in currency exchange rates with reasonable results in [8]. The use of Artificial Neural Networks to predict stock market behavior in terms of its direction was reported in [9] for Istanbul Stock Exchange where the historical data was grouped in seven different predic- tion systems models to which eight different ANN and Logistics Regressions models were applied. Chena et al. [10] used the probabilistic neural network (PNN) to forecast the direction of Taiwan Stock Marekt Index re- turn using historical data. Enke and Thawornwong [11] combined information gain technique of data mining and Neural Network to evaluate the predictive relationship of financial and economic variables. Caoa et al. [12] com- pared financial forecasting linear models to the predictive power of univariate and multivariate Neural Networks for the Chinese stock market. Kaastra and Boyd [13] provided an eight-step procedure to design neural net- work forecasting model with trade-offs in parameters selection and common pitfalls. Kohzadi et al. [14] ex- amined whether neural networks can outperform a tradi- tional autoregressive integrated moving average (ARIMA) model for forecasting commodity prices. Olsona Mossmanb [15] compared the prediction accuracy of neural network and logistic regression technique using historical data of Canadian Stock exchange Common to all the reviewed predictio n methods is the use of a pattern classifier which in most cases is some sort of a neural classifier. Whether used to model the manifolds of each class or to discriminate the patterns of different classes, neural classifiers can be divided into relative density models and discriminative models. Ex- amples of relative density models include linear mixture models and auto-association networks. Whereas, dis- criminative neural classifiers include the multi-layer per- ceptron (MLP), the radial basis function (RBF) networks, and the polynomial classifier (PC) [16]. PCs can be described as higher-order neural networks which consist of a single-layer network with the polyno- mial terms of patterns feature as inputs [16]. The poly- nomial classifiers are learning algorithms proposed and adopted in recent years for regression, classification and recognition with significant properties and generalization capability [16]. Due to their need for less training examples and far less computational requirements, PCs have shown supe- rior performance to multilayer neural networks. Polyno- mial classifiers have been successfully used for various pattern recognition and signal detection applications in- cluding speech and speaker recognition [17,18]. Another recent study on the recognition of sign language alphabet using polynomial classifiers delivered superior recogni- tion results [19] over Adaptive Neurofuzzy Inference systems (ANFIS). More applications of PCs have been reported in modeling of tool wear [20,21] and noninva- sive fetal ECG extraction. This paper describes the use of the Polynomial Classi- fiers (PC) to predict stock prices in the Dubai Financial Market in the United Arab Emirates and compares the results with those obtained by using Artificial Neural Networks ( ANN). It is worth mentioning here that, at the time of this re- search, literature review revealed that there is no reported research that applied the polynomial classifiers for the prediction of stock price movements. In addition, there were no research found that reported using neural net- work to predict stock price movements in Dubai Finan- cial Market. 2. Dubai Financial Market (DFM) In the last years of the previous century, the United Arab Emirates (UAE) became one of the fastest developing countries in the Middle East and South Asia. Dubai, which is considered the commercial capital and the cen- ter of international business in the UAE, has taken the leadership in developing and modernizing both govern- mental and private sectors with state-of-the-art strategies, policies, technologies and infrastructu re. One of the fast- est and most powerful growing sectors in the UAE is finance. On March 26th, 2000, Dubai Financial Market com- menced operation with listing shares of seven companies and ten brokers. DFM has grown rapidly and has scored noticeable records in terms of trading volume and market values. At the time of this study, more than 50 companies are listed with the DFM and it is considered one of the leading financial markets in the Middle East. Two of DFM’s leading stocks were selected for this research; Emaar Properties (EMAAR) and Dubai Islamic Bank (DIB). EMAAR is the leading real estate developer in the Middle East and DIB the world’s first fully- fledged Islamic bank. These stocks were chosen because they have sufficient historical data, actively traded, and each to represent different sectors in the UAE economy. The data used for both stocks is the closing prices cover- ing the period of April 2000 to March 2006 (total of 2176 data points). These data points are the daily closing stock prices in the currency of the United Arab Emirates Dir- ham (AED). The AED is tied with the USD with a con- version rate of approximately 1 USD = 3.67 AED. Copyright © 2011 SciRes. JILSA  Predicting Stock Prices Using Polynomial Classifiers: The Case of Dubai Financial Market 84 3. Background of Modeling Techniques In this work we have used Artificial Neural Networks (ANN) and Polynomial Classifiers (PC) as modeling techniques to predict stock prices from historical price data. The ANN that we used is the standard feed forward architecture trained with the standard back propagation method. Since this architecture is widely used and very well known we felt th at it would be redundant to exp lain it here. The reader can refer to [2] for more details about feed forward back propagation ANN. On the other hand polynomial classifier being used for the first time for this application is explained here with adequate details. 3.1. Polynomial Classifiers Polynomial Classifiers (PCs) provide an efficient method for describing non-linear input/output relationships. To model a sequence of input/output data using polynomial classifiers, a set of parameters, also referred to as weights, are determined such that the multi-dimensional feature vectors, which represent the input sequence, are best mapped to the corresponding output sequence. For the problem at hand (i.e. stock price prediction) our input is a sequence of feature vectors formed from the historical prices of the stock being studied. For each of the input feature vectors the corresponding output is the future price of t he s tock. Consequently, the training data is arranged into a N d-dimensional feature vectors arranged in the N × d ma- trix X, along with its corresponding N dimensional col- umn vector tx representing the target vector (future prices). For instance, to predict the next day price from the previous d days we arrange the given training time series of di mension N + d + 1 data as follows. 112 223 1 d d1 N NN Nd xx x xx x xx x x x X x 1 2 1 d d x Nd x x x t A Kth order polynomial classifier consists of Kth order polynomial expansion of the d-dimensional feature vec- tor, x, resulting in a higher dimensional vector, p(x). For example, if 112 x xx, then its second order polyno- mial expansion results in the following 6th dimensional vector. 22 121 212 1 x xxxxx px Hence, for a sequence of N: d-dimensional feature vec- tors, the Kth order polynomial expansion results in the Nx6 matrix M; where, T 12 N Mpxpx px The polynomial classifier is then trained using the ex- panded v ectors, M, to approximate the target using mean squared error as its decisive factor to determine its opti- mum syste m parameters (weights), w; such as 2 argmin x w wMwt which results in the well-known solution 1 TT x wMMMt On testing the trained model, an unknown feature vector, z, is expanded to its polynomial terms, p(z) and by using the previously obtained weights the corre- sponding output (predicted future price) tz, is obtained as follows. ztwpz 4. Methodology 4.1. Training Scenarios In this research, the neural network and polynomial clas- sifiers prediction model are trained on three different training scenarios. These scenarios refer to the number of data points used for training and for validation. In sce- nario #1, 1/3 of the data is used for training and the other 2/3 is used for validation, while in scenario #2, 1/2 of the data is used for training and the other 1/2 is used for va- lidation. In scenario #3, 2/3 of the data is used for train- ing and the remaining 1/3 is used for validation. The portion of data used for training in the three sce- narios consists of data points captured from different periods throughout the available historical data. For ex- ample, in scenario #1, if five hundred data points to be used for training and the remaining 1000 points for vali- dation, then these points will not be taken from one block of the historical data. Instead, several blocks from dif- ferent periods will form the total five hundred points by taking the first hundred from early data stream, the next two hundred from some middle data, and the last two hundred will be somewhere around most recent data. This technique is used to assure that both the NN and the PC prediction methods will learn different market situations and various price patterns in the various mar- ket conditions of bear market (period of decline), con- solidating market (period of neither growth nor decline), and bull market (per iod of growth). Copyright © 2011 SciRes. JILSA  Predicting Stock Prices Using Polynomial Classifiers: The Case of Dubai Financial Market85 6 7 n d d d n d d 4.2. Prediction Modes Two modes of prediction will be used for predicting stock prices in this study. Mode 1: Predicting the next day given the five preced- ing days: In this mode, the inputs to the model are the closing prices of the previous five trading days, and the desired output (target) is closing price for the following trading day. 15 26 51nn dd dd dd Mode 2: Predicting the next three days given the twelve preceding days: Similar to the previous mode, however in this mode, the inputs are increased to cover the previous twelve trading days, while the desired output still be the closing prices for the following three trading days. 111314 15 211415 16 1432 1nnnn dddd dddd dd ddd 4.3. Implementation of Prediction Models In this study, two techniques were used for predicting stock prices. The first technique is Neural Networks and the second technique is Polynomial Classifiers. The same inputs are used for both techniques; namely, the histori- cal stocks daily closing prices as explained in Section 4.2. Likewise, the desired outputs (targets) for both tech- niques are the corresponding future prices according to the prediction modes described in Section 4.2. The criteria used to measure the prediction accuracy for both the NN and PC is related to the difference be- tween the predicted closing prices and the actual closing prices, as follows. Let, n P ˆ P = Actual closing price for day nine AED n N = Predicted closing price for day nine AED = Number of days in validation n = prediction error for day nine AED Then the prediction error for day n is given by ˆ nn PP n , while the prediction error percentage relative to the ac- tual closing price for day n is g i ven by %100 n n n P Additionally, the mean absolute error (MAE) in AED over N days is given b y 1 1N n n N , and the mean absolute error percen tage (MAEP) is given by 1 1 %% N n n N 4.3.1. N eu ral Network Predi ction Technique The neural network architecture used here is the multi- layer feed forward architecture with one input layer, one hidden layer and one output layer. The training method used here is the standard back propagation method. The network is implemented via MATLAB and the training parameters were set properly to insure convergence for the two prediction modes explained in Section 4.2. For each mode, different ANN models were developed for the three training scenarios as explained in Section 4.3. Consequently, for all the combinations of the three train- ing scenarios and the two prediction modes, 6 different ANNs we r e g enerated . 4.3.2. Polynomial Classifier Prediction Technique The inputs and targets used in training the polynomial classifier technique were identical to those used in the neural network technique following the three training scenarios and the two prediction modes. However, for each one of the 6 combinations two PCs were created; one is a 1st order PC and the other is a 2nd order PC. The results obtained from the different ANN and PC combi- nations are reported in th e following section. 5. Experimental Results and Discussion 5.1. Neural Network Prediction Model The three training scenarios with two prediction modes were applied to EMAAR and DIB stocks. Following are the results obtained for Mode 1 and Mode 2 for both stocks under study. 5.1.1. Mode 1: Predicting the Next Day Given the Previous Five Days 5.1.1.1. Emaar Properties (EMAAR) Figure 1 shows that ANN achieves a small mean abso- lute error percentage (MAEP) in all three training sce- narios. As expected, the MAEP decreases as the amount of training data is increased. However, the MAEP is still acceptable even with using only 1/3 of the data for train- ing (i.e. training scenario #1). It is worth noting here that the distribution of the pre- diction error (in AED) is found to have a small spread around its average which is close to zero. An example of the distribution of prediction error is depicted in Figure 2 % Copyright © 2011 SciRes. JILSA 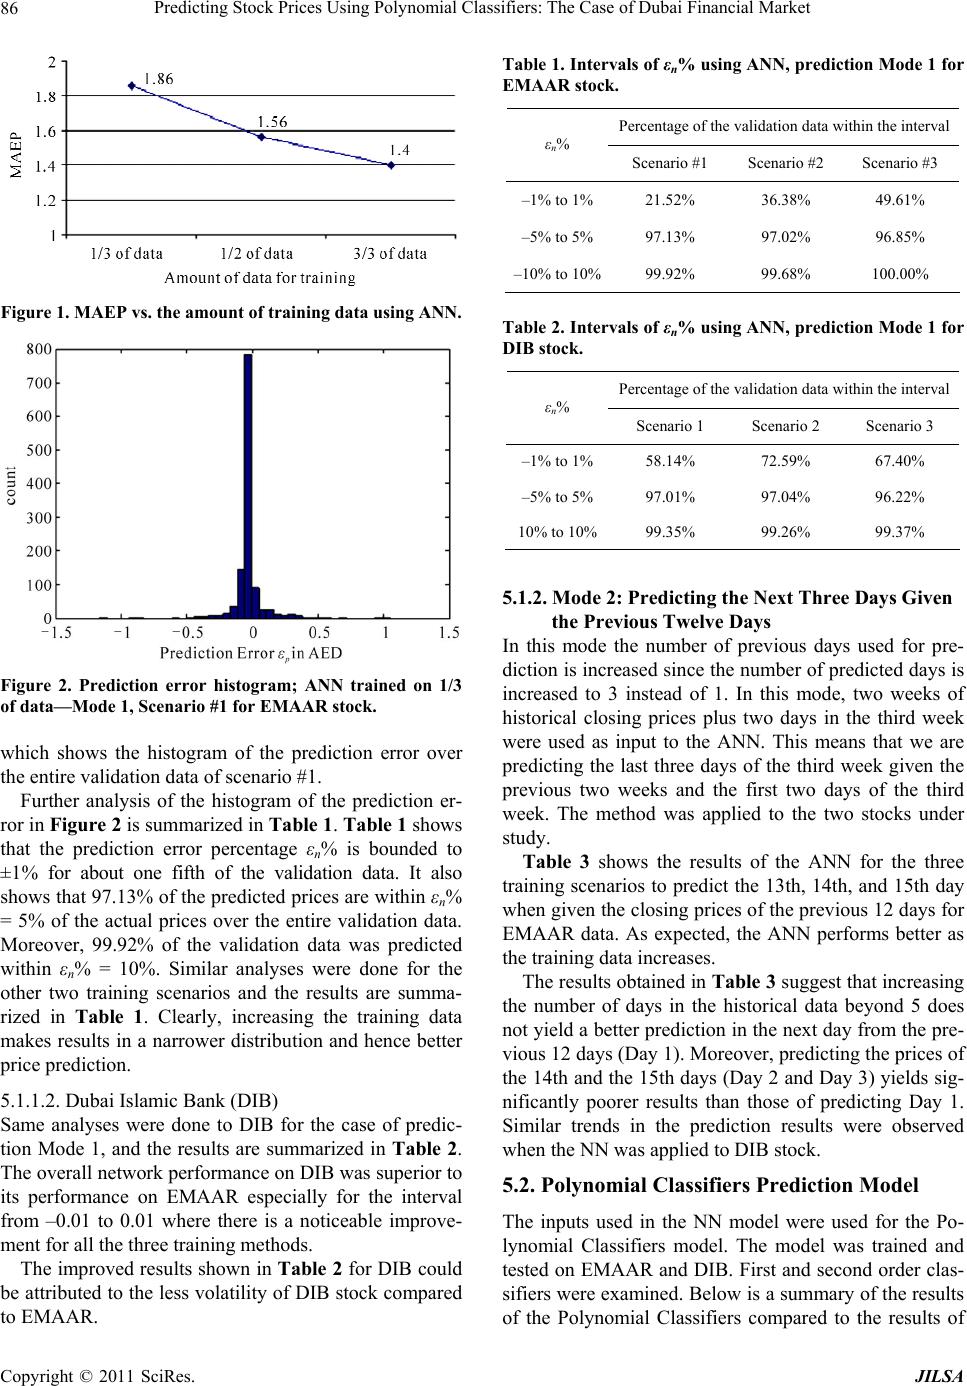 Predicting Stock Prices Using Polynomial Classifiers: The Case of Dubai Financial Market 86 Figure 1. MAEP vs. the amount of training data using ANN. Figure 2. Prediction error histogram; ANN trained on 1/3 of data—Mode 1, Scenario #1 for EMAAR stock. which shows the histogram of the prediction error over the entire validation data of scenario #1. Further analysis of the histogram of the prediction er- ror in Figure 2 is summarized in Table 1. Ta b l e 1 shows that the prediction error percentage εn% is bounded to ±1% for about one fifth of the validation data. It also shows that 97.13% of the pr edicted prices are within εn% = 5% of the actual prices over the entire validation data. Moreover, 99.92% of the validation data was predicted within εn% = 10%. Similar analyses were done for the other two training scenarios and the results are summa- rized in Table 1. Clearly, increasing the training data makes results in a narrower distribution and hence better price prediction. 5.1.1. 2 . Dubai Islamic Bank (D IB) Same analyses were done to DIB for the case of predic- tion Mode 1, and the results are summarized in Table 2. The overall network performance on DIB was superior to its performance on EMAAR especially for the interval from –0.01 to 0.01 where there is a noticeable improve- ment for all the three training methods. The improved results shown in Table 2 for DIB could be attributed to the less volatility o f DIB stock compared to EMAAR. Table 1. Intervals of εn% using ANN, prediction Mode 1 for EMAAR stock. Percentage of the validation data within the interval εn% Scenario #1 Scenario #2 Scenario #3 –1% to 1% 21.52% 36.38% 49.61% –5% to 5% 97.13% 97.02% 96.85% –10% to 10%99.92% 99.68% 100.00% Table 2. Intervals of εn% using ANN, prediction Mode 1 for DIB stock. Percentage of the validation data within the interval εn% Scenario 1 Scenario 2 Scenario 3 –1% to 1% 58.14% 72.59% 67.40% –5% to 5% 97.01% 97.04% 96.22% 10% to 10%99.35% 99.26% 99.37% 5.1.2. Mode 2: Predicting the Next Three Days Given the Previous Twelve Days In this mode the number of previous days used for pre- diction is increased since the number of predicted days is increased to 3 instead of 1. In this mode, two weeks of historical closing prices plus two days in the third week were used as input to the ANN. This means that we are predicting the last three days of the third week given the previous two weeks and the first two days of the third week. The method was applied to the two stocks under study. Table 3 shows the results of the ANN for the three training scenarios to predict the 13th, 14th, and 15th day when given the closing prices of the previous 12 days for EMAAR data. As expected, the ANN performs better as the training data increases. The results obtained in Table 3 suggest that increasing the number of days in the historical data beyond 5 does not yield a better prediction in the next day from the pre- vious 12 days (Day 1). Mor eover, pr ed icting the pr ices of the 14th and the 15th days (Day 2 and Day 3) yields sig- nificantly poorer results than those of predicting Day 1. Similar trends in the prediction results were observed when the NN was applied to DIB stock. 5.2. Polynomial Classifiers Prediction Model The inputs used in the NN model were used for the Po- lynomial Classifiers model. The model was trained and tested on EMAAR and DIB. Fir st and second order clas- sifiers were examined. Below is a summary of the results of the Polynomial Classifiers compared to the results of Copyright © 2011 SciRes. JILSA 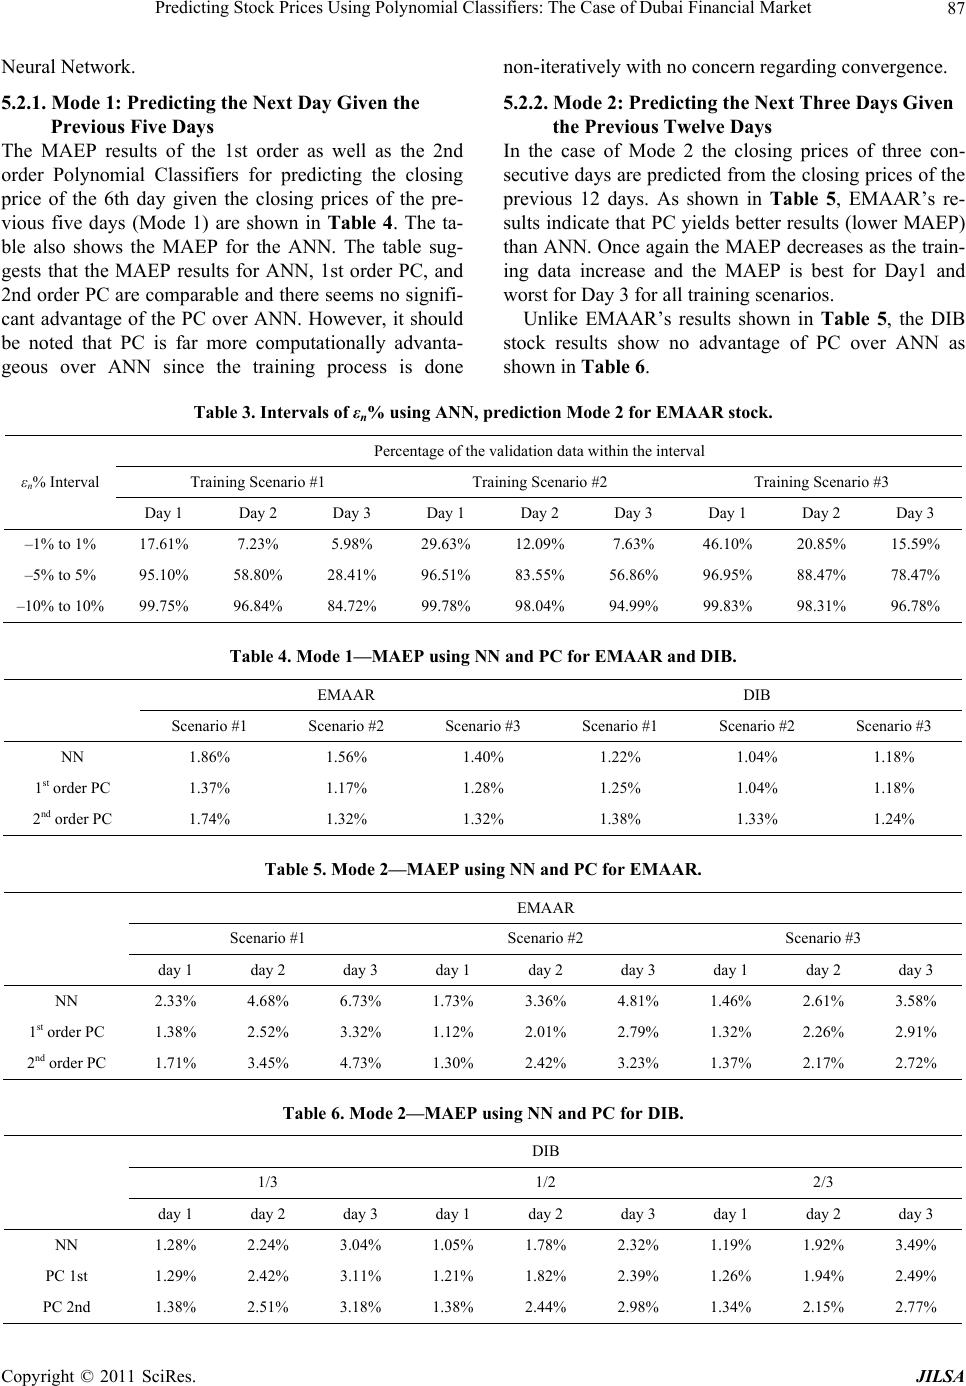 Predicting Stock Prices Using Polynomial Classifiers: The Case of Dubai Financial Market Copyright © 2011 SciRes. JILSA 87 Neural Network. 5.2.1. Mode 1: Predicting the Next Day Given the Previous Five Days The MAEP results of the 1st order as well as the 2nd order Polynomial Classifiers for predicting the closing price of the 6th day given the closing prices of the pre- vious five days (Mode 1) are shown in Table 4. The ta- ble also shows the MAEP for the ANN. The table sug- gests that the MAEP results for ANN, 1st order PC, and 2nd order P C are co mparable an d there seems no signifi- cant advantage of the PC over ANN. However, it should be noted that PC is far more computationally advanta- geous over ANN since the training process is done non-iteratively with no concern regarding convergence. 5.2.2. Mode 2: Predicting the Next Three Days Given the Previous Twelve Days In the case of Mode 2 the closing prices of three con- secutive days ar e predicted from the closing prices of the previous 12 days. As shown in Table 5, EMAAR’s re- sults indicate that PC yields better results (lower MAEP) than ANN. Once again the MAEP decreases as the train- ing data increase and the MAEP is best for Day1 and worst for Day 3 for all training scenarios. Unlike EMAAR’s results shown in Table 5, the DIB stock results show no advantage of PC over ANN as shown in Table 6. Table 3. Intervals of εn% using ANN, prediction Mode 2 for EMAAR stock. Percentage of the validation data within the interval Training Scenario #1 Training Scenario #2 Training Scenario #3 εn% Interval Day 1 Day 2 Day 3 Day 1 Day 2 Day 3 Day 1 Day 2 Day 3 –1% to 1% 17.61% 7.23% 5.98% 29.63% 12.09% 7.63% 46.10% 20.85% 15.59% –5% to 5% 95.10% 58.80% 28.41% 96.51% 83.55% 56.86% 96.95% 88.47% 78.47% –10% to 10% 99.75% 96.84% 84.72% 99.78% 98.04% 94.99% 99.83% 98.31% 96.78% Table 4. Mode 1—MAEP using NN and PC for EMAAR and DIB. EMAAR DIB Scenario #1 Scenario #2 Scenario #3 Scenario #1 Scenario #2 Scenario #3 NN 1.86% 1.56% 1.40% 1.22% 1.04% 1.18% 1st order PC 1.37% 1.17% 1.28% 1.25% 1.04% 1.18% 2nd order PC 1.74% 1.32% 1.32% 1.38% 1.33% 1.24% Table 5. Mode 2—MAEP using NN and PC for EMAAR. EMAAR Scenario #1 Scenario #2 Scenario #3 day 1 day 2 day 3 day 1 day 2 day 3 day 1 day 2 day 3 NN 2.33% 4.68% 6.73% 1.73% 3.36% 4.81% 1.46% 2.61% 3.58% 1st order PC 1.38% 2.52% 3.32% 1.12% 2.01% 2.79% 1.32% 2.26% 2.91% 2nd order PC 1.71% 3.45% 4.73% 1.30% 2.42% 3.23% 1.37% 2.17% 2.72% Table 6. Mode 2—MAEP using NN and PC for DIB. DIB 1/3 1/2 2/3 day 1 day 2 day 3 day 1 day 2 day 3 day 1 day 2 day 3 NN 1.28% 2.24% 3.04% 1.05% 1.78% 2.32% 1.19% 1.92% 3.49% PC 1st 1.29% 2.42% 3.11% 1.21% 1.82% 2.39% 1.26% 1.94% 2.49% PC 2nd 1.38% 2.51% 3.18% 1.38% 2.44% 2.98% 1.34% 2.15% 2.77% 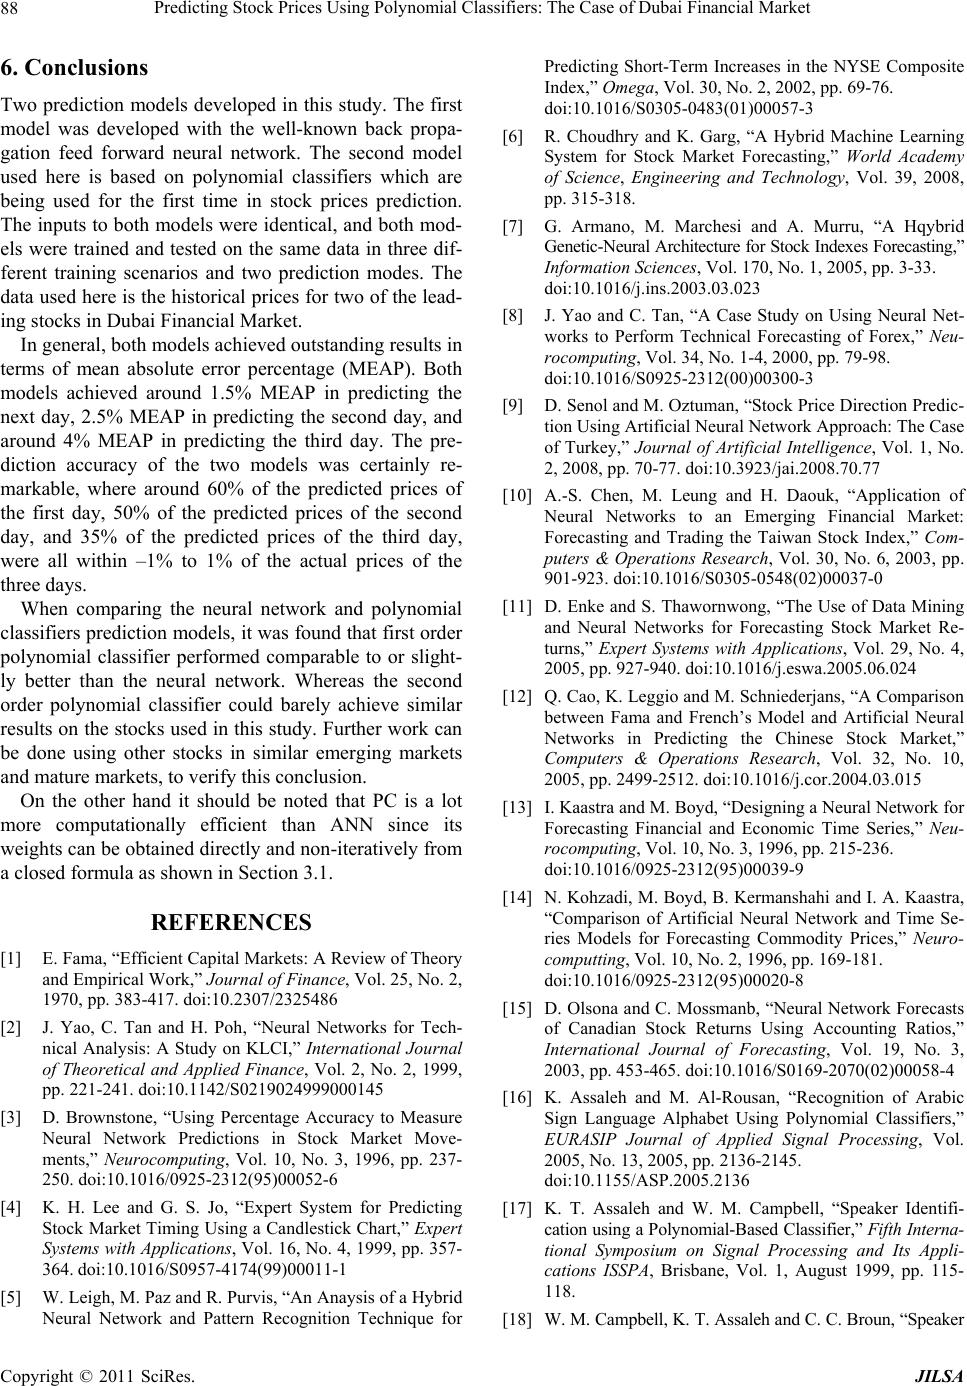 Predicting Stock Prices Using Polynomial Classifiers: The Case of Dubai Financial Market 88 6. Conclusions Two prediction models developed in this study. The first model was developed with the well-known back propa- gation feed forward neural network. The second model used here is based on polynomial classifiers which are being used for the first time in stock prices prediction. The inputs to both models were identical, and bo th mod- els were trained and tested on the same data in three dif- ferent training scenarios and two prediction modes. The data used here is the historical p rices for two of the lead- ing stocks in Dubai F i n ancial Market. In general, both models achieved outstanding resu lts in terms of mean absolute error percentage (MEAP). Both models achieved around 1.5% MEAP in predicting the next day, 2.5% MEAP in predicting the second day, and around 4% MEAP in predicting the third day. The pre- diction accuracy of the two models was certainly re- markable, where around 60% of the predicted prices of the first day, 50% of the predicted prices of the second day, and 35% of the predicted prices of the third day, were all within –1% to 1% of the actual prices of the three days. When comparing the neural network and polynomial classifiers prediction models, it was found that first order polynomial classifier performed comparable to or slight- ly better than the neural network. Whereas the second order polynomial classifier could barely achieve similar results on the stocks used in this study. Further work can be done using other stocks in similar emerging markets and mature markets, to verify this conclusion. On the other hand it should be noted that PC is a lot more computationally efficient than ANN since its weights can be obtained directly an d non-iteratively fro m a closed formula as shown in Section 3.1. REFERENCES [1] E. Fama, “Efficient Capital Markets: A Review of Theory and Empirical Work,” Journal of Finance, Vol. 25, No. 2, 1970, pp. 383-417. doi:10.2307/2325486 [2] J. Yao, C. Tan and H. Poh, “Neural Networks for Tech- nical Analysis: A Study on KLCI,” International Journal of Theoretical and Applied Finance, Vol. 2, No. 2, 1999, pp. 221-241. doi:10.1142/S0219024999000145 [3] D. Brownstone, “Using Percentage Accuracy to Measure Neural Network Predictions in Stock Market Move- ments,” Neurocomputing, Vol. 10, No. 3, 1996, pp. 237- 250. doi:10.1016/0925-2312(95)00052-6 [4] K. H. Lee and G. S. Jo, “Expert System for Predicting Stock Market Timing Using a Candlestick Chart,” Expert Systems with Applications, Vol. 16, No. 4, 1999, pp. 357- 364. doi:10.1016/S0957-4174(99)00011-1 [5] W. Leigh, M. Paz and R. Purvis, “An Anaysis of a Hybrid Neural Network and Pattern Recognition Technique for Predicting Short-Term Increases in the NYSE Composite Index,” Omega, Vol. 30, No. 2, 2002, pp. 69-76. doi:10.1016/S0305-0483(01)00057-3 [6] R. Choudhry and K. Garg, “A Hybrid Machine Learning System for Stock Market Forecasting,” World Academy of Science, Engineering and Technology, Vol. 39, 2008, pp. 315-318. [7] G. Armano, M. Marchesi and A. Murru, “A Hqybrid Genetic- Neural Architect ure for Stoc k Indexes Forecasting,” Information Sciences, Vol. 170, No. 1, 2005, pp. 3-33. doi:10.1016/j.ins.2003.03.023 [8] J. Yao and C. Tan, “A Case Study on Using Neural Net- works to Perform Technical Forecasting of Forex,” Neu- rocomputing, Vol. 34, No. 1-4, 2000, pp. 79-98. doi:10.1016/S0925-2312(00)00300-3 [9] D. Senol and M. Oztuman, “Stock Price Direction Predic- tion Using Artificial Neural Network Approach: The Case of Turkey,” Journal of Artificial Intelligence, Vol. 1, No. 2, 2008, pp. 70-77. doi:10.3923/jai.2008.70.77 [10] A.-S. Chen, M. Leung and H. Daouk, “Application of Neural Networks to an Emerging Financial Market: Forecasting and Trading the Taiwan Stock Index,” Com- puters & Operations Research, Vol. 30, No. 6, 2003, pp. 901-923. doi:10.1016/S0305-0548(02)00037-0 [11] D. Enke and S. Thawornwong, “The Use of Data Mining and Neural Networks for Forecasting Stock Market Re- turns,” Expert Systems with Applications, Vol. 29, No. 4, 2005, pp. 927-940. doi:10.1016/j.eswa.2005.06.024 [12] Q. Cao, K. Leggio and M. Schniederjans, “A Comparison between Fama and French’s Model and Artificial Neural Networks in Predicting the Chinese Stock Market,” Computers & Operations Research, Vol. 32, No. 10, 2005, pp. 2499-2512. doi:10.1016/j.cor.2004.03.015 [13] I. Kaastra and M. Boyd, “Designing a Neural Network for Forecasting Financial and Economic Time Series,” Neu- rocomputing, Vol. 10, No. 3, 1996, pp. 215-236. doi:10.1016/0925-2312(95)00039-9 [14] N. Kohzadi, M. Boyd, B. Kermanshahi and I. A. Kaastra, “Comparison of Artificial Neural Network and Time Se- ries Models for Forecasting Commodity Prices,” Neuro- computting, Vol. 10, No. 2, 1996, pp. 169-181. doi:10.1016/0925-2312(95)00020-8 [15] D. Olsona and C. Mossmanb, “Neural Network Forecasts of Canadian Stock Returns Using Accounting Ratios,” International Journal of Forecasting, Vol. 19, No. 3, 2003, pp. 453-465. doi:10.1016/S0169-2070(02)00058-4 [16] K. Assaleh and M. Al-Rousan, “Recognition of Arabic Sign Language Alphabet Using Polynomial Classifiers,” EURASIP Journal of Applied Signal Processing, Vol. 2005, No. 13, 2005, pp. 2136-2145. doi:10.1155/ASP.2005.2136 [17] K. T. Assaleh and W. M. Campbell, “Speaker Identifi- cation using a Polynomial-Based Classifier,” Fifth Interna- tional Symposium on Signal Processing and Its Appli- cations ISSPA, Brisbane, Vol. 1, August 1999, pp. 115- 118. [18] W. M. Campbell , K. T. Assaleh a nd C. C. Broun, “Speake r Copyright © 2011 SciRes. JILSA  Predicting Stock Prices Using Polynomial Classifiers: The Case of Dubai Financial Market89 Recognition with Polynomial Classifiers,” IEEE Trans- actions on Speech and Audio Processing, Vol. 10, No. 4, May 2002, pp. 205-212. doi:10.1109/TSA.2002.1011533 [19] C.-L. Liu and H. Sako, “Class-Specific Feature Polyno- mial Classifier for Pattern Classification and Its Applica- tion to Handwritten Numeral Recognition,” Pattern Rec- ognition, Vol. 39, No. 4, 2006, pp. 669-681. doi:10.1016/j.patcog.2005.04.021 [20] I. Deiab, K. Assaleh and F. Hammad, “On Modeling of Tool Wear Using Sensor Fusion and Polynomial Classifi- ers,” Mechanical Systems and Signal Processing, Vol. 23, No. 5, July 2009, pp. 1719-1729. doi:10.1016/j.ymssp.2009.02.001 [21] K. Assaleh and H. Al-Nashash, “A Novel Technique for the Extraction of Fetal ECG Using Polynomial Net- works,” IEEE Transactions on Biomedical Engineering, Vol. 52, No. 6, June 2005, pp. 1148-1152. doi:10.1109/TBME.2005.844046 Copyright © 2011 SciRes. JILSA |