

Paper Menu >>
Journal Menu >>
 HEALTH, 2009, 1, 24-30 Published Online June 2009 in SciRes. http://www.scirp.org/journal/health Geometrical study on diseaserelated ncRNAs based on Z-curve method Yan-Ling Yang1,2, Ji-Hua Wang1,2 1Key Lab for Biophysics in Universities of Shandong, Jinan, Shandong, P. R. China; 2Physics Department of De Zhou University, De Zhou, Shandong, P. R. China. Email: [email protected] Received 13 April 2009; revised 1 May 2009; accepted 7 May 2009. ABSTRACT The Z curve is a very useful method for visual- izing and analyzing DNA sequences. It is a three-dimensional space curve that constitutes a unique representation of a given DNA se- quence. It becomes more and more important to study non-coding regions in the recent years. Using Z curve method, 15 disease-related ncRNAs and some snoRNAs and miRNAs sequences are selected from the NONCODE database in this paper, which relate to Alzheimer Disease. The corresponding Z curves of the studied ncRNAs, sequences have been mapped and compared. The statistical features of the Z curves are ob- tained. These features indicate that the ncRNAs sequences playing same roles in the celluar process have almost the same Z-curves. And the base content in these sequences is almost same too. Keywor ds: non-codingRNA; Alzheimer disease; snoRNA; miRNA; Z-curve 1. INTRODUCTION It is widely accepted that Non-coding sequences play important roles in the process of translation in organisms ranging from bacteria to mammals [1,2,3]. At the present time the research on non-coding region and its function is still a hot field all over the world. Among the re- searches about non-coding sequences, the study on non- protein-coding RNAs (ncRNAs) is becoming increas- ingly important and has been made great progress al- ready. Traditionally, most RNA molecules were regarded as carriers conveying information from the gene to the translation machinery [4]. However, since the late 1990s, it has been widely acknowledged that other types of non-protein-coding RNA molecules are present in or- ganisms ranging from bacteria to mammals, which affect a large variety of processes including plasmid replication, phage development, bacterial virulence, chromosome structure, DNA transcription, RNA processing and modification, development control and others [5]. These observations suggest that the traditional view of the structure of the genetic reg ‰ ulatory systems in organ- isms is far from complete. And the considerable number of non-coding RNAs (ncRNAs) that has been detected in the past few years was largely unexpected [6]. As new members and classes of ncRNAs being pro- gressively discovered, the understanding of the impor- tance of ncRNAs in basic cellular processes is ever in- creasing. Although the functions of the many recently identified ncRNAs remain mostly unknown, increasing evidence stands in support of the notion that ncRNAs represent a diverse and important functional output of most genomes [7]. Furthermore, the understanding of the significance of ncRNAs as central components of various cellular proc- esses has risen sharply over the recent years. However, there are so many unsolved problems in this field and many of these ncRNAs still have uncharacterized func- tions. Some diseases, which have constituted a threat to human beings, are related to different ncRNAs. Such as Alzheimer disease, cancers, diabetes, heart diseases, etc. [8]. Among these diseases, Alzheimer disease has be- come the fourth-biggest cause of the illness threaten the old men, s lives, next below the cancers,heart diseases and cerebrovascular diseases. Alzheimer disease is a progressive degenerative disorder of the brain character- ized by a slow, progressive decline in cognitive function and behavior. As the disease advances, persons with Alzheimer disease have tough time with daily usage of things like using the phone, cooking, handling money, or driving the car. The disease is more common in elder population. It is estimated that Alzheimer disease affects 15 million people worldwide and approximately 4 mil- lion Americans [9]. The neuropathologic hallmarks of the disorder are amyloid-rich senile plaques, neurofibril- lary tangles, and neuronal degeneration. It has reported that three genes with autosomal domi-  Y. L. Yang et al. / HEALTH 1 (2009) 24-30 25 SciRes Copyright © 2009 HEALTH nant mutations have been identified that may lead to Alzheimer symptoms in carriers before they reach age 60. [10]. The clinical features of Alzheimer disease overlaps with common signs of aging, and other types of dementia, hence the diagnosis remains difficult. We make use the ZCURVE method, which is pro- posed by Professor Zhang Chun-ting, to analysis ncRNAs related to Alzheimer disease. ZCURVE is a geometrical approach to study DNA sequences. Based on the Z curve method, some global and local features of the sequence can be detected in a perceivable way [11]. In this work, we download 15 Specific ncRNAs (BC200 RNA) sequences from the NONCODE database, which relate to Alzheimer disease and come from dif- ferent organisms. The corresponding Z curves of the selected sequences have been mapped and shown. By analyzing and comparing the Z curves, the common features of them are found and the features may be as a criterion to study same type of disease-related ncRNAs. 2. MATERIAL AND METHOD 2.1. Material The NONCODE database is an integrated knowledge database designed for the analysis of non-coding RNAs (ncRNAs). Since NONCODE was first released 3 years ago [15], the number of known ncRNAs has grown rap- idly, and there is growing recognition that ncRNAs play important regulatory roles in most organisms. In the up- dated version of NONCODE (NONCODE v2.0), the number of collected ncRNAs has reached 206 226, in- cluding a wide range of microRNAs, Piwi-interacting RNAs and mRNA- like ncRNAs. The improvements brought to the database include not only new and up- dated ncRNA data sets, but also an incorporation of BLAST alignment search service and access through our custom UCSC Genome Browser [12]. All ncRNAs in NONCODE were filtered automatically from GenBank and the literature, and were then later manually curated. With the exception of rRNAs and tRNAs, all classes of reported ncRNAs are included. In addition to containing sequence data, NONCODE provides a user-friendly interface, a visualization platform and a convenient search option, allowing efficient recovery of sequences, regulatory elements in the flanking sequences, related publications and other information [13,14]. We pick up 15 ncRNA (BC200 RNA) and 20 snoRNA sequences from this database, which belong to specific ncRNAs and relate with Alzheimer disease. Ade- quately,we select miRNA of human, virus and sequences from miRNA database.All selected sequences can be directly downloaded from the webpage. 2.2. Method The Z curve is a unique three-dimensional space curve representation for a given DNA sequence in the sense that each can be uniquely reconstructed given the other. Consider a DNA sequence read from the 5' to the 3'-end with N bases. Inspect the sequence one base at a time, beginning from the first base. Let the number of the in- specting steps is denoted by n, i.e., n =1, 2... N. In the nth step, count the cumulative numbers of the bases A, C, G and T, occurring in the subsequence from the first to the nth base in the DNA sequence inspected. Denoting the cumulative occurring numbers of the bases A, C, G and T in the above subsequence by An, Cn, Gn and Tn, respectively. The Z curve is a three-dimensional space curve and composed of a series of nodes P0, P1, P2, . . . , PN , whose coordinates , and (n = 0, 1, 2, . . . , N, where N is the length of the DNA sequence being studied) are uniquely determined by the Z-transform of DNA sequence. n xn yn z )()( )()( )()( nnnnn nnnnn nnnnn CGTAz TGCAy TCGAx where, NnNNzyx nnn ,...,2,1,0],,[,, . The three components of the Z curve, i.e., , and , rep- resent three independent distributions that completely describe the DNA sequence being studied. Furthermore, the three independent components , and have a clear biological meaning, respectively [11]. n xn y n x n z n yn z It is noted that the Z curve defined above is generally not smooth at each node. Sometimes, a smooth proce- dure is needed. The B-spline functions are used to smooth the Z curve. For more detailed information about the Z curve defined, please refer to references [16,17,18]. In summary, the Z curve is the unique representation for a given DNA sequence in a three-dimensional space and each can be uniquely reconstructed from the other. It offers an intuitive and convenient approach to study DNA sequences geometrically. 3. RESULT AND DISCUSSION 3.1. Figures and Tables The accession numbers of selected Bc200 RNA sequences in NONCODE and NCBI database are as follows: 1. n289 (AC090426); 2. n637 (AF020057); 3. n751 (AF067778); 4. n752 (AF067779); 5. n753 (AF067780); 6. n754 (AF067781); 7. n755 (AF067782); 8.n756 (AF067783); 9.n757 (AF067784); 10. n758 (AF067785); 11. n759 (AF067786); 12. n760 (AF067787); 13. n761 (AF067788); 14. n4617 (M17307); 15. n4817 (U01305). Where, sequence 1, 14 and 15 belong to BC200 RNA and other sequences belong to BC200-alpha RNA. Their 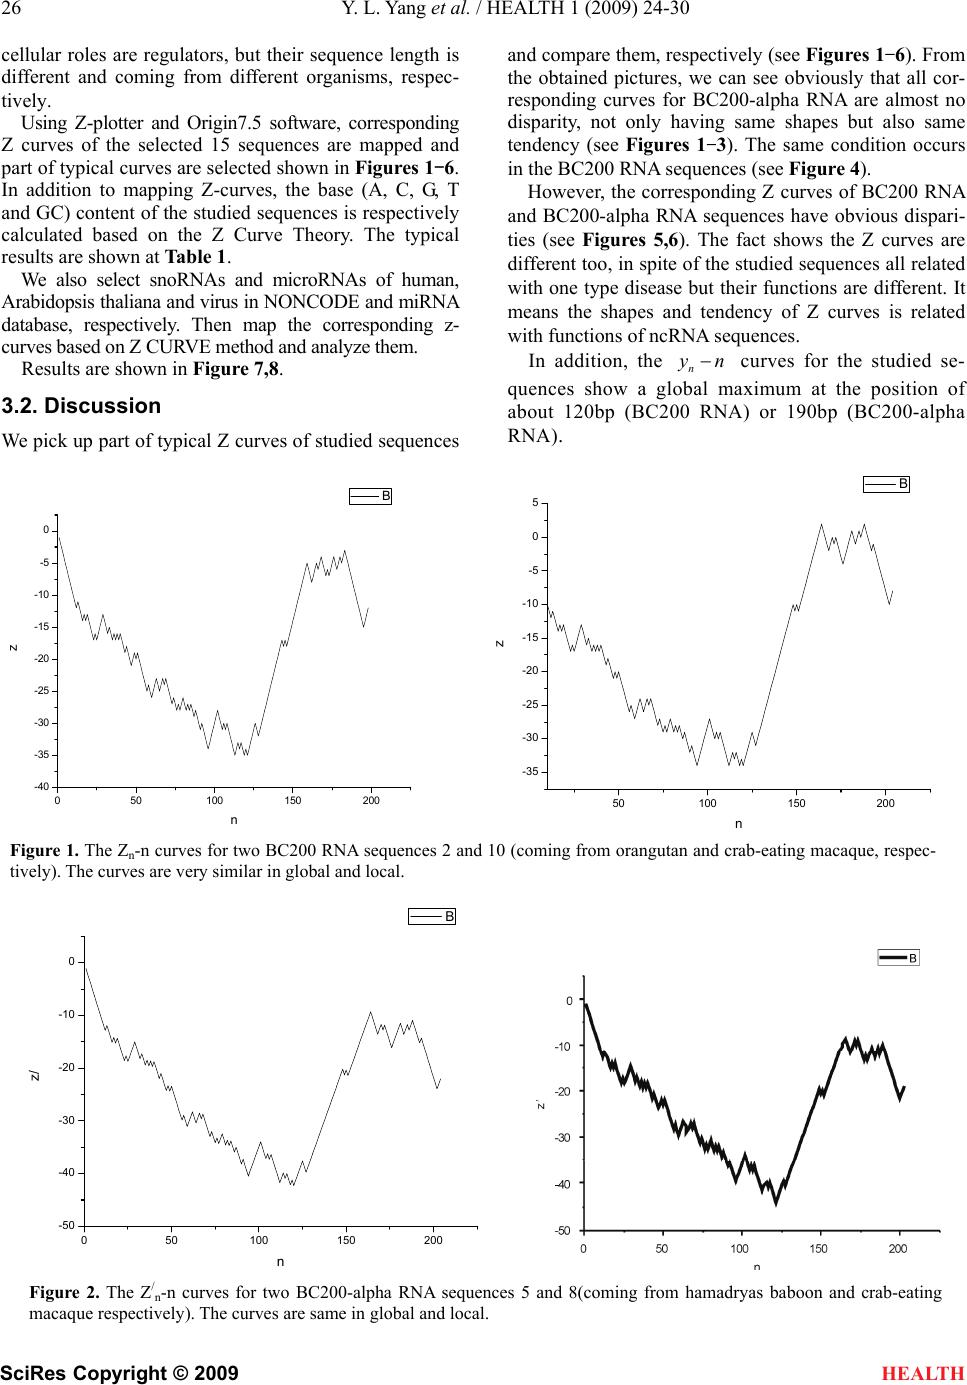 26 Y. L. Yang et al. / HEALTH 1 (2009) 24-30 SciRes Copyright © 2009 cellular roles are regulators, but their sequence length is different and coming from different organisms, respec- tively. and compare them, respectively (see Figures 1-6). From the obtained pictures, we can see obviously that all cor- responding curves for BC200-alpha RNA are almost no disparity, not only having same shapes but also same tendency (see Figures 1-3). The same condition occurs in the BC200 RNA sequences (see Figure 4). Using Z-plotter and Origin7.5 software, corresponding Z curves of the selected 15 sequences are mapped and part of typical curves are selected shown in Figures 1-6. In addition to mapping Z-curves, the base (A, C, G, T and GC) content of the studied sequences is respectively calculated based on the Z Curve Theory. The typical results are shown at Table 1. However, the corresponding Z curves of BC200 RNA and BC200-alpha RNA sequences have obvious dispari- ties (see Figures 5,6). The fact shows the Z curves are different too, in spite of the studied sequences all related with one type disease but their functions are different. It means the shapes and tendency of Z curves is related with functions of ncRNA sequences. We also select snoRNAs and microRNAs of human, Arabidopsis thaliana and virus in NONCODE and miRNA database, respectively. Then map the corresponding z- curves based on Z CURVE method and analyze them. In addition, the n yn curves for the studied se- quences show a global maximum at the position of about 120bp (BC200 RNA) or 190bp (BC200-alpha RNA). Results are shown in Figure 7,8. 3.2. Discussion We pick up part of typical Z curves of studied sequences 050100 150 200 -40 -35 -30 -25 -20 -15 -10 -5 0 z n B 50100 150 200 -35 -30 -25 -20 -15 -10 -5 0 5 z n B Figure 1. The Zn-n curves for two BC200 RNA sequences 2 and 10 (coming from orangutan and crab-eating macaque, respec- tively). The curves are very similar in global and local. 050100 150 200 -50 -40 -30 -20 -10 0 z/ n B Figure 2. The Z/ n-n curves for two BC200-alpha RNA sequences 5 and 8(coming from hamadryas baboon and crab-eating macaque respectively). The curves are same in global and local. HEALTH 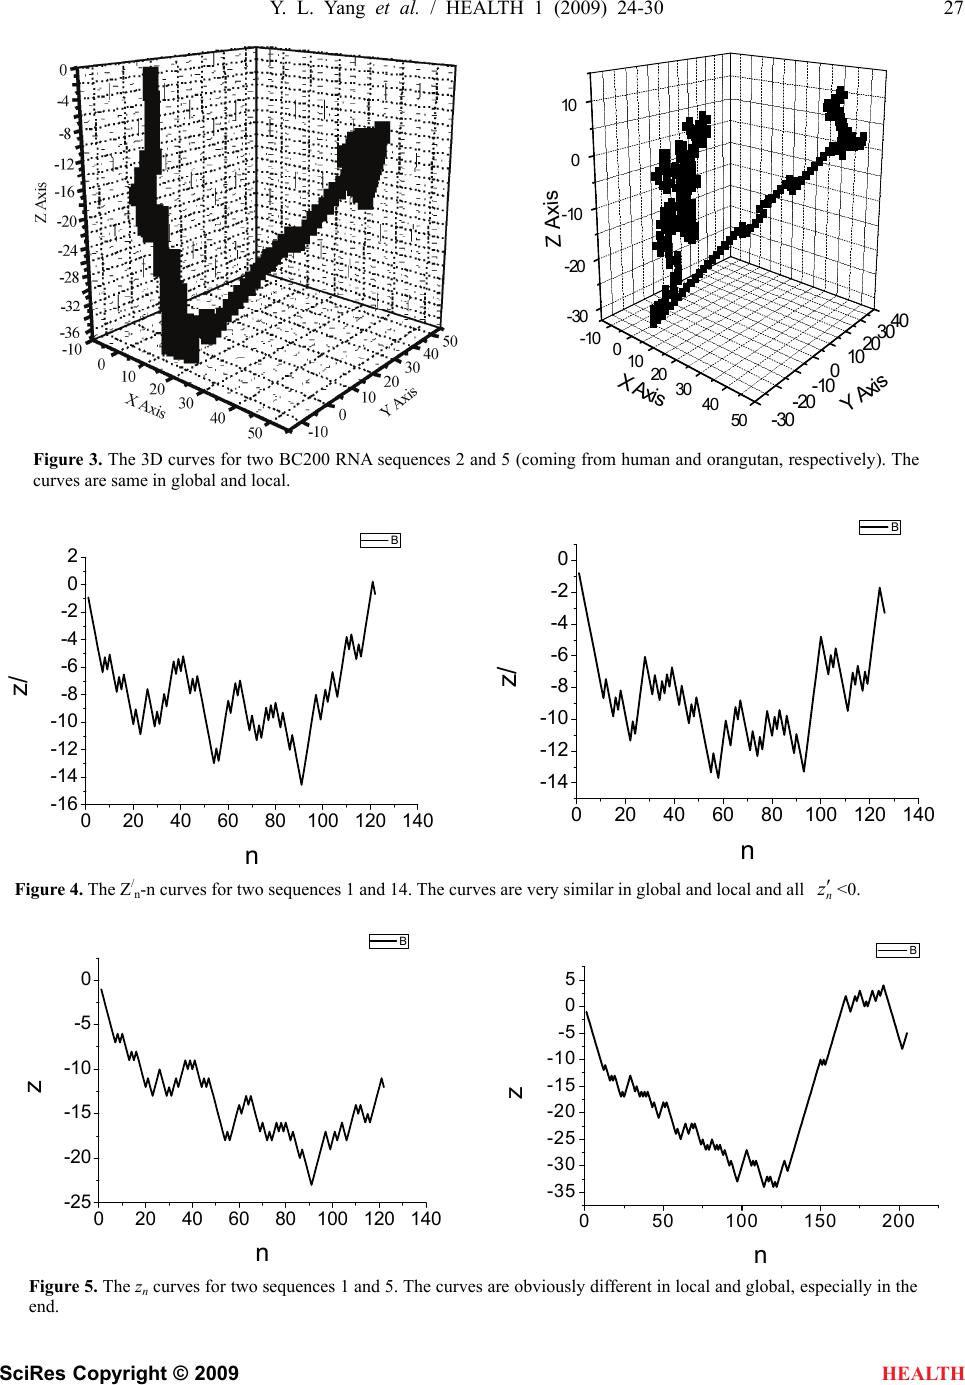 Y. L. Yang et al. / HEALTH 1 (2009) 24-30 27 SciRes Copyright © 2009 -10010 2030 40 50 -30 -20 -10 0 10 -30-20 -10 0102030 40 Z Axis Y Axis X A xis Figure 3. The 3D curves for two BC200 RNA sequences 2 and 5 (coming from human and orangutan, respectively). The curves are same in global and local. 020406080100 120140 -16 -14 -12 -10 -8 -6 -4 -2 0 2 z/ n B 020 40 60 80100120140 -14 -12 -10 -8 -6 -4 -2 0 z/ n B Figure 4. The Z/ n-n curves for two sequences 1 and 14. The curves are very similar in global and local and all <0. n z 020 40 60 80100120140 -25 -20 -15 -10 -5 0 z n B 050100 150 200 -35 -30 -25 -20 -15 -10 -5 0 5 z n B Figure 5. The zn curves for two sequences 1 and 5. The curves are obviously different in local and global, especially in the end. HEALTH 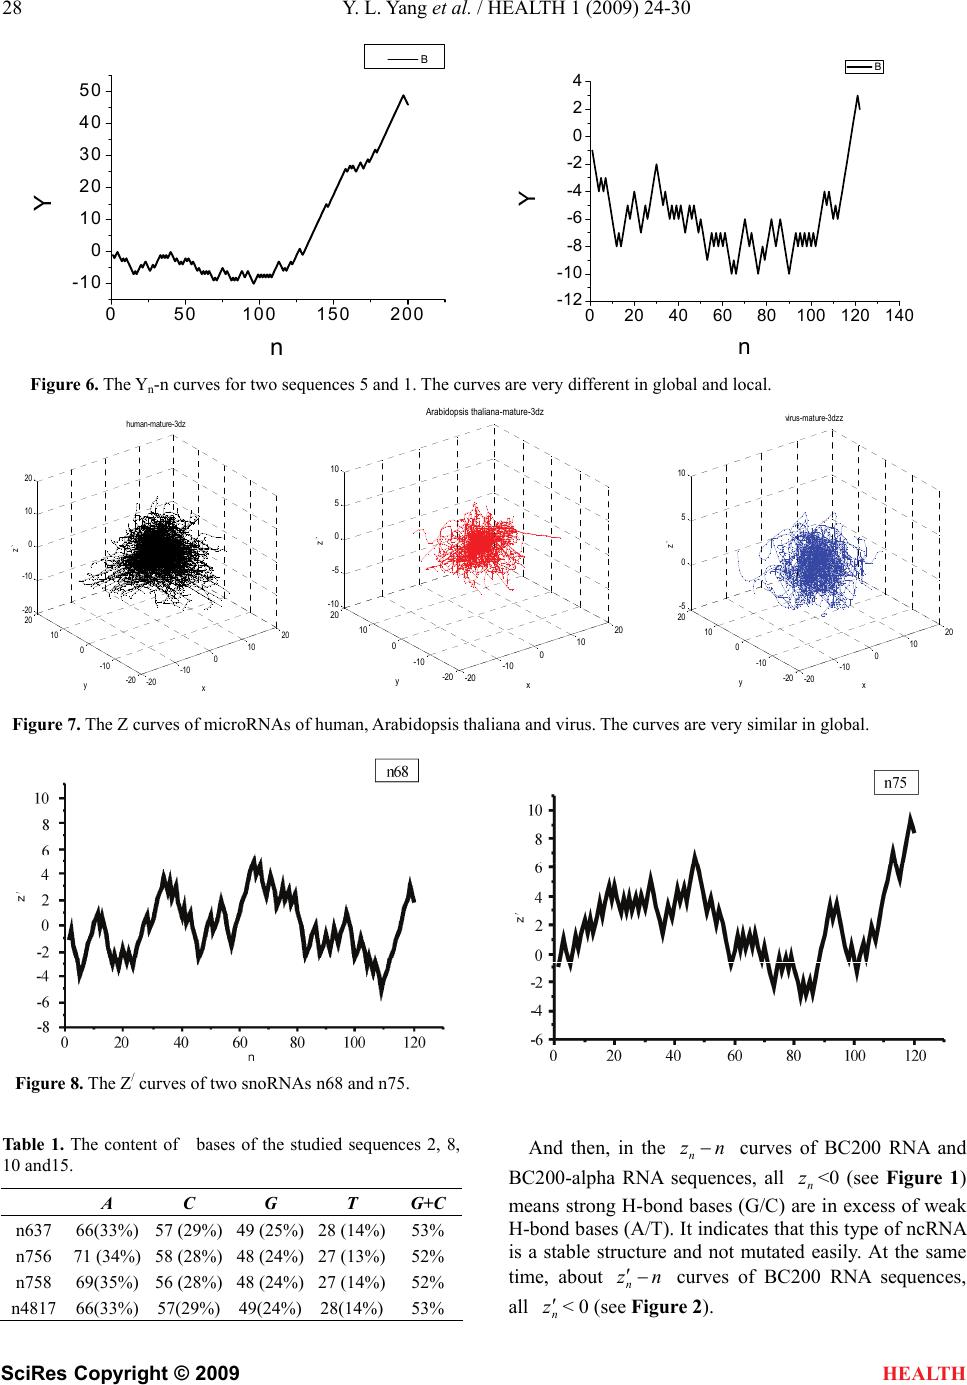 28 Y. L. Yang et al. / HEALTH 1 (2009) 24-30 SciRes Copyright © 2009 HEALTH 050100 150 200 -10 0 10 20 30 40 50 Y n B 020406080100 120 140 -12 -10 -8 -6 -4 -2 0 2 4 Y n B Figure 6. The Yn-n curves for two sequences 5 and 1. The curves are very different in global and local. -20 -10 0 10 20 -20 -10 0 10 20 -20 -10 0 10 20 x human-mature-3dz y z` -20 -10 0 10 20 -20 -10 0 10 20 -5 0 5 10 x virus-matur e-3dzz y z` Figure 7. The Z curves of microRNAs of human, Arabidopsis thaliana and virus. The curves are very similar in global. Figure 8. The Z/ curves of two snoRNAs n68 and n75. Table 1. The content of bases of the studied sequences 2, 8, 10 and15. A C G T G+C n637 66(33%) 57 (29%) 49 (25%) 28 (14%)53% n756 71 (34%) 58 (28%) 48 (24%) 27 (13%)52% n758 69(35%) 56 (28%) 48 (24%) 27 (14%)52% n4817 66(33%) 57(29%) 49(24%) 28(14%)53% And then, in the nz n curves of BC200 RNA and BC200-alpha RNA sequences, all <0 (see Figure 1) means strong H-bond bases (G/C) are in excess of weak H-bond bases (A/T). It indicates that this type of ncRNA is a stable structure and not mutated easily. At the same time, about n z nz n curves of BC200 RNA sequences, all n z < 0 (see Figure 2). -20 -10 0 10 20 -20 -10 0 10 20 -10 -5 0 5 10 x 拟南芥 -mature-3dz Arabidopsis thaliana-mature-3dz z` y 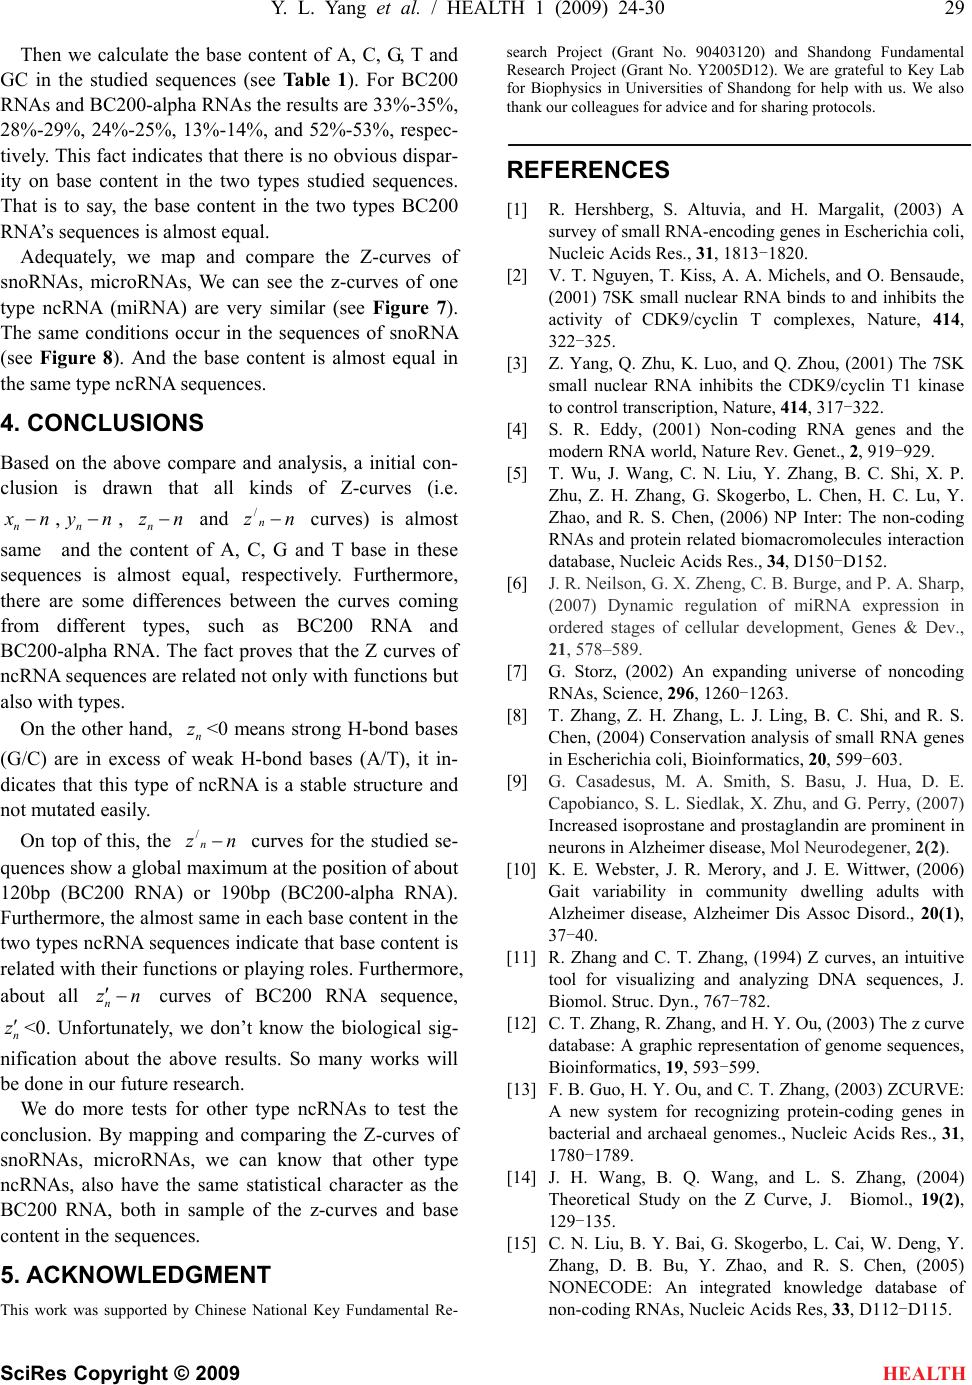 Y. L. Yang et al. / HEALTH 1 (2009) 24-30 29 SciRes Copyright © 2009 HEALTH Then we calculate the base content of A, C, G, T and GC in the studied sequences (see Table 1). For BC200 RNAs and BC200-alpha RNAs the results are 33%-35%, 28%-29%, 24%-25%, 13%-14%, and 52%-53%, respec- tively. This fact indicates that there is no obvious dispar- ity on base content in the two types studied sequences. That is to say, the base content in the two types BC200 RNA’s sequences is almost equal. Adequately, we map and compare the Z-curves of snoRNAs, microRNAs, We can see the z-curves of one type ncRNA (miRNA) are very similar (see Figure 7). The same conditions occur in the sequences of snoRNA (see Figure 8). And the base content is almost equal in the same type ncRNA sequences. 4. CONCLUSIONS Based on the above compare and analysis, a initial con- clusion is drawn that all kinds of Z-curves (i.e. ,, and curves) is almost same and the content of A, C, G and T base in these sequences is almost equal, respectively. Furthermore, there are some differences between the curves coming from different types, such as BC200 RNA and BC200-alpha RNA. The fact proves that the Z curves of ncRNA sequences are related not only with functions but also with types. nxnnynnz nnz n / On the other hand, <0 means strong H-bond bases (G/C) are in excess of weak H-bond bases (A/T), it in- dicates that this type of ncRNA is a stable structure and not mutated easily. n z On top of this, the curves for the studied se- quences show a global maximum at the position of about 120bp (BC200 RNA) or 190bp (BC200-alpha RNA). Furthermore, the almost same in each base content in the two types ncRNA sequences indicate that base content is related with their functions or playing roles. Furthermore, about all curves of BC200 RNA sequence, <0. Unfortunately, we don’t know the biological sig- nification about the above results. So many works will be done in our future research. nz n / nz n n z We do more tests for other type ncRNAs to test the conclusion. By mapping and comparing the Z-curves of snoRNAs, microRNAs, we can know that other type ncRNAs, also have the same statistical character as the BC200 RNA, both in sample of the z-curves and base content in the sequences. 5. ACKNOWLEDGMENT This work was supported by Chinese National Key Fundamental Re- search Project (Grant No. 90403120) and Shandong Fundamental Research Project (Grant No. Y2005D12). We are grateful to Key Lab for Biophysics in Universities of Shandong for help with us. We also thank our colleagues for advice and for sharing protocols. REFERENCES [1] R. Hershberg, S. Altuvia, and H. Margalit, (2003) A survey of small RNA-encoding genes in Escherichia coli, Nucleic Acids Res., 31, 1813-1820. [2] V. T. Nguyen, T. Kiss, A. A. Michels, and O. Bensaude, (2001) 7SK small nuclear RNA binds to and inhibits the activity of CDK9/cyclin T complexes, Nature, 414, 322-325. [3] Z. Yang, Q. Zhu, K. Luo, and Q. Zhou, (2001) The 7SK small nuclear RNA inhibits the CDK9/cyclin T1 kinase to control transcription, Nature, 414, 317-322. [4] S. R. Eddy, (2001) Non-coding RNA genes and the modern RNA world, Nature Rev. Genet., 2, 919-929. [5] T. Wu, J. Wang, C. N. Liu, Y. Zhang, B. C. Shi, X. P. Zhu, Z. H. Zhang, G. Skogerbo, L. Chen, H. C. Lu, Y. Zhao, and R. S. Chen, (2006) NP Inter: The non-coding RNAs and protein related biomacromolecules interaction database, Nucleic Acids Res., 34, D150-D152. [6] J. R. Neilson, G. X. Zheng, C. B. Burge, and P. A. Sharp, (2007) Dynamic regulation of miRNA expression in ordered stages of cellular development, Genes & Dev., 21, 578–589. [7] G. Storz, (2002) An expanding universe of noncoding RNAs, Science, 296, 1260-1263. [8] T. Zhang, Z. H. Zhang, L. J. Ling, B. C. Shi, and R. S. Chen, (2004) Conservation analysis of small RNA genes in Escherichia coli, Bioinformatics, 20, 599-603. [9] G. Casadesus, M. A. Smith, S. Basu, J. Hua, D. E. Capobianco, S. L. Siedlak, X. Zhu, and G. Perry, (2007) Increased isoprostane and prostaglandin are prominent in neurons in Alzheimer disease, Mol Neurodegener, 2(2). [10] K. E. Webster, J. R. Merory, and J. E. Wittwer, (2006) Gait variability in community dwelling adults with Alzheimer disease, Alzheimer Dis Assoc Disord., 20(1), 37-40. [11] R. Zhang and C. T. Zhang, (1994) Z curves, an intuitive tool for visualizing and analyzing DNA sequences, J. Biomol. Struc. Dyn., 767-782. [12] C. T. Zhang, R. Zhang, and H. Y. Ou, (2003) The z curve database: A graphic representation of genome sequences, Bioinformatics, 19, 593-599. [13] F. B. Guo, H. Y. Ou, and C. T. Zhang, (2003) ZCURVE: A new system for recognizing protein-coding genes in bacterial and archaeal genomes., Nucleic Acids Res., 31, 1780-1789. [14] J. H. Wang, B. Q. Wang, and L. S. Zhang, (2004) Theoretical Study on the Z Curve, J. Biomol., 19(2), 129-135. [15] C. N. Liu, B. Y. Bai, G. Skogerbo, L. Cai, W. Deng, Y. Zhang, D. B. Bu, Y. Zhao, and R. S. Chen, (2005) NONECODE: An integrated knowledge database of non-coding RNAs, Nucleic Acids Res, 33, D112-D115. 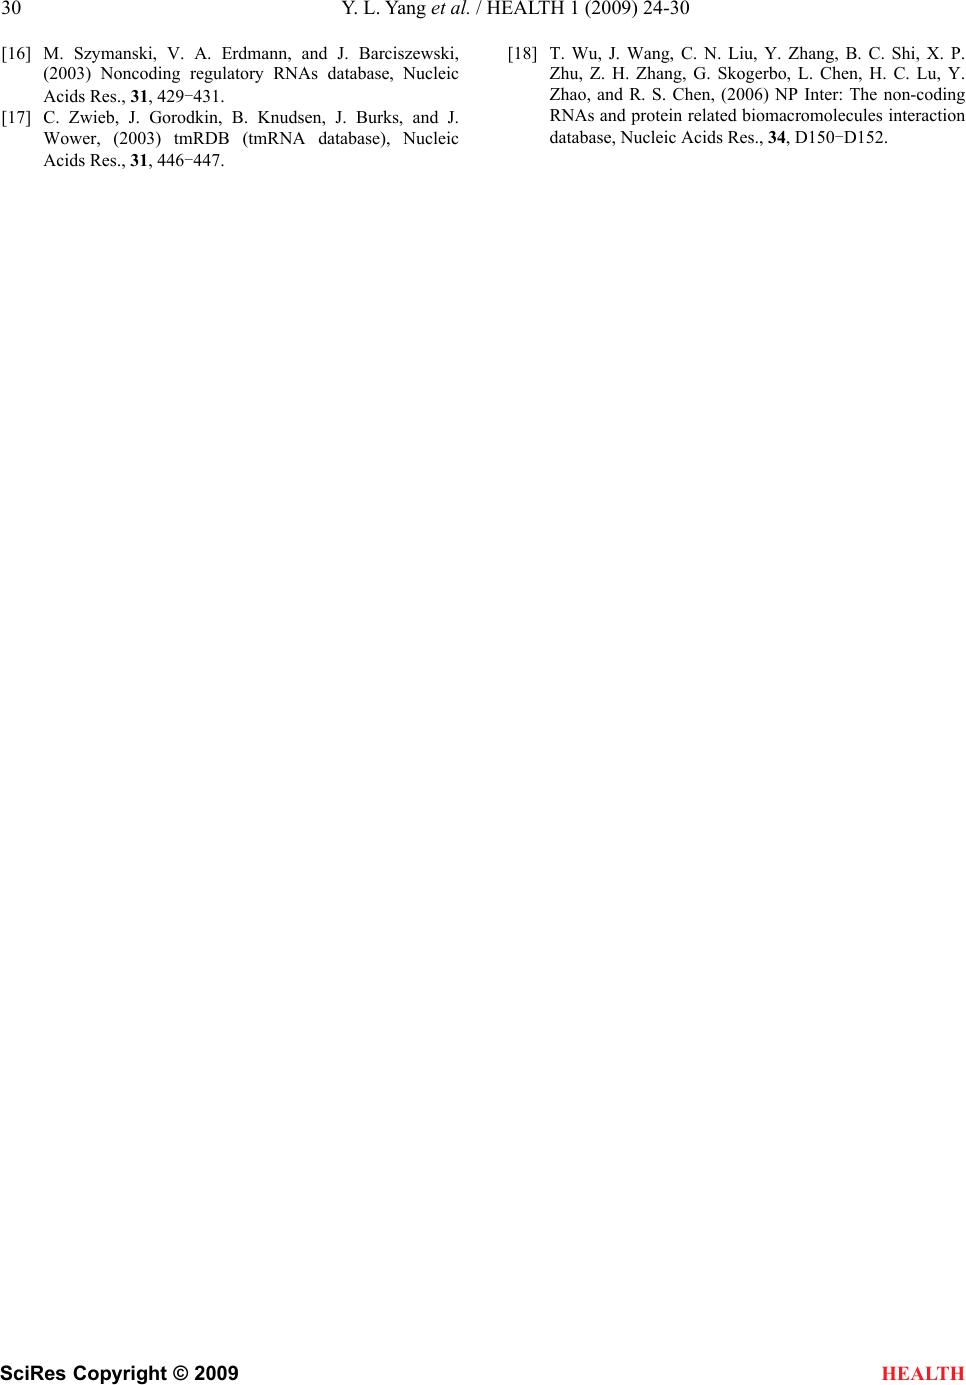 30 Y. L. Yang et al. / HEALTH 1 (2009) 24-30 SciRes Copyright © 2009 HEALTH [16] M. Szymanski, V. A. Erdmann, and J. Barciszewski, (2003) Noncoding regulatory RNAs database, Nucleic Acids Res., 31, 429-431. [17] C. Zwieb, J. Gorodkin, B. Knudsen, J. Burks, and J. Wower, (2003) tmRDB (tmRNA database), Nucleic Acids Res., 31, 446-447. [18] T. Wu, J. Wang, C. N. Liu, Y. Zhang, B. C. Shi, X. P. Zhu, Z. H. Zhang, G. Skogerbo, L. Chen, H. C. Lu, Y. Zhao, and R. S. Chen, (2006) NP Inter: The non-coding RNAs and protein related biomacromolecules interaction database, Nucleic Acids Res., 34, D150-D152. |