

Paper Menu >>
Journal Menu >>
 Creat ive Educati on 2011. Vol. 2, No. 1, 18 -21 Copyright © 2011 SciRes. DOI:10.4236/c e.2011.21003 Large Scale Simulation for Education in Forensic DNA Science Jason M . Ki n ser Department of Bioinformatics and Computational Biology, George Mas on U niversi ty, Fairfax, USA Email: [email protected] Received January 12th, 2011; revised February 24th, 2011; accept ed February 28th, 2011. Forensi c scienc e education is a ra pidly expandi ng field with se veral univers ities a dding degrees i n many forens ic scienc e discipl ines. Concurrently, with this expansion is a new push for forensic science educa- tion i n the secondar y schools. This genera tion of st udents is al so very a dept at comp uter genera ted envi- ronments. The logical progression is therefore to provide students and instructors with a simulated envi- ronment t o i mmerse st udent s int o forens ic s cienc e invest igat ions. The Island of Ti r Eb ensëa is a de velop- ing system that generates a large scale population and forensic scenarios and places the students as the investigators. Students are provided with a scenario and then generate queries to gain information about the people involved in the case. They can then draw conclusions about the scenario and compare these conclusions to the know n answer. The simulat ion is availab le to educat ional ins titutions. Keywords: Web-Based Education, Forensic Science, DNA Introduction Forensic science has become a very popular field in educa- tion within the last few years. One popular explanation is the advent of television shows such as CSI. Another contributing factor though is the recent development in the science itself. Modern forensic science technology has evolved rapidly in the past decade. Furthermore, the employment future in the field is bright with a predicted increase of 20% in jobs before 2018 (Bureau of Labor Statistics, 2011; ForensicScience.net, 2011; Jaroch; 2011). Colleges and universities have responded to this need as noted by a recent survey which indicates that the US now has over 70 degree programs in this field (Tebbett, Wielbo, & Khey, 2007). Likewise, opportunities for secondary school stud ent s are in creasi ng i n t he t erms of summer ca mps, s peci alt y programs and school clubs. This new generation of students is also very adept in using computerized social environments with the onset of social net- works and simulation games. Many studies have indicated that learning experience for secondary school students is enhanced through the use of virtual environments and simulations (Akpan & Andre, 2000; Choi & Gennaro, 1987; Geban, Askar & Ozkan, 1992; Lewis, Stern & Linn) with some studies measuring im- proved performances (Huppert, Lomask & Lazarowitz, 2002; Mintz 1993; Willing 1988). In the study of forensic DNA science it is necessary for stu- dents to understand the statistics of large populations as well as the inheritance properties of DNA profiles. This type of analy- sis is well suited for a large scale simulation which is the foun- dation of a project named Tir Ebensëa. The simulation provides students with forensic scenarios and several portals through which their inquiries can reveal more information about the case. Students then use spreadsheets to reach conclusions of the scenarios which can be compared to the known answers. The simulation is available to educational institutions by request to the au thor. Simulation Requirements The study of human identification through DNA profiles re- quires several components. The two major components are the statistical analysis of large populations and the understanding of the DNA profiles including their inheritance properties. Fu r- thermore, realism in an investigation must includ e several ot her complicated facto rs. The simulation incorporates many of these properties to provide realistic scenarios for the students. DNA Profiles Currently, a human DNA profile used in court cases may consist of three components. The first is STR (short tandem repeats). In the nuclear DNA there are many loci in which a small DNA pattern repeats multiple times. A forensic profile identifies alleles by the number of repeats. The nuclear profile includes contributions from both biological parents and thus for each locus there are two values. As an example, a person’s profile for a single locus could be the allele pair [9,11] which ind icates along on e strand of th e DNA helix th ere are 9 repeats and along the other is 11 repeats. However, it is not known which parent donated which value. There is no worldwide standard yet on the set of loci used. The FBI database, named CODIS, uses 13 loci. European countries with their smaller populations often use a fewer number of loci of which some differ from the US set. Consider a case of a single locus. The parents are [7,9] and [9,10]. A child produced from these two parents will receive one value from each. Therefore a child could be: [7,9], [7,10], [9,9] or [9,10] with equal probabilities. It is quite possible to reconstruct (at least partially) a person’s STR profile from the profiles of their immediate relatives. Given a case where the mother is [7,8] and two children are [7,10] and [8,11], it is possible (excluding mutations) to reconstruct the father’s pro- file to be [10,11]. Even though the father’s DNA may not be available it is possible to reconstruct (at least in part) the fa-  J. M. KINSER 19 ther’s profile. The second type of DNA profile use is mitochondrial DNA which is a single stranded DNA loop that exists in multiple copies in the cytoplasm of a cell. The mitochondrial DNA is inherited en masse from the mother. Statistically, it is treated as a single entity rather than a set of values such as in the STR case. The third type of DNA profile is YSTR which is a set of repeats b ased on th e Y-chromosome. The Y chromosome exists only in males and is inherited en masse from the father to the sons. Statistically, it is treated in a manner similar to the mito- chondrial DNA. One of the requirements of the simulation is that each person has a DNA profile with STR, YSTR (males), and mitochondrial DNA. Furthermore, it necessary that people inherit their pro- files from their biological parents. There is also a small possi- bility of some mutations that must be included. Ethnicity In real life the distribution of allele sizes (Butler 2005; Mar- janovic et al., 2005; Dutta et al., 2002; Nei 1973) varies for each ethnic group. It is possible to provide a probability of a person’s ethnicity based upon their DNA profile. Therefore, th e simulation must have a variety of ethnic groups each with their own distributions. Scale Matching DNA profiles does not prove that a DNA sample comes from a specific person. There are two conclusions that can be drawn from an analysis. The first is an exclusion where it is possible to state that a DNA sample does not come from a specific person. The second is a probability in which the re- searcher provides a probability of a random person having a particular profile. In some cases, this value can be so ridicu- lously low that it would take several times the Earth’s popula- tion before there is a significant chance of a second person having the same profile. While it is not possible to conclude that a DNA sample comes from a specific person it is possible to compute that the probability of two people having the same profile is astronomical. Before a student can make a statistical calculation from a sample population it is necessary to gather a subsample popula- tion. Even though the US population is over 300,000,000 people studies indicate that less than two hundred people are need to provide a statistically relevant sampling of the popula- tion (Chakraborty, 1992). In order to replicate this, the si mula- tion is required to have a large population but not nearly on the same scale as t he US pop ulation. In order to replicate this type of analysis it is necessary for the simulation to have a population base with different ethnic groups with signature distributions. Furthermore, it is necessary that t he size of the population be large. Bi ological versus Le gal Parentage The DNA profiles are inherited from biological parents. However, many children live with adults that are legally their parents but not biologically their parents. This occurs through re-marriages, adoptions, or infidelities. In some cases, the in- vestigator may know that the parents are not biologically re- lated and in other cases this information is not volunteered by the family members. Therefore, the simulation must include mechanisms by which families may be created through means other than biological evolution. It must include marriages, divorces, re-marriages, adoptions, and the occasional tryst. Scenarios Another major component of a simulation is the creation of scenarios that are to be solved. In this manner, the students act as the in vestigators. Scen arios solved by DNA anal ysis inclu de missing persons, assaults, thefts, scams, law suits, and mass disaster s. Each scenario presents stu dents with a s mall descrip- tion and then they interact with the simulation to retrieve other information that is necessary. A sample case is presented in a subsequent section. Require me nts A simulation of forensic DNA cases must include a large population with ethnic variations. This population must have biological relationships in order to replicate inheritance, but it also must h ave mechanis ms by which these biological rel ation- ships are disconnected. The simulation must also create scena- rios suitable for students educational and maturit y levels. The Tir Ebensëa Simulation With the requirements in hand the simulation named The Island of Tir Ebensëa has been created and is available to edu- cational institutions. The simulation provides a large scale pop- ulation, portals for inquiry, and forensic scenarios with solu- tions. The Island of Ti r Eben sëa The simulation is based upon a theoretical island inhabited by four ethnic groups. The population occupies five cities as well as the coun try-side. Since DNA profile statistics are shown to be sensitive to regions and ethnic groups, four of the five cities contain a majority of one of the ethnic groups. This al- lows students to study profile distributions for global, local, ethnic and/or chronological populations. The population is evolving at a rate of 10 years per school semester. Simulants (people in the simulation) age, die, marry, give birth , etc. du rin g th e cour se of a semester. A recen t sa mple from the i sland from year 16 27 indicates t hat there have been a total of 118,000 people of which 24,122 are currently living. There are four ethnic groups which do marry across racial boun daries at small rates and there are curr ently 1759 d ifferent surnames. Figu re 1 shows the distribution of ages of the current living population. There are two spikes for the younger ages due to two recent immigration influxes. The Si mulant s Each simulant in the population contains a personality which includes the propensity to commit speci fic criminal act s. Figure 2 displays the distribution of one of the personality factors which controls the willingness of an individual to cooperate with the police. Two spikes at the end of the distribution indi- cate that there are several p eople that will always or never co o- perate. There is a nontrivial portion of the population that may cooperate. Students requesting a DNA sample from an individ- 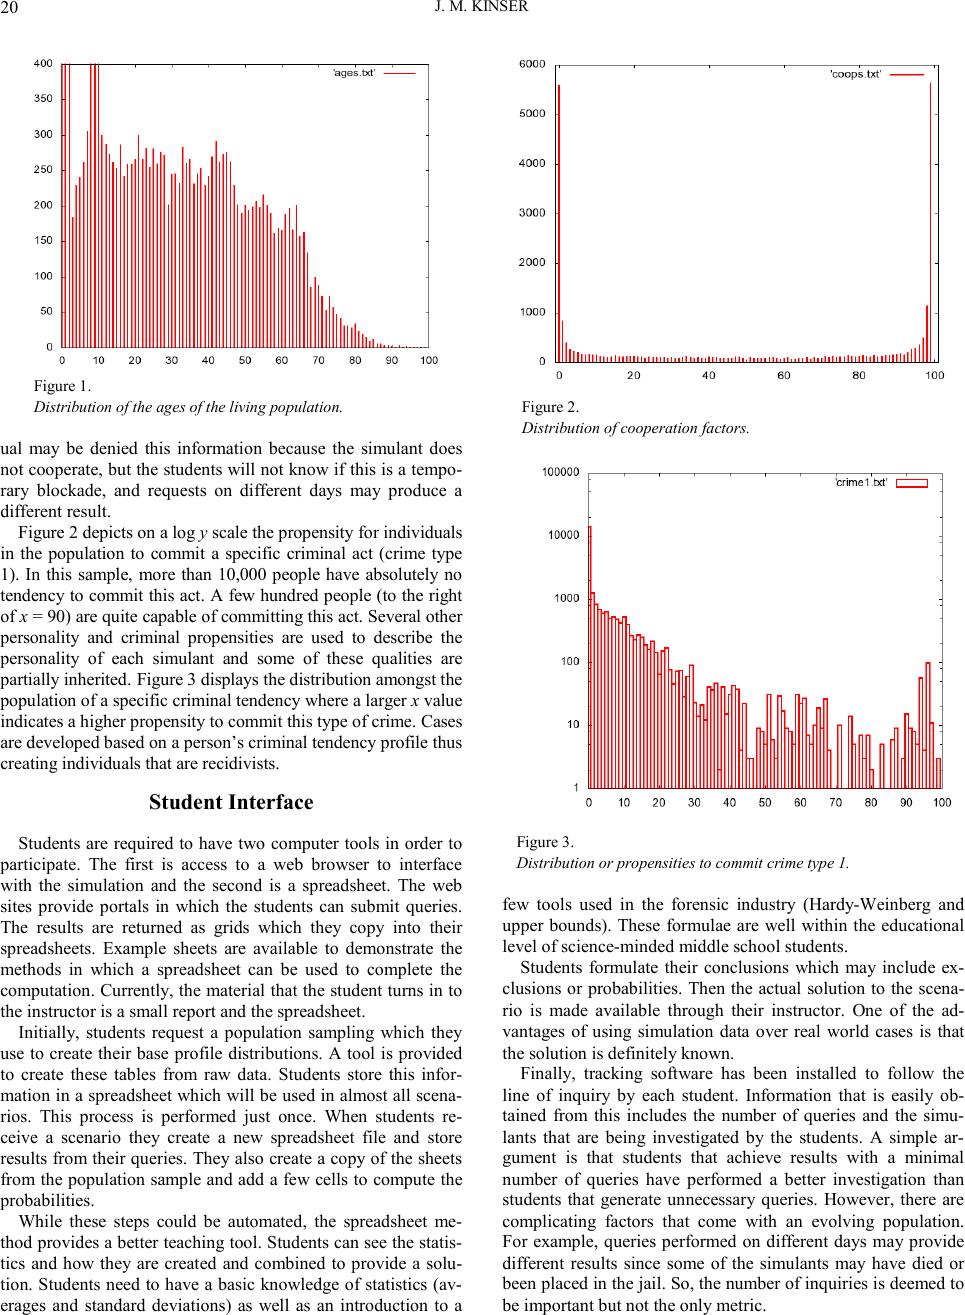 J. M. KINSER 20 Figure 1. Dist r ibution of th e ages of the living population. ual may be denied this information because the simulant does not cooperate, but the students will not know if this is a tempo- rary blockade, and requests on different days may produce a different result. Figur e 2 depicts on a log y scale the propensity for individuals in the population to commit a specific criminal act (crime type 1). In this sample, more than 10,000 people have absolutely no tendency to commit this act. A few hundred people (to the right of x = 90) are quite capable of committing this act. Several other personality and criminal propensities are used to describe the personality of each simulant and some of these qualities are partially inh erited. Fi gure 3 display s the distribution amongst the pop u l at i on of a sp e ci fic cri mi n a l te nden cy wher e a la r ger x value indicates a higher pr o pensi ty to commit this type of cr ime. Cases are developed bas ed on a person’s criminal tendency profile thus creating individuals that are recidivists. Student Interface Students are required to have two computer tools in order to participate. The first is access to a web browser to interface with the simulation and the second is a spreadsheet. The web sites provide portals in which the students can submit queries. The results are returned as grids which they copy into their spreadsheets. Example sheets are available to demonstrate the methods in which a spreadsheet can be used to complete the computation. Currently, the material that the student turns in to the instructor is a small report and the spreadsheet. Initially, students request a population sampling which they use to create their base profile distributions. A tool is provided to create these tables from raw data. Students store this infor- mation in a spread sheet which wil l be used in almost all scena- rios. This process is performed just once. When students re- ceive a scenario they create a new spreadsheet file and store results from their queries. They also create a copy of th e sheets from the population sample and add a few cells to compute the probabilities. While these steps could be automated, the spreadsheet me- thod provides a better teaching too l. Stu dents can s ee the stat is- tics and how they are created and combined to provide a solu- tion. S tudents need to have a basic knowledge o f statistics ( av- erages and standard deviations) as well as an introduction to a Figure 2. Distribution of cooperation factors. Figure 3. Distri butio n or propensi ties to comm it crim e ty pe 1. few tools used in the forensic industry (Hardy-Weinberg and upper bounds). These formulae are well within the educational level of scien ce-minded middle school students. Students formulate their conclusions which may include ex- clusions or probabilities. Then the actual solution to the scena- rio is made available through their instructor. One of the ad- vantages of using simulation data over real world cases is that the solution is definitely known. Finally, tracking software has been installed to follow the line of inquiry by each student. Information that is easily ob- tained from this includes the number of queries and the simu- lants that are being investigated by the students. A simple ar- gument is that students that achieve results with a minimal number of queries have performed a better investigation than students that generate unnecessary queries. However, there are complicating factors that come with an evolving population. For example, queries performed on different days may provide different results since some of the simulants may have died or been p laced in the j ail. So, the number of inquiries is deemed to be important but not the only metric.  J. M. KINSER 21 Sample Case This section presents a case recently used that indicates the type of logic that students will need in order to solve a scenario . In this case, the victim was a discovered body in the forest. Evidence provided to the students was that the victim was an adult male, the ethnic group was identified, and the DNA pro- file of the victim was identified. The following steps were the ones necessary for the proper solution. 1) Request a list of missing persons from the Missing Per- sons Bureau. Exclude from consideration all those that were not adul t males. 2) Prioritize the remaining persons according to location and ethnicity. 3) For each person on the list, contact their immediate fami- lies and request DNA samples. 4) Exclude from the candidate list those whose DNA profiles had several mismatches with the victim. In th is case, only one male (Stanton Updegraff) survived the previous pruning steps. The following steps were used to con- firm the identity of the victim. 5) Determine that there were inconsistencies with the DNA of the wife (Kesha) and three children. From this analysis the students conclude that Kesha is not the biological mother of the children. 6) Through queries to other agencies students gather birth records and marriage records. From this they learn that Stanton was previously married to Serena and that the birth of the three children was during this first marriage. 7) Use Seren a and the thr ee children to reconstru ct Stanton’s DNA profile. In the initial analysis there are some inconsisten- cies in the reconstruction and the reconstructed profile does not match the victim. The early conclusion is that the victim is not Stanton. However,… 8) Th e inconsistenci es trigger students to realize that one (or more) of the children has a different biological father. Using Y-chromosome information students conclude that the two sons have the sa me bio logical father and that th e Y data matches the victim. Therefore, they consider a reconstruction without the daughter. 9) The new reconstruction shows no mismatches between Stanton and the victim. 10) Students then use statistical tools to compute the proba- bility that a random person could have Stanton’s reconstructed profile. This leads them to conclude that there is an extremely high probability that the victim is Stanton. This is the correct answer. This case requires the students to use several tools. Students will need to be able to reconstruct DNA profiles from relatives, use Hardy-Weinberg statistics to compute probabilities, and most importantly to understand the evidence. Twice in this case students would have to understand that the evidence indicates that oth er peop le are invo lved in the case ( first wi fe and ano th er male partner). These latter two conclusions are not derived from computer tools but solely from the student’s ability to understand the evidence before t hem. Final Comments The current version of the simulation is Tir3 with two new versions in the pipeline that will add other types of forensic evidence (other than DNA) and new environments. Instructors may access the simulation through a request through to the author. Access is currently controlled but not highly restrictive. Instructors wishing to participate in this project should contact the author. Sample cases of the simulation are found on the accompanying web site: http://binf.gmu.edu/kinser/fdna09/ tirsimulation/. References Akpan, J. P., & Andre, T. (2000). Using a computer simulation before dissection to help students learn anatomy. Journal of Computers in Mathe matics and Science Teaching, 19, 297-313. Bureau of Labor Statistics, (2010). Occupational outlook ha ndbook, (11th ed.). ( acce s se d J a n. 1 1, 201 1) http://www.bls. gov/oco/ocos 115. htm. Butler, J. M. (2005). Forensic DNA typing: Biology, technology, and gene tics of ST R markers (2nd ed.). London: Academic Press. Chakraborty, R. (1992). Sample size requirements for addressing the popula tion geneti c issues of forens ic Use of DNA typing. Human Bi- ology, 6, 141-159. Choi, B., & Gennaro, E. (1987). The effectiveness of using computer simulated experiments on junior high students’ understanding of the volume displacement concept. Journal of Research in Science Teaching, 24, 539-552. doi:10.1002/tea.3660240604 Duda, R., Reddy, B. M., Chattopadhyay, P., Hasyap, V. K. , & Sun, G. , Deka, R. (20 02). Patt erns of genetic diversity at the nine forensically approved STR loci in the Indian populati ons . Human Biology, 74, 34-39. ForensicScience.net (accessed Jan. 11, 2011). http://www. forensicscience.net/crime-scene-examiners. Geban, O., Askar, P., & Ozkan, I. (1992). Effects of computer simula- tions and problem-solving approaches on high school students. Journal of Educational Research, 86, 5-10. Huppert, J., Lomask, S. M., & Lazarowitz, R. (2002). Computer simu- lati ons in the hi gh sch ool: St uden t s’ cognit i ve stages, sc i ence process skills and academic achievement in microbiology. International Journal of Scie nce Ed ucat io n, 24, 803-821. doi:10.1080/00220671.199 2.9941821 doi:10.1080/09500690110049150 Jaroch , L., Forensic Science Careers (accessed Ja n .11, 2011). http://www.all-about-forensic-science.com/forensic-science-careers.h tml. Lewis, E. L., Stern, J. L., & Linn, M. C. (1993). The effect of computer simulations on introductory thermodynamics understanding. Educa- tional Technology, 33, 445 -458. Marjanovic, D., L. Kapur, N. Pojskic, & R. Hadziselimovic, (2005). DNA diversity in the studies of genetic distance among isolated pop- ulations in Bosnia. Huma n E vol ut ion, 20 , 157-166. doi:10.1007/BF02438733 Mint z, R. (1993 ). Computerized simulation s as an i nquiry tool. School Science and Mathematics, 93, 76-80. doi:10.1111/j.1949-8594.1993.tb12 198.x Nei, M. (1973). Analysis of gene diversity in subdivided populations, Proceedings of the National Academy of Sciences USA, 70, Part I, 3321-3323. doi:1 0.1073/pna s .70.12.3321 Tebbett, I. R., Wielbo, D. & Khey, D. (2007, summer). The forensic examiner. Willing, K. R. (1988). Computer simulations: Activating content read- ing. Journal of Reading, 31, 400-409. |