

Paper Menu >>
Journal Menu >>
 Engineering, 2013, 5, 575-578 http://dx.doi.org/10.4236/eng.2013.510B118 Published Online October 2013 (http://www.scirp.org/journal/eng) New Approach for Limited-Angle Problems in Electron Microscope Based on Compressed Sensing Marc Vila Oliva, Hamed Hamid Muhammed* Royal Institute of Technology KTH, School of Technology and Health STH Alfred Nobels, Huddinge, Sweden Email: mmvo@kth. se, *ha [email protected] Received 2013 ABSTRACT New advances within the recently rediscovered field of Compressed Sensing (CS) have opened for a great variety of new possibilities in the field of image reconstruction and more specifically in medical image reconstruction. In this work, a new approach using a CS-based algorithm is proposed and used in order to solve limited-angle problems (LAPs), lik e the ones that typically occur in computed tomography or electron microscope. This approach is based on a variant of the Robbins-Monro stochastic approximation procedure, developed by Egaziarian, using regularization by a spatially adaptive filter. This proposal consists on filling the gaps of missing or unobserved data with random noise and enabling a spatially adaptiv e denoising filter to regularize the data and reveal the underlying topology. This method was tested on different 3D transmission electron microscope datasets that presented different missing data artifacts (e.g, wedge or c one shape). The test results show a great potential for solving LAPs using the proposed technique. Keywords: Co mpresse d Sensing; I mage Rec onstructi o n; Adapti ve Filters; Limited Angle Problem; TEM 1. Introduction A common problem in Transmission Electron Micro- scope (TEM) is the li mited-angle view, where large gaps of missing data are present in the acquired volume. An LAP occurs when having missing or corrupted data from a certain angle, which makes the acquisition unreliable and therefore you cannot trust the results. This group of LAPs is due to various technical and fu ndamental limita- tions on the minimum and maximum attainable tilt an- gles of the instrumentation that are used to acquire the data . Theref ore, th e data i s confined to a limited-angular - range acquisition which prevents its appropriate visuali- zation and rendering. The goal of our work is to estimate the missing or cor- rupted data from TEM datasets by applying a new strat- egy instead of the classically used techniques, such as POCS (Projection Onto Convex Sets), [1-3], which is widely used d ue to its easy imple mentation but offers poor results, or the more sophisticated ones like PICCS (Prior Image Constrained Compressed Sensing) or TV (Total Variation) [4], which are more complicated solutions. In this paper, we study a new variant of the already mentioned method of Egiazarian, [5]. We present and explain how the technique has been adapted and applied, and present the obtained results and a brief discussion along with the conclusions extracted from the results. 2. Method In [6-8], it is shown that under CS assumptions, stable reconstruction of partly unknown data is possible and that in some cases the reconstruction can be exact. These techniques typically rely on convex optimization with a penalty expressed by the l0 or l1 norm, which is exploited to enable the assumed sparsity [9]. Therefore, it results in parametric modelling of the solution and in problems that are commonly solved by mathematical algorithms. In [5], it is proposed to replace the tradition al parametric model- ling used in CS by a non-parametric one. This non-para- metric modelling is imple mented by the u se of a spatially adaptive filter. The regularization imposed by the l0 or l1 norm is essentially only a tool to design some non-linear filtering. This implicit regularization is replaced by ex- plicit filtering, exploiting a spatially adaptive filter, which is sensitive to the features and details of the image. If this filter is properly designed, there is a chance to achieve better results than those obtained by the common method based on formulation of imaging. In imaging, the regula- rization with global sparsity penalties (e.g, lp norms in some domain) often results in an inefficient filtering. It is known that a higher quality result can be achieved when the regularization criteria are local and adaptive. The applied method to reconstruct the “dead zones” (e.g. with corrupted or missing data) is carried out by a recursive algorith m based on s patially ad aptive deno ising * Corresponding author. Copyright © 2013 SciRes. ENG 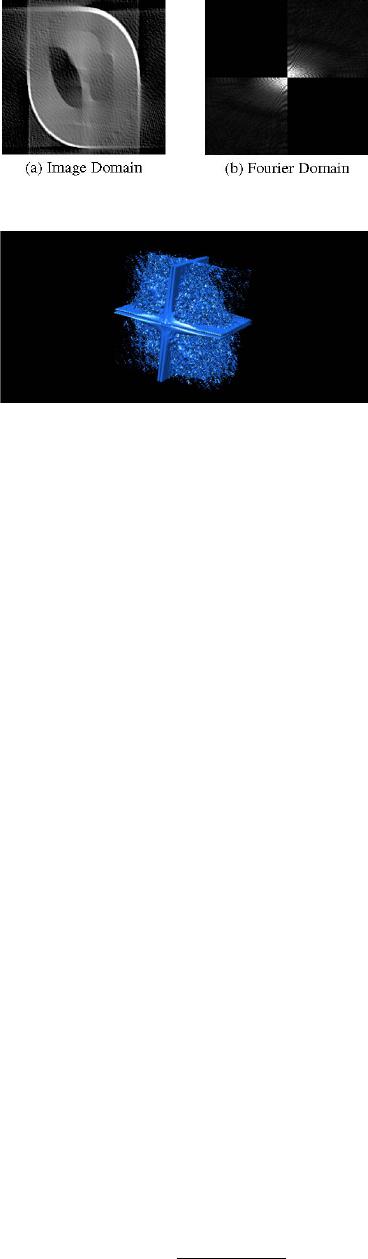 M. V. OLIVA, H. H. MUHAMMED 576 filtering [5]. Each iteration consists of providing data to a block-matching and a spatially adaptive 3D filtering al- gorithm, called BM3D, by the injection of random noise in the unobserved portion of the data in frequency do- main. To carry out block-matching and block-filtering, the filter implemented in [10] was used with some modi- fications such as the removal of the Wiener filter in order to speed up the algorithm and using Haar wavelet for the third-dimension transform. In addition, some parameters of the block hard-thresholding (HT) were optimized to speed up the computations, such as N1 = 4, N2 = 12, Ns = 31 and tau_match = 1800. This peculiar fi lter works in the image domain. It attenuates the noise and reveals new details and features of the corrupted image at each itera- tion. The process ends when a specific number of itera- tions are performed. The algorithm is ruled by the following recursive sys- tem: ( ) ( )( )( ) ( ) () () () () ( ) 0 2 11 222 2 1 112 ˆ0, 0 ˆ ˆ ˆˆ1* ˆ1 *,1 kk k kk yk yyy yS yyS k η −− − − = = ==−ϒ− −⋅ ϒΦϒ++ −⋅≥ (1) where: Φ ≡ filtering block 2 ˆ y ≡ estimation of unknown da ta in Fourier doma i n y1 ≡ know n da t a in F o urier domain γ ≡ speed step of the algorithm (1 − S) ≡ mask to select the region of the unknown da- ta ϒ ≡ Fast Four ier Tran sfor m 1− ϒ ≡ Inverse Fast Fourier Transform k η ≡ Gaussi an noise Image data (denoted as y) is divided into a known por- tion (denoted as y1) and an unknown portion (denoted as y2) as follows: ( ) 12 .? ySyS y yy =∗+ −∗ = + (2) The procedure of [5] was applied to reconstruct 2D images (e.g. the data in Figure 1(b)) and achieve a per- fect reconstruction, while we apply the method to 3D TEM volume images (e.g. the data in Figure 2) by split- ting the 3D problem into a number of different 2D prob- lems and solve them separately using a different con- figuration for each case due to the variability of the dead zone from slice to slice. For example, for the case pre- sented in Figure 2, when taking horisontal slices in the xy-plane in Fourier domain. 3. Datasets Three different datasets were used in this work. Figure 1. 2D limited-angle example. Figure 2. 3D limited-angle example in the image domain. 3.1. Hansandrey Cryst allography Dataset It consists of a 3D artificial crystallography of size 100 × 100 × 100 voxels in.mrc format, [11]. It was created by a simulator-software to evaluate the performance of TEM reconstruction algor ithms [12]. In this ca se, we simulated a missing wedge and a missing cone in Fourier domain (as shown Figure 3) to apply the reconstruction proce- dure and evaluate th e qu a lity o f th e result. 3.2. Viral DNA Gatekeeper Dataset It consists of a 3D model of a viral DNA gatekeeper, of size 100 × 100 × 100 voxels in.mrc format, obtained by cryoelectron microscopy technique. For this case, we only simulated a missing cone in the data to be able to apply the reconstruction method and evaluate its perfor- mance of filling up the missing cone. 3.3. Philip’s Crystallography Dataset It is a 3D model of a protein molecule acquired by a TEM but suffering from an LAP since it was not possible to tilt the specimen more than 45 degrees. Therefore, the 3D model has (in Fourier domain) a missing/corrupted cone with a vertex angle of 90 degrees. The size of this 3D model is 80 × 80 × 80 voxels in.mrc format. 4. Experimental Results The peak signal-to-no ise ratio (PSNR) is used as an eva- luation parameter to compare the test results. The PSNR is defined as follows: () 2 max 10 2 10log ˆ I PSNR mean II = − (3) Copyright © 2013 SciRes. ENG  M. V. OLIVA, H. H. MUHAMMED 577 where max I is the maximum voxel value of the 3D model, I is the original 3D model, and ˆ I is the recon- structed 3D model. PSNR values of 47.6 dB, 36.5 dB and 46.2 dB were obtained for the 3D reconstruction of the Hansandrey dataset in the cases of missing wedge, missing cone when considering xy-plane slices (i.e. horizontal slices in Fig- ure 3) and missing cone when considering xz-plane slic- es (i.e. radial slices in Figure 3), respectively. We can visually evaluate the quality of the best reconstructed result in Figure 4 (an open-source 3D visualization sof t- ware called Chimera was used). Regarding the result of the case of missing cone when using xy-plane slices, we attribute this poor PSNR value to the large “dead zones” (i.e. empty discs) present in the slices at the edges of the 3D model. The algorithm has a limitation and fails in filling these large gaps of missing data. (a) (b) Figure 3. Hansandrey dataset. (a) Missing wedge; (b) Miss- ing cone. For the viral DNA gatekeeper dataset, the reconstruc- tion ran as expected and a PSNR value of 45.9 dB was obtained. Visual comparison between the original 3D model and the reconstructed one, shown in Figure 5, assures that this high PSNR value corresponds to good visual similarity. The differences between the original 3D model and the reconstruction are almost negligible. In the case of Philip’s crystallography dataset, the re- construction result and the original 3D acquisition are presented in Figure 6. In this case, there is no reference 3D model that can be used to verify whether the recon- struction result is satisfac tor y or not. Visually speaking, we cannot detect large differences (a) (b) Figure 4. Reconstruction of the Hansandrey dataset with missing wedge. (a) Original; (b) Reconstructed. (a) (b) (c) Figure 5. Reconstruction of the viral DNA gatekeeper data- set. (a) Original model; (b) Missing cone; (c) Reconstruc- tion. (a) (b) Figure 6. Reconstruction of Philip’s crystallography dataset. (a) Acquisition; (b) Proposed reconstruction. Copyright © 2013 SciRes. ENG  M. V. OLIVA, H. H. MUHAMMED 578 between the original model and the reconstructed one, but the difference in terms of a calculated PSNR value of 21 dB is quite considerable. But this doesn’t mean that the method doesn’t work properly. It reflects that new details appear in the reconstructed volume which could be closer to the real 3D model without missing data . 5. Discussion and Conclusions The purpose of our work was to apply a new method to solve LPAs (e.g. with a missing cone or a missing wedge of the acquired image-data volume) in TEM data. The method was applied to different d atasets and the resu lting reconstructed image volumes were evaluated. Good 3D reconstruction results were obtained. The PSNR values were calculated for all resulting reconstructed images. These PSNR values were better than those obtained us- ing existing commonly used techniques, such as POCS. The approa ch proposed in our work can be cons idered as a great breakthrough, because for data acquisitions li- mited to [45˚, −45˚], POCS results in an error-rate ar ound 40%, while our approach achieves an error-rate lower than 1% for the Hansandrey and the viral DNA gatekee- per cases when 50% of the acquired data is missing. However, different acquisition technique and proce- dures will produce data with different sparsity characte- ristics in frequency domain, which in its turn will affect the performance of our method. For example, if a large portion of the high frequency zones of the acquired data is missing or corrupted, then it gets much more difficult to reconstruct the missing part of the 3D model because the algorithm doesn’t have e n ough prior information. Therefore, we have to take under consideration that a test measure is needed to determine which datasets, with the presence of missing data, are valid or not to apply the proposed method and get good 3D reconstruction resu lts. If such a test is performed, it will be possible to know if the obtained 3D reconstruction result is supposed to be similar to the real original model (i.e. without missing data) or not. Then it will be possible to know if the 3D reconstruction of Philip’s crystallography dataset (pre- sented in Figure 6) is correct or not. One of the most exciting research projects that could emerge from our work is the possibility to develop a new optimized acquisition technique or procedure for TEM. In addition, achieving a considerable reduction of radia- tion dose applied to the specimen. Another possibility is to adapt the proposed method and apply it to other kinds of modalities like Computed Tomography (CT), Mag- netic Resonance Imaging (MRI), astronomy, geophysical exploration or other type of electron microscope tech- niques. Since a complete reconstruction of the Hansand- rey model took 32 hours in a common laptop (4-core 2.0 GHz and 4 Gb RAM), it would be necessary to speed up the algorithm by implementing it using GPU techniques (e.g. CUDA, OpenCL). 6. Acknowledgements This paper would not have been possible without the support and help of Dr. Philip Koeck (from the Royal Institute of Technolog y KTH, Sweden) who supplied th e Hansandrey dataset and Philip’s crystallography dataset. REFERENCES [1] H. Peng and H. Stark, “Signal Recovery with Similarity Constraints,” Journal of the Optical Society of America A, Vol. 6, No. 6, 1989, pp. 844-851. http://dx.doi.org/10.1364/JOSAA.6.000844 [2] M. I. Sezan, “An Overview of Convex Projections Theory and Its Application to Image Recovery Problems, Ultra- microscopy,” Journal of t he Optical Society of America A, Vol. 40, No. 1, 1992, pp. 55-67. [3] M. I. Sezan and H. Stark, “Tomographic Image Recon- struction from Incomplete View Data by Convex Projec- tions and Direct Fourier Inversion,” IEEE Transactions on Medical Imaging, Vol. 3, No. 2, 1984, pp. 91-98. http://dx.doi.org/10.1109/TMI.1984.4307661 [4] M. Fornasier, “A Convergent Overlapping Domain De- composition Method for Total Variation Minimization,” Numerische Mathematik, Vol. 116, No. 4, 2010, pp. 645- 685. http://www.ricam.oeaw.ac.at/people/page/fornasier/ [5] A. Foi, K. Egiazarian and V. Katkovnik, “Compressed Sensing Image Reconstruction via Recursive Spatially Adaptive Filtering,” Image Processing, Vol. 1, 2007, pp. 549-552. [6] D. L. Donoho, “Compressed Sensing,” IEEE Transac- tions on Information Theory, Vol. 52 No. 4, 2006, pp. 1289-1306. [7] Y. Tsaig and D. L. Donoho, “Extensions of Compressed Sensing,” Signal Processing, Vol. 86, No. 3, 2006, pp. 549-571. http://dx.doi.org/10.1016/j.sigpro.2005.05.029 [8] J. Romberg, E. Candes and T. Tao, “Robust Uncertainty Principles: Exact Signal Reconstruction from Highly In- complete Frequency Information,” IEEE Transactions on Information Theory, Vol. 52, No. 2, 2006, pp. 489-509. http://dx.doi.org/10.1109/TIT.2005.862083 [9] D. L. Donoho and M. Elad, “Maximal Sparsity Represen- tation via l1 Minimization,” Proceedings of the National Academy of Sciences of USA, Vol . 100, No. 5, 2008, pp. 2197-2202. http://dx.doi.org/10.1073/pnas.0437847100 [10] V. Katkovnik, K. Dabov, A. Foi and K. Egiazarian, “Im- age Denoising by Sparse 3d Transform-Domain Collabo- rative Filtering,” IEEE Transacti ons on I mage Processing, Vol. 16, No. 8, 2007, pp. 2080-2095. [11] Automated Molecular Imaging Group, Matlab mrc Spe- cification. http://ami.scripps.edu/software/mrctools/mrc_specificatio n.php [12] L. G. Ofverstedt, S. Masich, H. Rullgard, B. Danelholt and O. Oktem, “Simulation of Transmission Electron Mi- croscope Images of Biological Specimens,” Journal of Microscopy, Vol. 243, No. 3, 2011, pp. 234-256. Copyright © 2013 SciRes. ENG |