

Paper Menu >>
Journal Menu >>
 Journal of Geographic Information System, 2014, 6, 1-10 Published Online February 2014 (http://www.scirp.org/journal/jgis) http://dx.doi.org/10.4236/jgis.2014.61001 OPEN ACCESS JGIS Spatial Risk Analysis of Water Borne Diseases (Bovine Leptospirosis) in the Rive Nile State-Sudan Rania Salah Eldien Bashir Abass, Mutafa Yousif Mohamed Abd Alla, Ali Mohammed El-Hassan El-Eragi Field Operation Division, General Directorate of Animal Health and Epizootic Diseases Control, Ministry of Animal Resources and fisheries, Khartoum, Sudan Email: [email protected] Received October 3, 2013; revised November 3, 2013; accepted November 10, 2013 Copyright © 2014 Rania Salah Eldien Bashir Abass et al. This is an open access article distributed under the Creative Commons At- tribution License, which permits unrestricted use, distribution, and reproduction in any medium, provided the original work is prop- erly cited. In accordance of the Creative Commons Attribution License all Copyrights © 2014 are reserved for SCIRP and the owner of the intellectual property Rania Salah Eldien Bashir Abass et al. All Copyright © 2014 are guarded by law and by SCIRP as a guardian. ABSTRACT Geographical Information Science (GIS) technologies have been used increasingly for ecology and epidemiology of water-borne diseases, providing approach for animal health issues. This study was set up to investigate the geographical distribution of Bovine that was affected by Leptospira hardijo, in River Nile state, on October 2012. Locations of targeted cattle were delimited using GPS. Fifty three (53) of blood samples were collected, and screened in the laboratory for Leptospira hardijo specific antibodies using indirect ELISA. 15.09% had evidence of infection as determined by the presence of anti-leptospira antibodies. It was inferred that no incidences were recorded in 45 locations out of the 53 selected locations in the state. Leptospirosis risk area for transmission was mapped using 5 km buffer distance. Animals’ movements routes were mapped with their contacts area and pos i- tive samples locations, hafair locations where animals contacts were mapped. This study demonstrated the value of GIS and GPS in disease mapping for animals’ health, and this might help veterinary authorities to implement strategic interventions for animal disease control. KEYWORDS GIS; Water Borne Diseases; Risk Analysis 1. Introduction Leptospirosis is an infectious disease caused by patho- genic leptospires that are transmitted directly or indirect- ly from animals to humans. Leptospires are bacteria which can be either pathogenic (i.e. having the potential to cause disease in animals and humans) or saprophytic (i.e. free living and generally considered not to cause disease). Pathogenic leptospires are maintained in nature in the renal tubules of certain animals. Saprophytic lep- tospires are found in many types of wet or humid envi- ronments ranging from surface waters and moist soil to tap water [1]. The causal agent of leptospirosis is aspiral-shaped aerobic spirochete bacterium of the genus Leptospira in the family Leptospiraceae, order Spirochateales. The size of this organism is 6 - 20 μm long and 0.1 μm in diame- ter with 18 or more coils per cell. The coils tend to stain poorly with common laboratory stains and are best visua- lized by dark field microscopy, silver stain or fluorescent microscopy. Before 1989, the genus Leptospira was di- vided into 2 species, Leptospira interrogans and Leptos- pira biflexa [2]. WHO has identified leptospirosis as a neglected tropical disease, and estimates the median global incidence of leptospirosis to be at least 5.1 cases per 100,000 per year in endemic areas, and 14 cases per 100,000 per year during epidemics. However, inci- dences vary significantly between regions, with esti- mated annual incidences per 100,000 per year ranging from 95.5 in Africa, 66.4 in the Western Pacific, 12.5 in the Americas, 4.8 in South-East Asia, to 0.5 in Eu- rope [2]. The species L. interrogans comprises all pathogenic strains while L. biflexa contains the non-pathogenic strains. Recently, taxonomic studies based on DNA hy- bridization divided the genus Leptospira into 20 species [3]. The species that causes illness to man is L. interro- 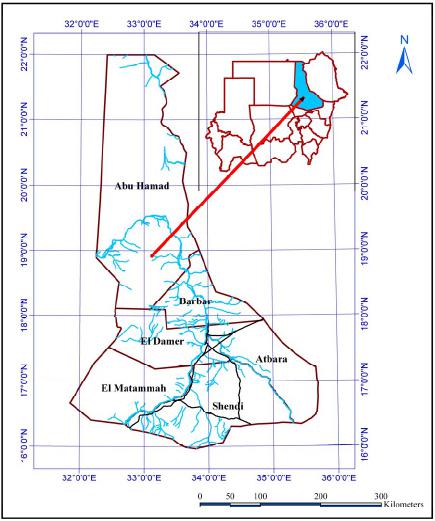 R. S. E. BASHIR ABASS ET AL OPEN ACCESS JGIS 2 gans. More than 200 serovars of L. interrogans have been identified. Animals that are natural hosts to a par- ticular serovar usually show no or comparatively few ill effects after infection with that serovar. However, they may develop illness after infection with another serovar. In the initial stage of an infection, animals may show mild symptoms, such as malaise and a drop in milk production in cows. Chronic infections may lead to re- productive problems, such as abortion and low fertility in cattle or pigs. Mild leptospiral infection in domestic ani- mals may pass unnoticed. Occasionally, calves and pig- lets may suffer from an icterohaemorrhagic syndrome with potentially fatal outcome. As in humans, animals that are incidental hosts may become ill with severe dis- ease. Infections can be fatal. Dogs may suffer from a chronic disease leading to kidney damage, but may also suffer from an acute Weil’s-like disease syndrome after infection with certain serovars. The disease is found mainly wherever humans come into contact with the urine of infected animals or a urine-polluted environ- ment. Leptospirosis is endemic in many countries. It of- ten has a seasonal distribution, increasing with increased rainfall or higher temperature. However, the disease can occur throughout the whole year. Epidemics may be as- sociated with changes in human behavior, animal or se- wage contamination of water, changes in animal reser- voir density or follow natural disasters such as cyclones and floods [4]. Leptospirosis is found throughout the world, but is particularly common in tropical and subtropical regions where environmental conditions favour the survival and transmission of leptospires. An estimated 500,000 severe cases occur each year (accounting for only 5% to 15% of all clinical infections), and case-fatality rates of over 30% have been reported in some areas [5]. Predicting epidemics is a great challenge for epidemic- ologists regarding the emergence or reemergence of in- fectious diseases. Remote sensing and GIS are tools of great potential for a near real-time linkage between epi- demiology and environmental characteristics. Beside dis- ease incidence and prevalence in vectors and hosts, geo- graphy is a main source of information for epidemiologi- cal studies, making a link between environmental and social approaches. Space technologies, therefore become more widely used in this field, especially for the mo- toring of tropical diseases [6]. Person, place, time: these are the basic elements of outbreak investigations and epidemiology. Historically, however, the focus in epidemiologic research has been on person and time, with little regard for the implica- tions of place or space even though disease mapping has been done for over hundreds of years [6,7]. The development of GIS has provided a more power- ful and rapid ability to examine spatial patterns and processes. This, in turn, has fostered the discussion of such policy relevant issues as health services and plan- ning as well as the use of GIS for epidemiologic investi- gations and disease surveillance [8]. The main objective of this study is to investigate the spatial distribution and ecology of bovine leptospirosis in River Nile state to locate the positive cases using Global Positioning System (GPS) and determine leptospirosis risk areas through mapping the factors that encourage the spreading of disease. 2. Materials and Methods 2.1. Study Area The present study was conducted in River Nile State which located between longitude 32˚N - 35˚N and lati- tude 16˚E - 22˚E, (Figure 1). The most important cli- matic feature of the State is the occurrence of a long dry season extending for eight months from November to June, with a rainy season from July to September/Octo- ber with an average annual rainfall of 150 mm in the southern part to 25 mm in northern part. The average temperature ranges from 8˚C to 47˚C. The vegetation of the State is poor and sparse. In the desert zones, it is virtually absent except along the banks of the Nile River and water sources where ephemeral herbs and grasses occur after the occasional rainfall. The numbers of animals in the River Nile State are modest compared to other States of the country. Sheep and goats constitute the majority of the animal wealth with an estimated population of 1,034,655 sheep, 1,211,095 Goat, 100,701 Cattle and 114,103 camel Figure 1. Study area (River Nile State).  R. S. E. BASHIR ABASS ET AL OPEN ACCESS JGIS 3 (Ministry of Animal Resources, River Nile State). 2.2. Samples Collection Fifty three blood samples were collected randomly from cattle in River Nile state, on October 2012, locations identified using GPS (GARMIN-GPSMAP 60CSx).The blood samples were collected in plain vacutainers, cen- trifuged to separate the serum and stored at –20˚C till used. Collected sera were tested for the presence of lep- tospira antibodies using indirect Leptospira hardijo ELLISA kit (Cat. No.79038923, prioCHECK L. hardijo AB, Germany). 2.3. Detection of Leptospira Antibodies Briefly; the test uses 96-well microtitration plates sensi- tized by purified antigen Leptospira hardjo. The plate’s odd columns (1, 3, 5, 7, 9, and 11) contain the LPS, whereas the even columns (2, 4, 6, 8, 10, and 12) contain a control antigen. The sera were diluted in the dilution buffer. The plate was incubated and the LPS washed, then the conjugate, protein G peroxidase-labelled, is added to the wells. The plate was incubated a second time at 21˚C +/− 3˚C. After the second incubation, the plate was washed again and the chromogen (tetramethylbenzidine) is added. This chromogen has the advantages of being more sensitive than the other peroxidase chromogens and not being car- cinogenic. If specific Leptospira hardjo immunoglobu- lins are present in the test sera, the conjugate remains bound to the microwell that contains the bacterial antigen and the enzyme catalyses the transformation of the colorless chromogen into a pigmented compound. The intensity of the resulting blue color is proportionate to the titer of the specific antibody in the sample. All the reagents were brought to 21˚C +/− 3˚C before the use. For sera, one milliliter aliquots were placed of the dilution buffer, prepared as instructed in the “Com- position of the Kit” section, in 5 or 10 ml hemolysis tubes. 10 ml of the serum samples was added to each of these tubes (dilution 1/100) and were shacked briefly on a mechanical agitator. Positive and negative sera were diluted 1/100 in dilu- tion buffer. Sera samples were distributed and the posi- tive and negative sera (100 ml/well) as follows: positive serum in wells A1 and A2, negative serum in wells B1 and B2, sample 1 in wells C1 and C2, sample 2 in wells D1 and D2 etc. The plate was incubated at 21˚C +/− 3˚C for one hour. The plate was rinsed with the washing solution, was prepared as instructed in the “Composition of the Kit” section, as follows: the microplate was emp- tied of its contents by flipping it over sharply above a sink. Tap the microplate upside down against a piece of clean absorbent paper to remove all the liquid. The used wells were filled with the washing solution using a squeeze bottle or by plunging the plate in a vessel of the right dimensions, then empty the wells once more by turning the plate over above a sink. Repeat the entire operation two more times, taking care to avoid the for- mation of bubbles in the microwells. After the plate has been washed three times the conjugate was diluted 1:50 in the dilution buffer. 100 ml of the conjugate solution was added to each well. Incubated for 1 hour at 21˚C +/−3˚C, the plate was washed as described in step 6 above. 100 ml of the chromogen solution was added to each well on the plate and incubated for 10 minutes at 21˚C +/− 3˚C protected from the light and uncovered. 50 ml of stop solution was added to each microwell. The optical densities in the microwells were read using a plate reader at 450 nm. Results were read fairly soon after the stopping solution has been added since the chromogen may cristallize in the wells with strong sig- nals and thereby distort the data. The test can be validated only if the positive serum yields a difference in optical density at 10 minutes that is greater than 0.8 and the negative serum yields a differ- ence in optical density that is lower than 0.3. Divide the signal read for each sample well by the corresponding positive control serum signal and multiply this result by 100 to express it as a percentage. ValDelta OD Sample100Delta OD positive Table 1 can be used to determine the serum’s degree of positivity. 2.4. GIS Software An Arc View 9.3 software system was used to map sam- ples locations. The data used were: animals population 2011(Ministry of Animal Resources-River Nile state), human population 2008 (Sudan Central Bureau of Statis- tics), Samples location by GPS (River Nile State), hafairs locations where animals contacts, Animals routs. The buffering method was used to determine the risk area. 3. Results This study demonstrated the use of GIS in the study of Table 1. The serum’s degree of positivity. 0 + ++ +++ ++++ +++++ Val <= 20% < Val <= 40% < Val <= 60% < Val <= 80% < Val <= 100% < Val 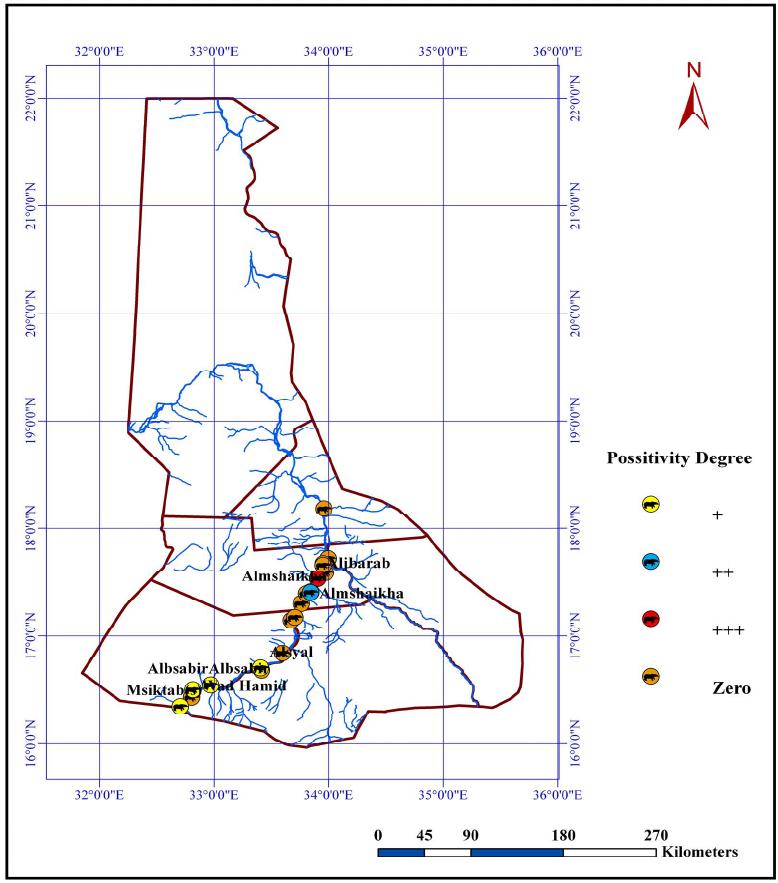 R. S. E. BASHIR ABASS ET AL OPEN ACCESS JGIS 4 leptospirosis in River Nile State. The results of this study supported the evidence that leptospirosis is a burdensome disease of animals and human health in the Sudan just as in other countries in the tropics where there are the ap- propriate environmental conditions for the survival of the infective agents. In some developed countries, leptospi- rosis is a disease of economical significance in animal husbandry (Levett, 2001) rather than a human illness. Samples locations layer was prepared and overlaid with possitive samples layer using GIS software, a map was created as shown in (Figure 2). The animals and human population layers were over- laid with positive samples locations layer to compare the distribution of the disease as shown in (Figure 3). To estimate the probable risk from animal movement, buffer tool was used to create buffer zone of risk area from positive samples locations, 5 km distance was de- termined according to animals movement the previous studies (Weise et al., 2006). The buffer zone layer was overlaid with an urban area to estimate the risk map as shown in (Figure 4). Hafair is a main source of water for animal use, hence it has an affect the disease spreading, locations of Hafairs were determined using GPS and has been overlaid it with animals population layer, positive samples locations layer and negative samples locations as shown in (Figure 5). Animal’s tracks were mapped, routes for searching for water and grazing, overlaid with Hafair layer and posi- tive samples locations layer (Figure 6). Figure 2. Spatial distribution of leptospirosis in the study area.  R. S. E. BASHIR ABASS ET AL OPEN ACCESS JGIS 5 Figure 3. Distribution of animals, human population and disease. 4. Discussion Incidences survey was confirmed through indirect ELISA test. This is used to visually interpret the spread of incidences according to their intensity in the localities. From (Figure 2), it was inferred that no cases were recorded in 45 locations out of the 53 locations present in the state, this study, as far as we are aware, is the first to describe leptospira hardijo infection. This study, per- formed in zone (A) for cattle leptospirosis, identified positive samples distribution of leptospira infection with- in cattle in River Nile state shown in (Figure 2). Among numbers of cattle which move in rural area as index cas- es of leptospirosis, 15.09% had evidence of infection as determined by the presence of anti-leptospira antibodies in the indirect ELISA as shown in (Table 2). Animal’s population layer shows the numbers of each species through the localities, it has been found that goats have the highest numbers and cattle the lowest. This layer has been overlaid over the human population layer. From population layer it appears that Eldamer locality has the highest population. Our finding indicate that positive cases of leptospirosis are found in Eldamer locality which is the highest popu- lation and Elmatama which is the fourth in order, the location of positive samples near Atbara River that pass through ELdamer and Atbara, and near river Nile which divide Elmatama and Shendi, movement and migration  R. S. E. BASHIR ABASS ET AL OPEN ACCESS JGIS 6 Figure 4. Buffer zones for the positive sample location. of animals and humans through Atbara river and river Nile increase risk for leptospira infection in Atbara and Shendi localities. It can be suggested that infection risk varies over short distances within theses rural areas. These risk differences may relate to differences between animals husbandry with respect to rodent population densities and proximity to environmental source of contamination such as surface water, larger buffers (5 km) often included other valleys, watersheds, a buffer distance of 5km was chosen for analysis because it provided the best prediction of risk area. Leptospirosis has latency period of 10 - 14 days be- tween contact and development of clinical signs of infec- tion; we predict that animals are able to travel during this latency period. By maintaining a portion of the popula- tion in a latent disease state, the distribution of infected animals perpetuated as animals disperse across a board geographical area. In higher temperature human and animals may partici- pate in water based activities such as swimming, bathing or drinking, these activities increase contact probability of human and animals and leptospires where hafair lo- cated in rural areas as shown in (Figure 4). The cases of leptospirosis mostly occurred during the rainy season, the highest average of rainfall in August 26 - 35 mm (Figure 5) shows this. The inability of leptospires to survive out of water is the single most important control factor in the natural environment, as it means they are unable to create infection risks from dry surfaces. The cases of leptospirosis mostly occurred during the rainy season, the highest average of rainfall in August 26  R. S. E. BASHIR ABASS ET AL OPEN ACCESS JGIS 7 Table 2. Serum samples result. Sample No Result by Percentage Positivity Degree Location Sample No Result by Percentage Positivity Degree Location 1 4.23% 0 Atbara 23 18.93% 0 Umm Eltiuor 2 6.27% 0 Atbara 24 7.35% 0 Alsyal 3 4.07% 0 Atbara 25 1.77% 0 Alsyal 4 5.84% 0 Atbara 26 38.34% + Alsyal 5 3.38% 0 Atbara 27 4.88% 0 Alsyal 6 3.86% 0 Atbara 28 9.06% 0 Elwehaib 7 0.64% 0 Atbara 29 46.33% ++ Elmashaikha 8 1.55% 0 Atbara 30 49.87% ++ Elmashaikha 9 2.09% 0 Elaaliab 31 7.35% 0 Elremaila Ganoub 10 16.35% 0 Elaaliab 32 3.54% 0 Elgambarat 11 3.06% 0 Elaaliab 33 16.41% 0 Elgambarat 12 14.90% 0 Elaaliab 34 7.88% 0 Elgambarat 13 2.25% 0 Elfadnia 35 1.72% 0 Elhamadab 14 5.09% 0 Elfadnia 36 15.44% 0 Teiba Alkhwad 15 7.72% 0 Eldamar 37 10.26% 0 Wad Hamid 16 19.09% 0 Eldamar 38 4.77% 0 Wad Hamid 17 6.54% 0 Elkitiab 39 22.14% + Wad Hamid 18 −0.75% 0 Elkitiab 40 8.36% 0 Basabir 19 73.94% +++ Elgabrab 41 75.81% ++ Basabir 20 13.89% 0 Elgabrab 42 24.72% + Elmesektab 21 −0.05% 0 Elfadlab 43 3.27% 0 Elmesektab 22 4.08% 0 Elfadlab 44 3.38% 0 Hager Elaasal 45 2.79% 0 Shendi - 35 mm. During this month all hafair fill in with water, this facilitates leptospira organisms’ growth in water. The bacteria can survive for 1 to 2 months. In the natural wa- ter sources, leptospira spp. Can survive even with expo- sure to UV-A radiation for 6 hours. This may lead to greater chance for animals and people to be exposed to leptosira organisms during their movement from and to hafair. The positive samples of leptospirosis located near animals routs and their contact at hafair location and this may lead to greater chance and increase risk of exposure animals to leptospira infection during their movements. The potential application of GIS to epidemiological studies has been shown by recent studies. GIS is a val- uable tool of environmental epidemiology. GIS also permits analysis of spatial and non-spatial information and hence is an excellent framework for disease moni- toring and control (Clarke et al., 1996) have reviewed the use of GIS in surveillance and monitoring of vector borne diseases, water borne diseases, environmental health and modeling and the analysis of the diseases pol- icy and planning. 5. Conclusions This study demonstrated the value of GIS in disease mapping for investigating the spatial distribution of lep- tospirosis infection, identifying geographic and environ- mental risk factors, and enhancing our understanding of  R. S. E. BASHIR ABASS ET AL OPEN ACCESS JGIS 8 Figure 5. Animals population and surface water resources (Hafair). disease transmission and the ability to accurately assess, predict, and map environmental drivers of disease trans- mission. The output disease maps have facilitated knowledge on the geographical distribution of leptospirosis at the localities level. The epidemiology of leptospirosis is complex and va- ries significantly in different environmental settings. Its transmission dynamics can be influenced by climatic events, environmental factors, animal reservoirs, as well as human behavior and social trends. The present study revealed that the disease is present in most of the localities suggesting that the detected an- tibodies were due to active or past exposure to infection since there were no adopted vaccination progarammes against leptospirosis all over the country. Acknowledgements I would like to express my sincere thanks and gratitude to Dr. Mutafa Yousif Mohamed-Elzaem Elazhari University for his support, encouragement and guidance. My thanks and appreciations were extended to all the veterinarians at the Veterinary Research Institute, espe- cially Dr. Ali Mohammed El-Hassan El-Eragi (Head De- partment of Pathology and Diagnosis-VRI), for their fruit- ful discussions and inspirations that helped me to per- form this work as well as in writing this manuscript. 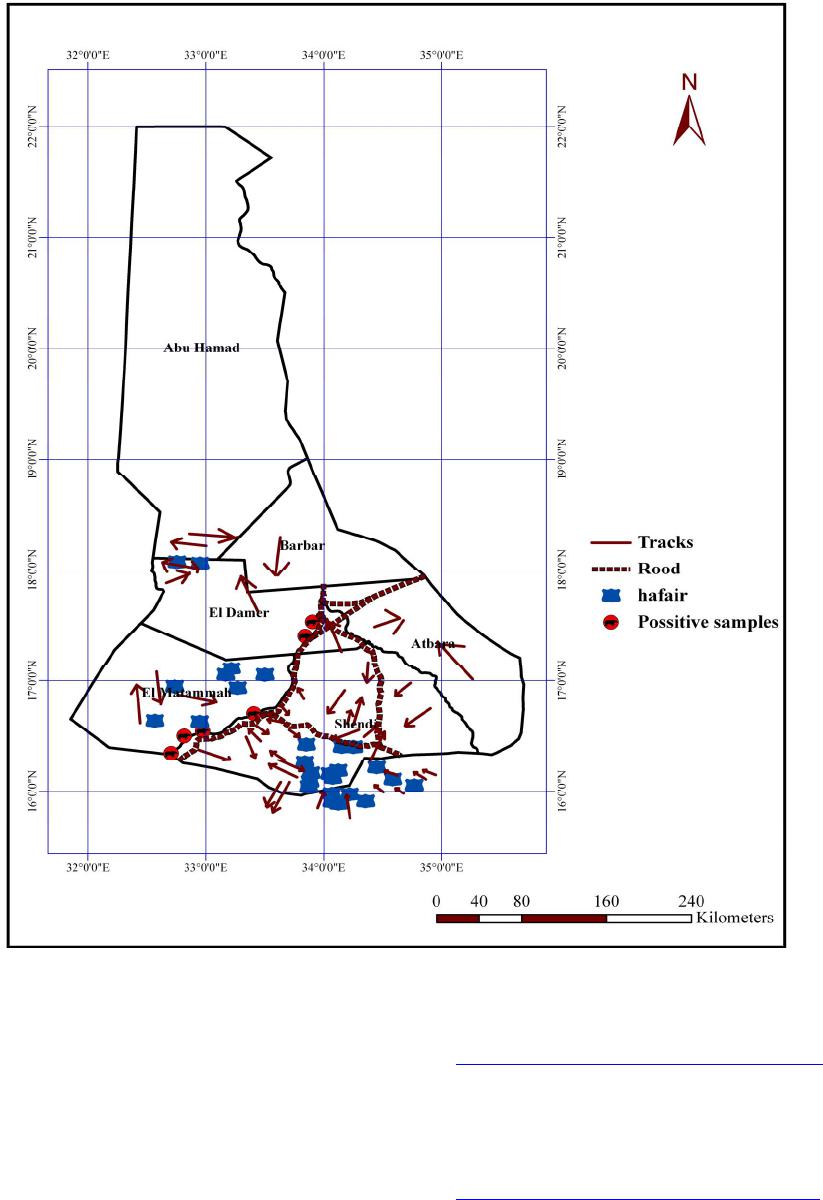 R. S. E. BASHIR ABASS ET AL OPEN ACCESS JGIS 9 Figure 6. Animals movement and their routes in the state. I would like also to thank Eng. Alaa Eldien Hassan Mohamed (Department of planning, water corporation, River Nile State) for providing some information. I would like to thank Dr. Omiema Ahmed Abd Allah (Head of Epizootic Diseases control Directorate—River Nile State) for her help and support. REFERENCES [1] WHO/FAO/OIE, “Collaborating Centre for Reference and Research on Leptospirosis, Queensland Health Fo- rensic and Scientific Services,” National Leptospirosis Surveillance Report Number 18, 2009. [2] P. N. Levett, “Leptospirosis,” Clinical Microbiology Re- views, Vol. 14, No. 2, 2001, pp. 296-326. http://dx.doi.org/10.1128/CMR.14.2.296-326.2001 [3] A. R. Bharti, J. E. Nally, J. N. Ricaldi, M. A. Matthias, M. M. Diaz, M. A. Lovett, P. N. Levett, R. H. Gilman, M. R. Willig, E. Gotuzzo and J. M. Vinetz, “Leptospirosis: A Zoonotic Disease of Global Importance,” The Lancet In- fectious Diseases, Vol. 3, No. 12, 2003, pp. 757-771. http://dx.doi.org/10.1016/S1473-3099(03)00830-2 [4] WHO/FAO/OIE, “Collaborating Centre for Reference and Research on Leptospirosis, Queensland Health Fo- rensic and Scientific Services,” National Leptospirosis Surveillance Report Number 18, 2009.  R. S. E. BASHIR ABASS ET AL OPEN ACCESS JGIS 10 [5] WHO, “Water-Related Diseases,” 2006. http://www.who.int/water_sanitation_health/diseases/en/ [6] M. J. C. DeLepper, H. J. Scholten and R. M. Stern, “The Added Value of Geographical Information Systems in Public and Environmental Health,” Kluwer Academic Publishers, Dordrecht, 1995, 355 p. [7] A. Gatrell, “GIS and Health: From Spatial Analysis to Spatial Decision Support,” In: M. Craglia and H. Onsrud, Eds., Geographic Information Research: Transatlantic Perspectives, Taylor and Francis, London, 1999, pp. 143- 158. [8] S. A. Matthews, “Epidemiology Using a GIS: The Need for Caution,” Computers, Environment and Urban Sys- tems, Vol. 14, No. 3, 1990, pp. 213-221. http://dx.doi.org/10.1016/0198-9715(90)90010-Q |