

Paper Menu >>
Journal Menu >>
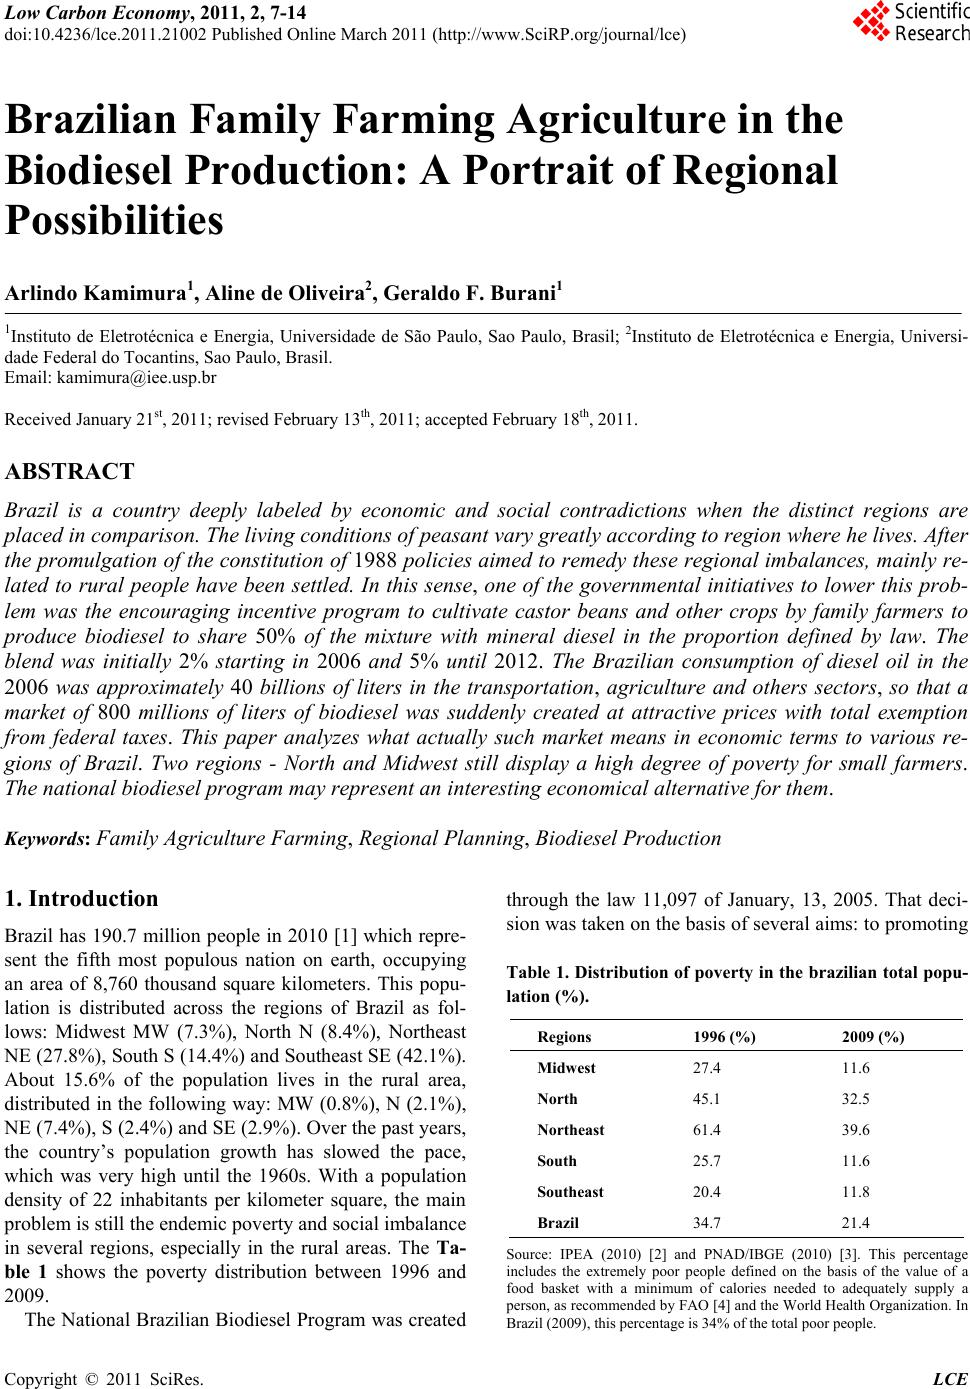 Low Carbon Economy, 2011, 2, 7-14 doi:10.4236/lce.2011.21002 Published Online March 2011 (http://www.SciRP.org/journal/lce) Copyright © 2011 SciRes. LCE 7 Brazilian Family Farming Agriculture in the Biodiesel Production: A Portrait of Regional Possibilities Arlindo Kamimura1, Aline de Oliveira2, Geraldo F. Burani1 1Instituto de Eletrotécnica e Energia, Universidade de São Paulo, Sao Paulo, Brasil; 2Instituto de Eletrotécnica e Energia, Universi- dade Federal do Tocantins, Sao Paulo, Brasil. Email: [email protected] Received January 21st, 2011; revised February 13th, 2011; accepted February 18th, 2011. ABSTRACT Brazil is a country deeply labeled by economic and social contradictions when the distinct regions are placed in comparison. The living conditions of peasant vary greatly according to region where he lives. After the promulgation of the constitution of 1988 policies aimed to remedy these regional imbalances, mainly re- lated to rural people have been settled. In this sense, one of the governmental initiatives to lower this prob- lem was the encouraging incentive program to cultivate castor beans and other crops by family farmers to produce biodiesel to share 50% of the mixture with mineral diesel in the proportion defined by law. The blend was initially 2% starting in 2006 and 5% until 2012. The Brazilian consumption of diesel oil in the 2006 was approximately 40 billions of liters in the transportation, agriculture and others sectors, so that a market of 800 millions of liters of biodiesel was suddenly created at attractive prices with total exemption from federal taxes. This paper analyzes what actually such market means in economic terms to various re- gions of Brazil. Two regions - North and Midwest still display a high degree of poverty for small farmers. The national biodiesel program may represent an interesting economical alternative for them. Keywords: Family Agriculture Farming, Regional Planning, Biodiesel Production 1. Introduction Brazil has 190.7 million people in 2010 [1] which repre- sent the fifth most populous nation on earth, occupying an area of 8,760 thousand square kilometers. This popu- lation is distributed across the regions of Brazil as fol- lows: Midwest MW (7.3%), North N (8.4%), Northeast NE (27.8%), South S (14.4%) and Southeast SE (42.1%). About 15.6% of the population lives in the rural area, distributed in the following way: MW (0.8%), N (2.1%), NE (7.4%), S (2.4 %) and SE (2 .9%). Over the past years, the country’s population growth has slowed the pace, which was very high until the 1960s. With a population density of 22 inhabitants per kilometer square, the main problem is still the endemic poverty and social imbalance in several regions, especially in the rural areas. The Ta- ble 1 shows the poverty distribution between 1996 and 2009. The National Brazilian Biodiesel Program was created through the law 11,097 of January, 13, 2005. That deci- sion was taken on the basis of several aims: to promoting Table 1. Distribution of poverty in the brazilian total popu- lation (%). Regions 1996 (%) 2009 (%) Midwest 27.4 11.6 North 45.1 32.5 Northeast 61.4 39.6 South 25.7 11.6 Southeast 20.4 11.8 Brazil 34.7 21.4 Source: IPEA (2010) [2] and PNAD/IBGE (2010) [3]. This percentage includes the extremely poor people defined on the basis of the value of a food basket with a minimum of calories needed to adequately supply a person, as recommended by FAO [4] and the World Health Organization. In Brazil (2009), th i s percentage is 34% of the total poor people. 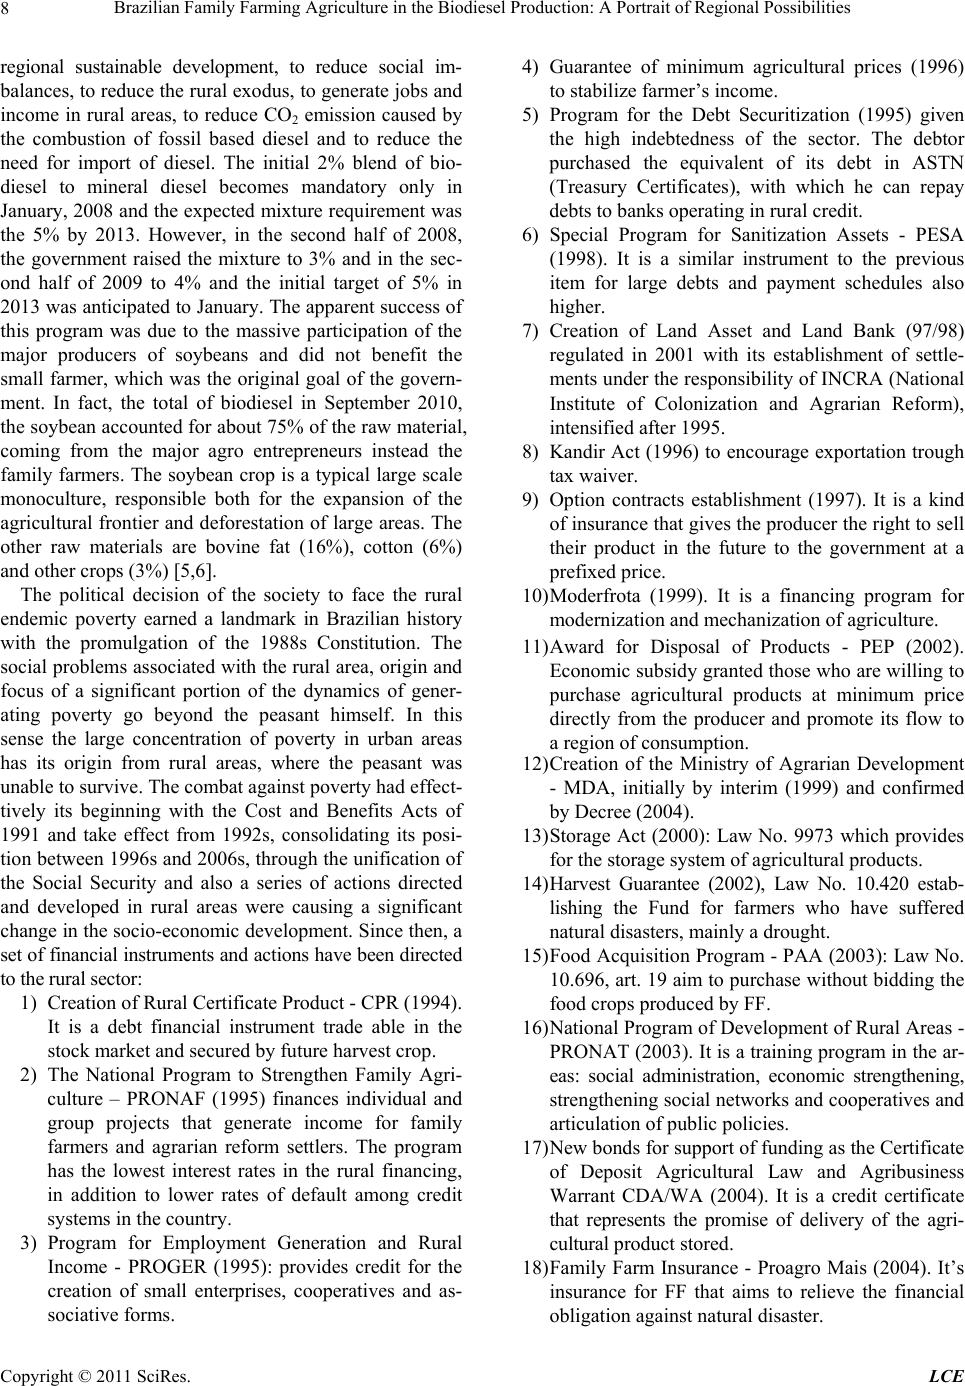 Brazilian Family Farming Agriculture in the Biodiesel Production: A Portrait of Regional Possibilities 8 regional sustainable development, to reduce social im- balances, to reduce the rural exodus, to generate jobs and income in rural areas, to reduce CO2 emission caused by the combustion of fossil based diesel and to reduce the need for import of diesel. The initial 2% blend of bio- diesel to mineral diesel becomes mandatory only in January, 2008 and the expected mixture requirement was the 5% by 2013. However, in the second half of 2008, the government raised the mixture to 3% and in the sec- ond half of 2009 to 4% and the initial target of 5% in 2013 was anticipated to January. The apparent success of this program was due to the massive participation of the major producers of soybeans and did not benefit the small farmer, which was the original goal of the govern- ment. In fact, the total of biodiesel in September 2010, the soybean accounted for about 75% of the raw material, coming from the major agro entrepreneurs instead the family farmers. The soybean crop is a typical large scale monoculture, responsible both for the expansion of the agricultural frontier and deforestation of large areas. The other raw materials are bovine fat (16%), cotton (6%) and other crops (3 %) [5,6]. The political decision of the society to face the rural endemic poverty earned a landmark in Brazilian history with the promulgation of the 1988s Constitution. The social problems associated with the rural area, origin and focus of a significant portion of the dynamics of gener- ating poverty go beyond the peasant himself. In this sense the large concentration of poverty in urban areas has its origin from rural areas, where the peasant was unable to survive. The combat against poverty had effect- tively its beginning with the Cost and Benefits Acts of 1991 and take effect from 1992s, consolidating its posi- tion betw een 1996s and 2006s, throug h the un ification of the Social Security and also a series of actions directed and developed in rural areas were causing a significant change in the socio-economic development. Since then, a set of financial instruments and actions have been directed to the rural sector: 1) Creation of Rural Certificate Product - CPR (1994). It is a debt financial instrument trade able in the stock market and secured by future harvest crop. 2) The National Program to Strengthen Family Agri- culture – PRONAF (1995) finances individual and group projects that generate income for family farmers and agrarian reform settlers. The program has the lowest interest rates in the rural financing, in addition to lower rates of default among credit systems in the country. 3) Program for Employment Generation and Rural Income - PROGER (1995): provides credit for the creation of small enterprises, cooperatives and as- sociative forms. 4) Guarantee of minimum agricultural prices (1996) to stabilize farmer’s income. 5) Program for the Debt Securitization (1995) given the high indebtedness of the sector. The debtor purchased the equivalent of its debt in ASTN (Treasury Certificates), with which he can repay debts to banks operating in rural credit. 6) Special Program for Sanitization Assets - PESA (1998). It is a similar instrument to the previous item for large debts and payment schedules also higher. 7) Creation of Land Asset and Land Bank (97/98) regulated in 2001 with its establishment of settle- ments under the responsibility of INCRA (National Institute of Colonization and Agrarian Reform), intensified after 1995. 8) Kandir Act (1996) to encourage exportation trough tax waiver. 9) Option contracts establishment (1997). It is a kind of insurance that gives the producer the right to sell their product in the future to the government at a prefixed price. 10) Moderfrota (1999). It is a financing program for modernization and mechanization of agri cul ture. 11) Award for Disposal of Products - PEP (2002). Economic subsidy gran ted those who are willing to purchase agricultural products at minimum price directly from the producer and promote its flow to a region of consumption. 12) Creation of the Ministry of Agrarian Development - MDA, initially by interim (1999) and confirmed by Decree (2004). 13) Storage Act (2000): Law No. 9973 which provides for the storage system of agricultu ral prod ucts. 14) Harvest Guarantee (2002), Law No. 10.420 estab- lishing the Fund for farmers who have suffered natural disasters, mainly a drought. 15) Food Acquisition Program - PAA (2003): Law No. 10.696, art. 19 aim to purchase without bidding the food crops produced by FF. 16) National Program of Development of Rural Areas - PRONAT (2003). It is a tr aining program in the ar- eas: social administration, economic strengthening, strengthen ing social networks and coop eratives and articulation of public policies. 17) New bonds for su pport of fund ing as the Certif icate of Deposit Agricultural Law and Agribusiness Warrant CDA/WA (2004). It is a credit certificate that represents the promise of delivery of the agri- cultural product stored. 18) Family Farm Insurance - Proagro Mais (2004). It’s insurance for FF that aims to relieve the financial obligation against natural disaster. Copyright © 2011 SciRes. LCE 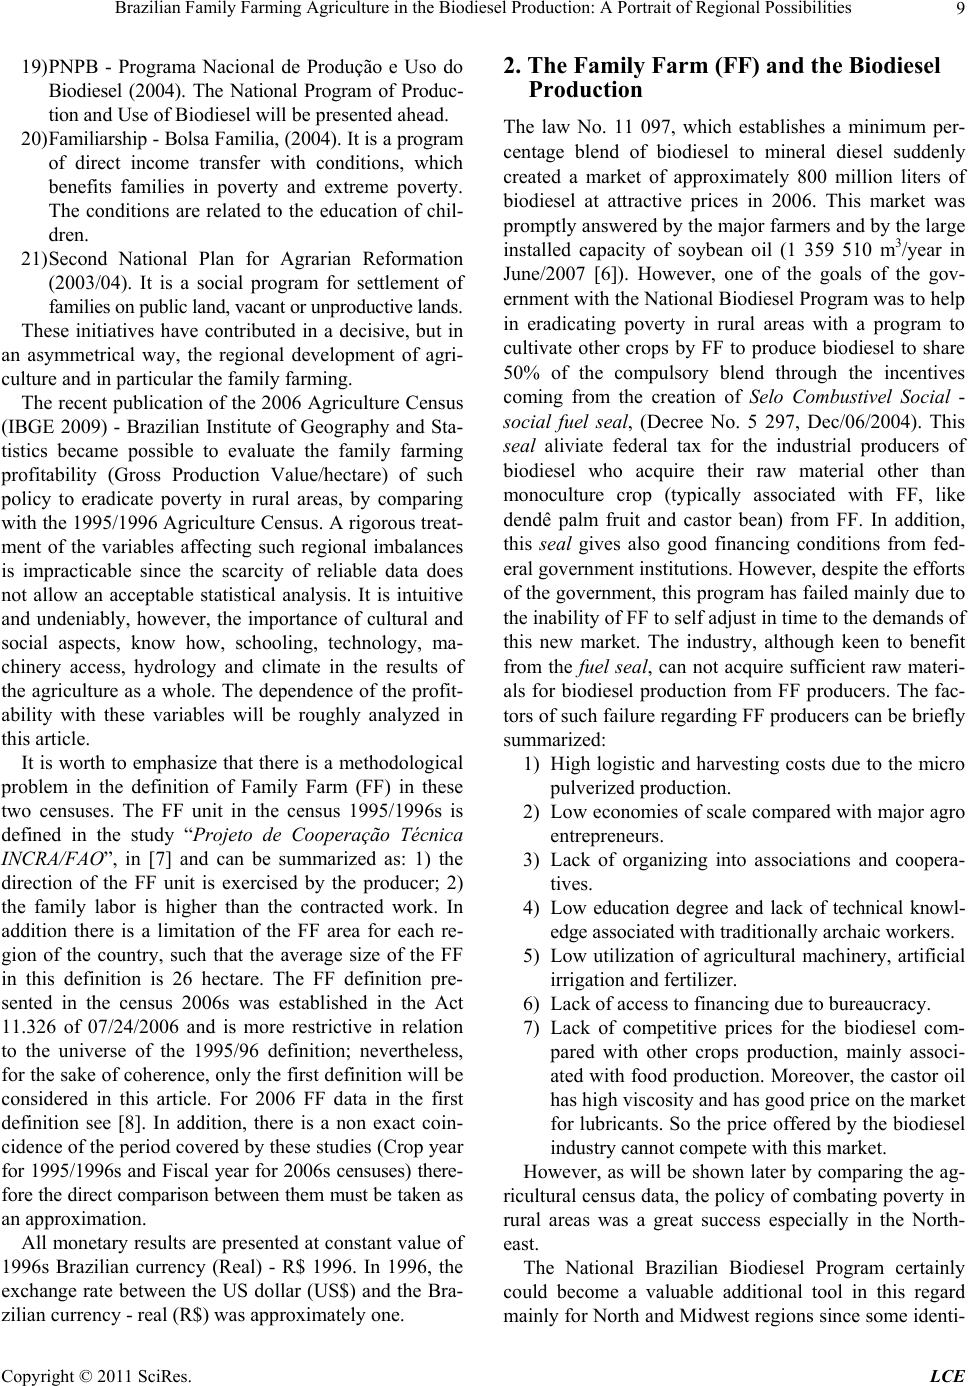 Brazilian Family Farming Agriculture in the Biodiesel Production: A Portrait of Regional Possibilities9 19) PNPB - Programa Nacional de Produção e Uso do Biodiesel (2004). The National Program of Produc- ti o n and Use of Biodiesel will be presented ahead. 20) Familiarship - Bolsa Familia, (2004). It is a program of direct income transfer with conditions, which benefits families in poverty and extreme poverty. The conditions are related to the education of chil- dren. 21) Second National Plan for Agrarian Reformation (2003/04). It is a social program for settlement of families on public land, vacant or unproducti ve lands. These initiatives have contributed in a decisive, but in an asymmetrical way, the regional development of agri- culture and in particular the family farming. The recent publication of the 2006 Agriculture Census (IBGE 2009) - Brazilian Institute of Geography and Sta- tistics became possible to evaluate the family farming profitability (Gross Production Value/hectare) of such policy to eradicate poverty in rural areas, by comparing with the 1995/1996 Agriculture Census. A rigorous treat- ment of the variables affecting such regional imbalances is impracticable since the scarcity of reliable data does not allow an acceptable statistical analysis. It is intuitive and undeniably, however, the importance of cultural and social aspects, know how, schooling, technology, ma- chinery access, hydrology and climate in the results of the agriculture as a whole. The dependence of the profit- ability with these variables will be roughly analyzed in this article. It is worth to emphasize that there is a methodological problem in the definition of Family Farm (FF) in these two censuses. The FF unit in the census 1995/1996s is defined in the study “Projeto de Cooperação Técnica INCRA/FAO”, in [7] and can be summarized as: 1) the direction of the FF unit is exercised by the producer; 2) the family labor is higher than the contracted work. In addition there is a limitation of the FF area for each re- gion of the country, such that the average size of the FF in this definition is 26 hectare. The FF definition pre- sented in the census 2006s was established in the Act 11.326 of 07/24/2006 and is more restrictive in relation to the universe of the 1995/96 definition; nevertheless, for the sake of coherence, only the first definition will be considered in this article. For 2006 FF data in the first definition see [8]. In addition, there is a non exact coin- cidence of the period covered by these studies (Crop year for 1995/1996s and Fiscal year for 2006s censuses) there- fore the direct comparison between them must be t ake n as an approximation. All monetary results are presented at con stant value of 1996s Brazilian currency (Real) - R$ 1996. In 1996, the exchange rate between the US dollar (US$) and the Bra- zilian currency - real (R$) was approximately one. 2. The Family Farm (FF) and the Biodiesel Production The law No. 11 097, which establishes a minimum per- centage blend of biodiesel to mineral diesel suddenly created a market of approximately 800 million liters of biodiesel at attractive prices in 2006. This market was promptly answered by the major farmers and by the large installed capacity of soybean oil (1 359 510 m3/year in June/2007 [6]). However, one of the goals of the gov- ernment with the National Biodiesel Program was to help in eradicating poverty in rural areas with a program to cultivate other crops by FF to produce biodiesel to share 50% of the compulsory blend through the incentives coming from the creation of Selo Combustivel Social - social fuel seal, (Decree No. 5 297, Dec/06/2004). This seal aliviate federal tax for the industrial producers of biodiesel who acquire their raw material other than monoculture crop (typically associated with FF, like dendê palm fruit and castor bean) from FF. In addition, this seal gives also good financing conditions from fed- eral government institutio ns. However, despite th e effo rts of the government, this program has failed mainly due to the inability of FF to self adjust in time to the demands of this new market. The industry, although keen to benefit from the fuel seal, can not acquire sufficient raw materi- als for biodiesel production from FF producers. The fac- tors of such failure regarding FF producers can be briefly summarized: 1) High logistic and harvesting costs due to the micro pulverized produc t ion. 2) Low economies of scale compared with major agro entrepreneurs. 3) Lack of organizing into associations and coopera- tives. 4) Low education degree and lack of technical knowl- edge associated with traditionally archaic workers. 5) Low utilization of agricultural machinery, artificial irrigation and fertilizer. 6) Lack of access to financing due to bureaucracy. 7) Lack of competitive prices for the biodiesel com- pared with other crops production, mainly associ- ated with food production. Moreover, the castor oil has high viscosity and has good price on the market for lubricants. So the price offered by the biodiesel industry cannot compete with this market. However, as will be shown later by comparing th e ag- ricultural census data, the policy of combatin g poverty in rural areas was a great success especially in the North- east. The National Brazilian Biodiesel Program certainly could become a valuable additional tool in this regard mainly for North and Midwest regions since some identi- Copyright © 2011 SciRes. LCE 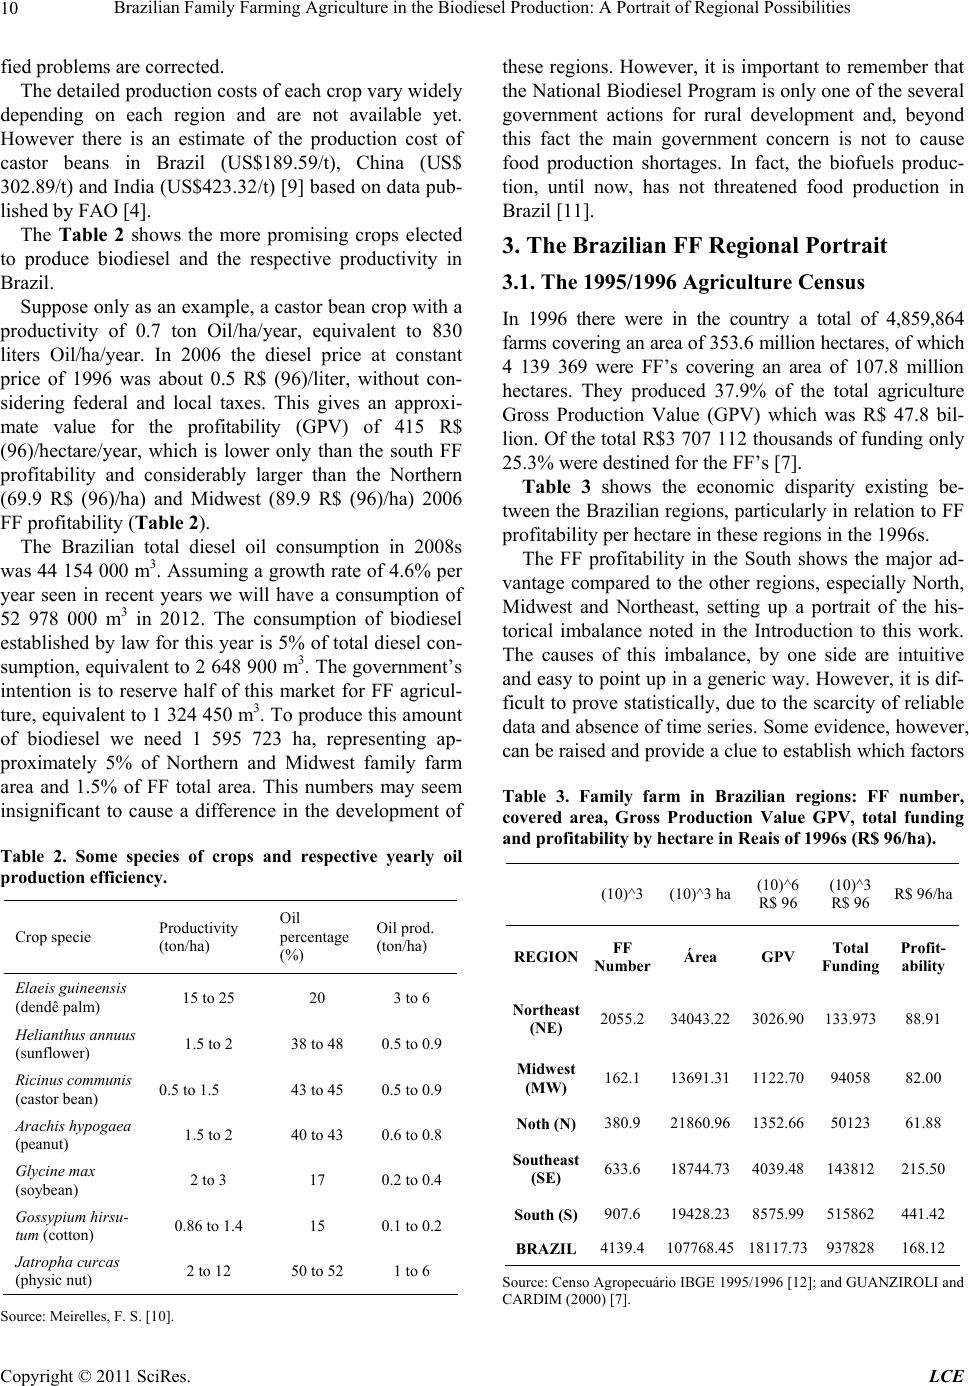 Brazilian Family Farming Agriculture in the Biodiesel Production: A Portrait of Regional Possibilities 10 fied problems are corrected. The detailed production costs of each crop vary widely depending on each region and are not available yet. However there is an estimate of the production cost of castor beans in Brazil (US$189.59/t), China (US$ 302.89/t) and India (US$423.32/t) [9] based on data pub- lished by F A O [4]. The Table 2 shows the more promising crops elected to produce biodiesel and the respective productivity in Brazil. Suppose only as an example, a castor bean crop with a productivity of 0.7 ton Oil/ha/year, equivalent to 830 liters Oil/ha/year. In 2006 the diesel price at constant price of 1996 was about 0.5 R$ (96)/liter, without con- sidering federal and local taxes. This gives an approxi- mate value for the profitability (GPV) of 415 R$ (96)/hectare/year, which is lower only than the south FF profitability and considerably larger than the Northern (69.9 R$ (96)/ha) and Midwest (89.9 R$ (96)/ha) 2006 FF profitability (Table 2). The Brazilian total diesel oil consumption in 2008s was 44 154 000 m3. Assuming a growth rate of 4.6% per year seen in recent years we will have a consumption of 52 978 000 m3 in 2012. The consumption of biodiesel established by law for this year is 5% of total diesel con- sumption, equivalent to 2 648 900 m3. The government’s intention is to reserve half of this market for FF agricul- ture, eq uivalent to 1 324 450 m3. To produce this amount of biodiesel we need 1 595 723 ha, representing ap- proximately 5% of Northern and Midwest family farm area and 1.5% of FF total area. This numbers may seem insignificant to cause a difference in the development of Table 2. Some species of crops and respective yearly oil production efficiency. Crop specie Productivity (ton/ha) Oil percentage (%) Oil prod. (ton/ha) Elaeis guineensis (dendê palm) 15 to 25 20 3 to 6 Helianthus annuus (sunflower) 1.5 to 2 38 to 48 0.5 to 0.9 Ricinus communis (castor bean) 0.5 to 1.5 43 to 45 0.5 to 0.9 Arachis hypogae a (peanut) 1.5 to 2 40 to 4 3 0.6 to 0.8 Glycine max (soybean) 2 to 3 17 0.2 to 0.4 Gossypium hirsu- tum (cotton) 0.86 to 1.4 15 0.1 to 0.2 Jatropha curcas (physic nut) 2 to 12 50 to 52 1 to 6 Source: Meirelles, F. S. [10] . these regions. However, it is important to remember that the National Biodiesel Program is only one of the several government actions for rural development and, beyond this fact the main government concern is not to cause food production shortages. In fact, the biofuels produc- tion, until now, has not threatened food production in Brazil [11]. 3. The Brazilian FF Regional Portrait 3.1. The 1995/1996 Agriculture Census In 1996 there were in the country a total of 4,859,864 farms covering an area of 353.6 million hectares, of which 4 139 369 were FF’s covering an area of 107.8 million hectares. They produced 37.9% of the total agriculture Gross Production Value (GPV) which was R$ 47.8 bil- lion. Of the total R$3 707 112 thousands of funding only 25.3% were destined for the FF’s [7]. Table 3 shows the economic disparity existing be- tween the Brazilian regions, particularly in relation to FF profitability per hectare in these regions in the 1996s. The FF profitability in the South shows the major ad- vantage compared to the other regions, especially North, Midwest and Northeast, setting up a portrait of the his- torical imbalance noted in the Introduction to this work. The causes of this imbalance, by one side are intuitive and easy to point up in a generic way. However, it is dif- ficult to prove statistically, due to the scarcity of reliable data and absence of time series. Some evidence, however, can be raised and provide a clue to estab lish which facto rs Table 3. Family farm in Brazilian regions: FF number, covered area, Gross Production Value GPV, total funding and profitability by hectare in Reais of 1996s (R$ 96/ha). (10)^3(10)^3 ha (10)^6 R$ 96 (10)^3 R$ 96 R$ 96/ha REGION FF Number Área GPV Total Funding Profit- ability Northeast (NE) 2055.234043.22 3026.90 133.97388.91 Midwest (MW) 162.1 13691.31 1122.70 94058 82.00 Noth (N)380.9 21860.96 1352.66 50123 61.88 Southeast (SE) 633.6 18744.73 4039.48 143812215.50 South (S)907.6 19428.23 8575.99 515862441.42 BRAZIL 4139.4107768.45 18117.73 937828168.12 Source: Censo Agrop ecuário IBGE 1 995/ 1996 [ 12]; and GUANZIRO LI and CARDIM (2000) [7]. Copyright © 2011 SciRes. LCE 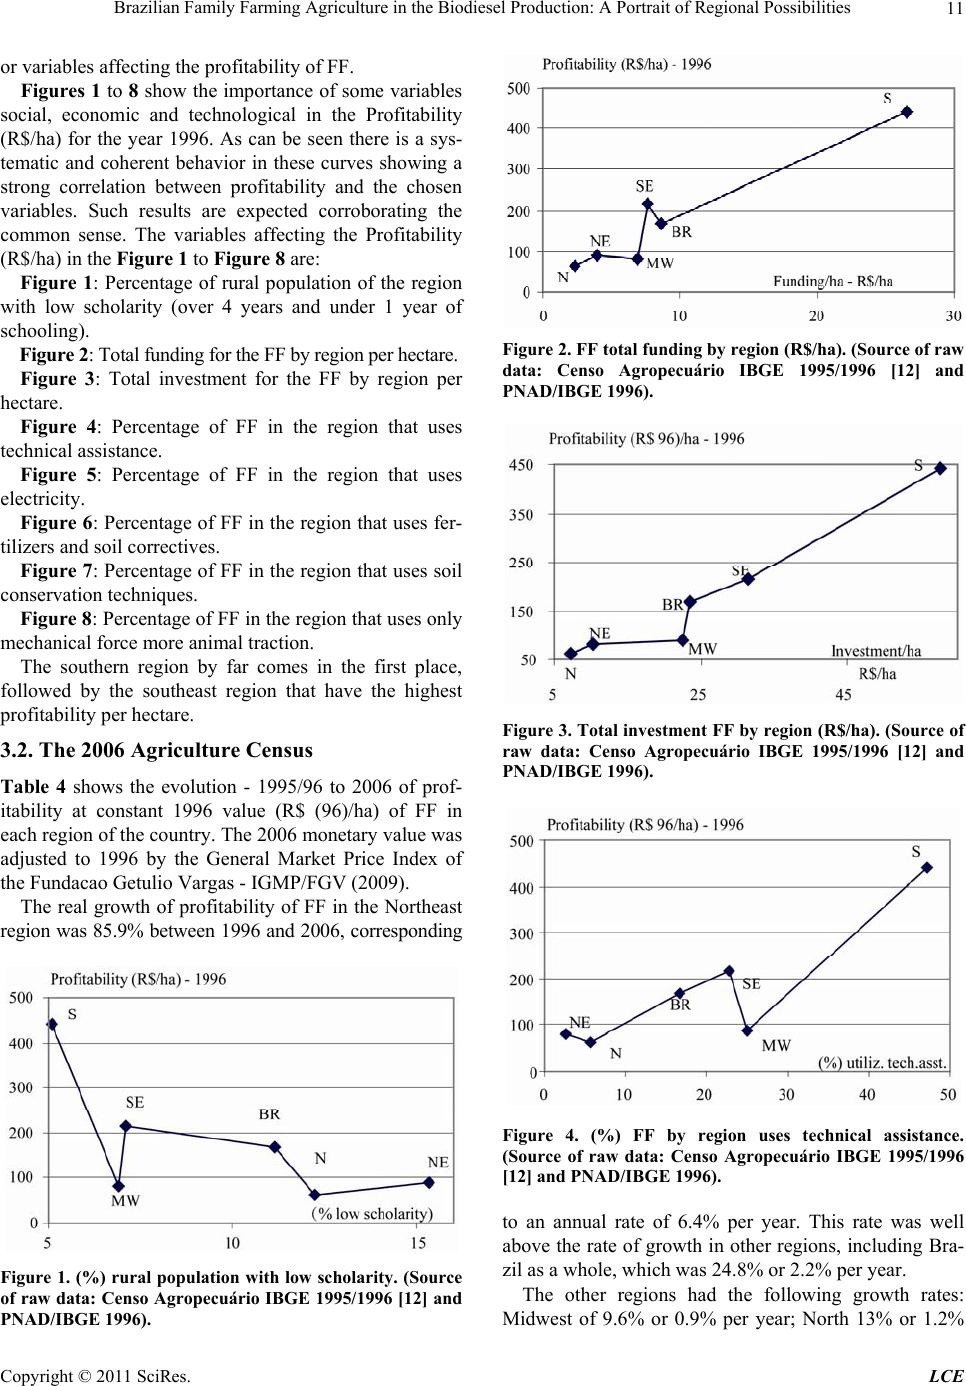 Brazilian Family Farming Agriculture in the Biodiesel Production: A Portrait of Regional Possibilities11 or variables affecting the profitability of FF. Figures 1 to 8 show the importance of so me variables social, economic and technological in the Profitability (R$/ha) for the year 1996. As can be seen there is a sys- tematic and coherent behavior in these curves showing a strong correlation between profitability and the chosen variables. Such results are expected corroborating the common sense. The variables affecting the Profitability (R$/ha) in the Figure 1 to Figure 8 are: Figure 1: Percentage of rural population of the region with low scholarity (over 4 years and under 1 year of schooling). Figure 2: Total funding for the FF by region per hectare. Figure 3: Total investment for the FF by region per hectare. Figure 4: Percentage of FF in the region that uses technical assistance. Figure 5: Percentage of FF in the region that uses electricity. Figure 6: Percentage of FF in th e region that uses fer- tilizers and soil correctives. Figure 7: Percentage of FF in the reg ion that uses soil conservation techniques. Figure 8: Percentage of FF in the region that uses only mechanical force more animal traction. The southern region by far comes in the first place, followed by the southeast region that have the highest profitability per hectare. 3.2. The 2006 Agriculture Census Table 4 shows the evolution - 1995/96 to 2006 of prof- itability at constant 1996 value (R$ (96)/ha) of FF in each region of the country. The 2006 monetary value was adjusted to 1996 by the General Market Price Index of the Fundacao Getulio Vargas - IGMP/FGV (2009). The real growth of profitability of FF in the Northeast region was 85.9% between 1996 and 2006, corresponding Figure 1. (%) rural population with low scholarity. (Source of raw data: Censo Agropecuário IBGE 1995/1996 [12] and PNAD/IBGE 1996). Figure 2. FF total funding by region (R$/ha). (Source of raw data: Censo Agropecuário IBGE 1995/1996 [12] and PNAD/IBGE 1996). Figure 3. Total investment FF by region (R$/ha). (Source of raw data: Censo Agropecuário IBGE 1995/1996 [12] and PNAD/IBGE 1996). Figure 4. (%) FF by region uses technical assistance. (Source of raw data: Censo Agropecuário IBGE 1995/1996 [12] and PNAD/IBGE 1996). to an annual rate of 6.4% per year. This rate was well above the rate of growth in other regions, including Bra- zil as a whole, which was 24.8% or 2.2% per year. The other regions had the following growth rates: Midwest of 9.6% or 0.9% per year; North 13% or 1.2% Copyright © 2011 SciRes. LCE 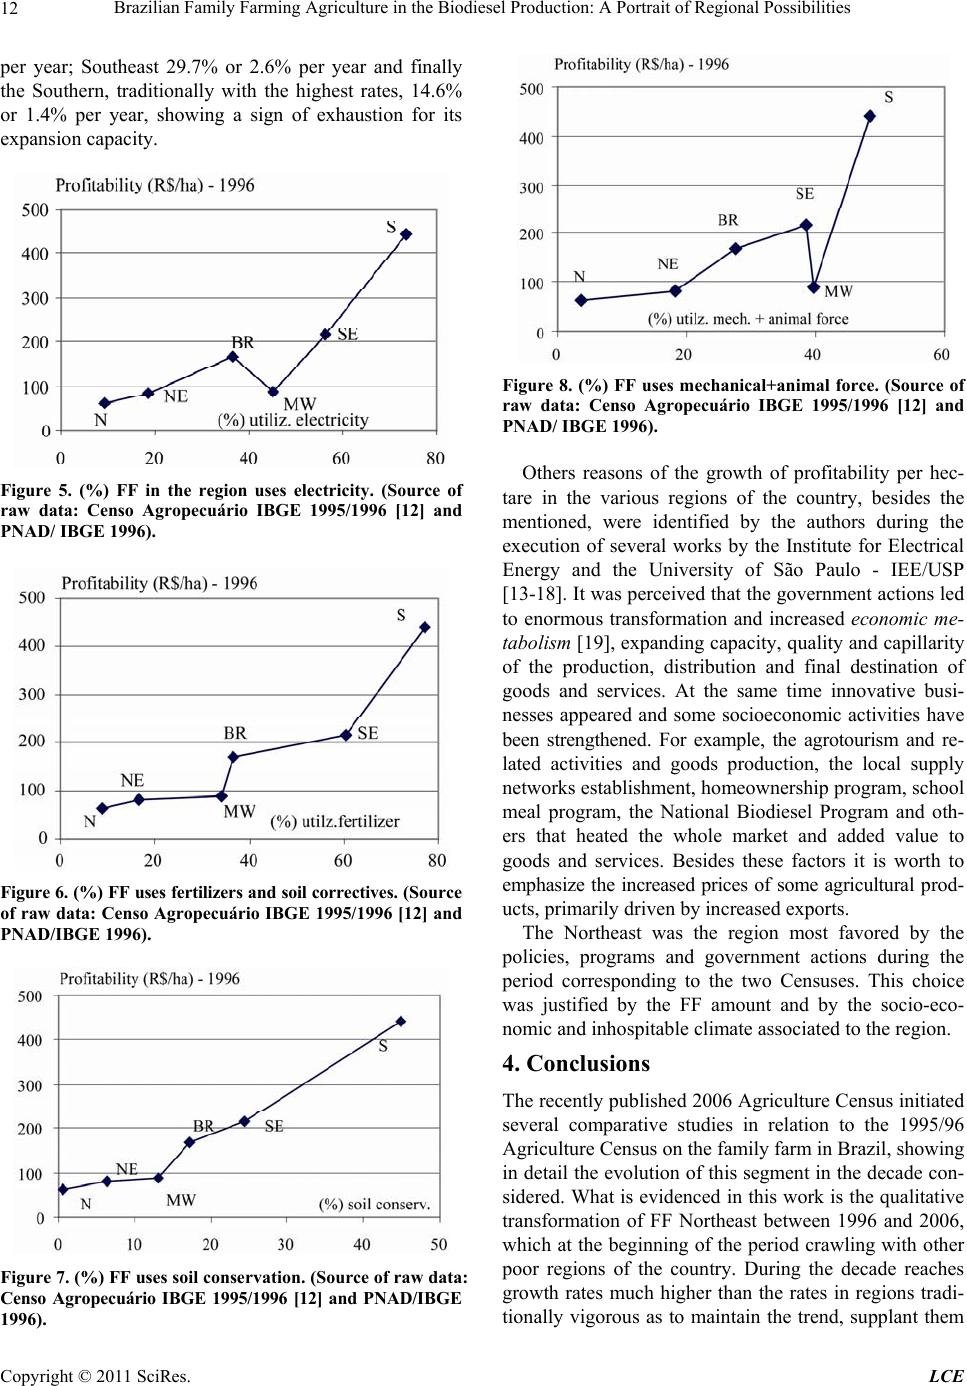 Brazilian Family Farming Agriculture in the Biodiesel Production: A Portrait of Regional Possibilities 12 per year; Southeast 29.7% or 2.6% per year and finally the Southern, traditionally with the highest rates, 14.6% or 1.4% per year, showing a sign of exhaustion for its expansion capacity. Figure 5. (%) FF in the region uses electricity. (Source of raw data: Censo Agropecuário IBGE 1995/1996 [12] and PNAD/ IBGE 1996). Figure 6. (%) FF uses fertilizers and soil correctives. (Source of raw data: Censo Agropecuário IBGE 1995/1996 [12] and PNAD/IBGE 1996). Figure 7. (%) FF uses soil conservation. (Source of raw data: Censo Agropecuário IBGE 1995/1996 [12] and PNAD/IBGE 1996). Figure 8. (%) FF uses mechanical+animal force. (Source of raw data: Censo Agropecuário IBGE 1995/1996 [12] and PNAD/ IBGE 1996). Others reasons of the growth of profitability per hec- tare in the various regions of the country, besides the mentioned, were identified by the authors during the execution of several works by the Institute for Electrical Energy and the University of São Paulo - IEE/USP [13-18]. It was perceived that the government actions led to enormous transformation and increased economic me- tabolism [19], expanding capacity, q uality and capillarity of the production, distribution and final destination of goods and services. At the same time innovative busi- nesses appeared and some socioeconomic activities have been strengthened. For example, the agrotourism and re- lated activities and goods production, the local supply networks establishment, homeownership program, school meal program, the National Biodiesel Program and oth- ers that heated the whole market and added value to goods and services. Besides these factors it is worth to emphasize the increased prices of some agricultural prod- ucts, primarily driven by increased exports. The Northeast was the region most favored by the policies, programs and government actions during the period corresponding to the two Censuses. This choice was justified by the FF amount and by the socio-eco- nomic and inhospitable climate associated to the region. 4. Conclusions The recently publish ed 2006 Agriculture Census initiated several comparative studies in relation to the 1995/96 Agriculture Census on the family farm in Brazil, showing in detail the evolu tion of this segment in the decade con- sidered. What is evidenced in th is work is the qualitative transformation of FF Northeast between 1996 and 2006, which at the beginning of the period crawling with other poor regions of the country. During the decade reaches growth rates much higher than the rates in regions tradi- tionally vigorous as to maintain the trend, supplant them Copyright © 2011 SciRes. LCE 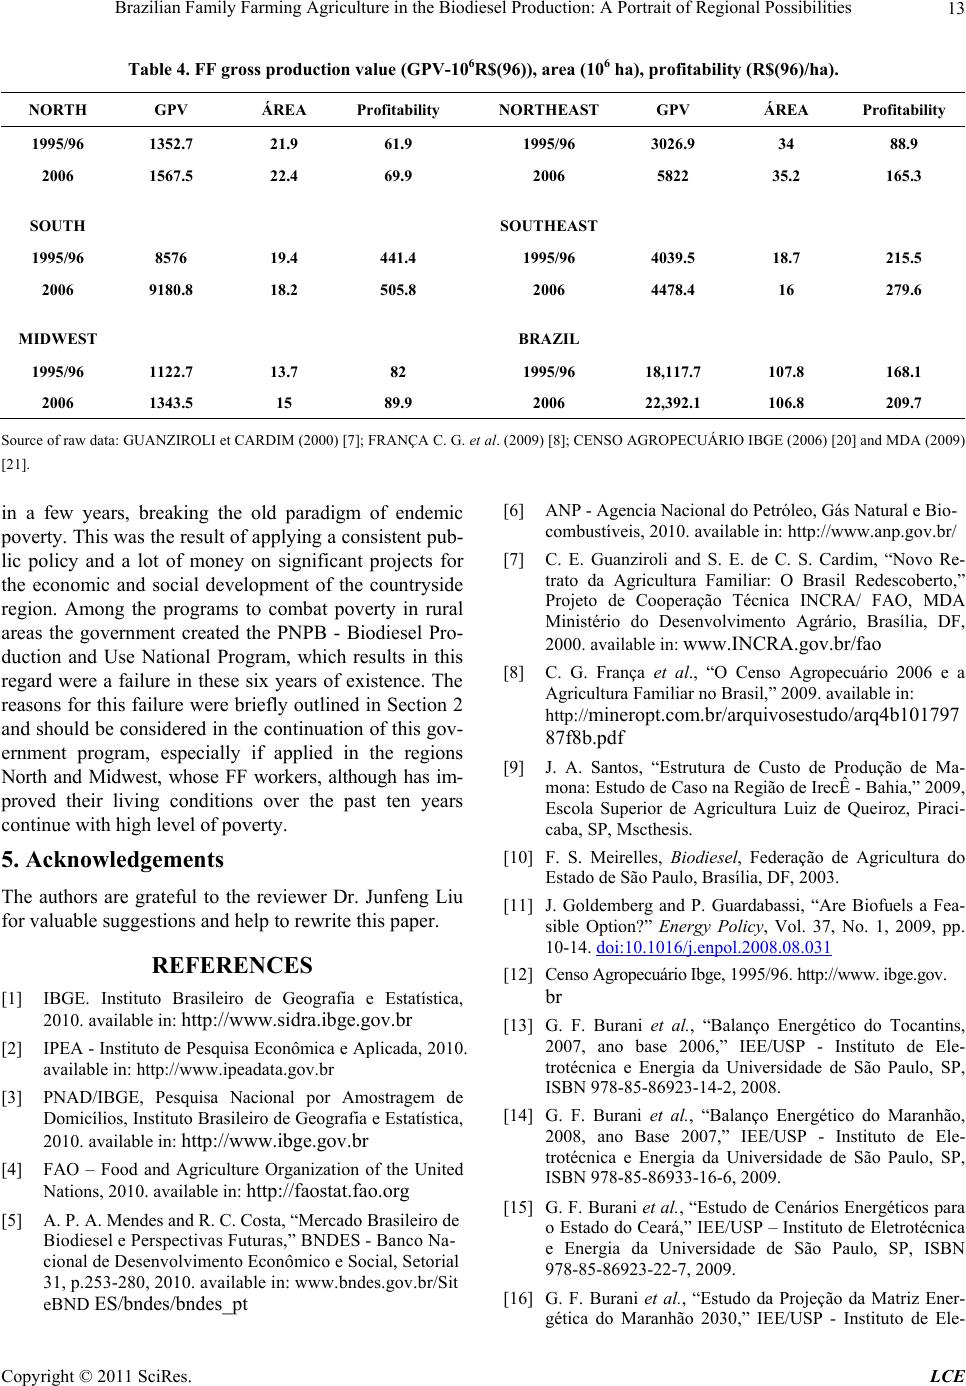 Brazilian Family Farming Agriculture in the Biodiesel Production: A Portrait of Regional Possibilities Copyright © 2011 SciRes. LCE 13 Table 4. FF gross production value (GPV-106R$(96)), area (106 ha), profitability (R$(96)/ha). NORTH GPV ÁREA ProfitabilityNORTHEAST GPV ÁREA Profitability 1995/96 1352.7 21.9 61.9 1995/96 3026.9 34 88.9 2006 1567.5 22.4 69.9 2006 5822 35.2 165.3 SOUTH SOUTHEAST 1995/96 8576 19.4 441.4 1995/96 4039.5 18.7 215.5 2006 9180.8 18.2 505.8 2006 4478.4 16 279.6 MIDWEST BRAZIL 1995/96 1122.7 13.7 82 1995/96 18,117.7 107.8 168.1 2006 1343.5 15 89.9 2006 22,392.1 106.8 209.7 Source of raw data: GUANZIROLI et CARDIM (2000) [7]; FRANÇA C. G. et al. (2009) [8]; CENSO AGROPECUÁRIO IBGE (2006) [20] and MDA (2009) [21]. in a few years, breaking the old paradigm of endemic poverty. This was the result of applying a consistent pub- lic policy and a lot of money on significant projects for the economic and social development of the countryside region. Among the programs to combat poverty in rural areas the government created the PNPB - Biodiesel Pro- duction and Use National Program, which results in this regard were a failure in these six years of existence. The reasons for this failure were briefly outlined in Section 2 and should be considered in the continuation of this gov- ernment program, especially if applied in the regions North and Midwest, whose FF workers, although has im- proved their living conditions over the past ten years continue wit h hi g h level o f p overty. 5. Acknowledgements The authors are grateful to the reviewer Dr. Junfeng Liu for valuable s u ggestions and help t o rew ri t e t hi s pa per . REFERENCES [1] IBGE. Instituto Brasileiro de Geografia e Estatística, 2010. available in: http://www.sidra.ibge.gov.br [2] IPEA - Instituto de Pesquisa Econômica e Aplicada, 2010. available in: http://www.ipeadata.gov. b r [3] PNAD/IBGE, Pesquisa Nacional por Amostragem de Domicílios, Instituto Brasileiro de Geografia e Estatística, 2010. available in: http://www.ibge.gov.br [4] FAO – Food and Agriculture Organization of the United Nations, 2010. available in: http://faostat.fao.org [5] A. P. A. Mendes and R. C. Costa, “Mercado Brasileiro de Biodiesel e Perspect iva s Fut uras,” BNDES - Banc o Na- cional de Desenvolvimento Econômico e Social, Setorial 31, p.253-280, 2010. available in: www.bndes.gov.br/Sit eBND ES/bndes/bndes_pt [6] ANP - Agencia Nacional do Petróleo, Gás Natural e Bio- combustíveis, 2010. available in: http://www.anp.gov.br/ [7] C. E. Guanziroli and S. E. de C. S. Cardim, “Novo Re- trato da Agricultura Familiar: O Brasil Redescoberto,” Projeto de Cooperação Técnica INCRA/ FAO, MDA Ministério do Desenvolvimento Agrário, Brasília, DF, 2000. available in: www.INCRA.gov.br/fao [8] C. G. França et al., “O Censo Agropecuário 2006 e a Agricultura Familiar no Brasil,” 2009. available in: http://mineropt.com.br/arquivosestudo/arq4b101797 87f8b.pdf [9] J. A. Santos, “Estrutura de Custo de Produção de Ma- mona: Estudo de Caso na Região de IrecÊ - Bahia,” 2009, Escola Superior de Agricultura Luiz de Queiroz, Piraci- caba, SP, Mscthesis. [10] F. S. Meirelles, Biodiesel, Federação de Agricultura do Estado de São Paulo, Brasília, DF, 2003. [11] J. Goldemberg and P. Guardabassi, “Are Biofuels a Fea- sible Option?” Energy Policy, Vol. 37, No. 1, 2009, pp. 10-14. doi:10.1016/j.enpol.2008.08.031 [12] Ce n s o A g r o p e c u á r i o I b g e , 1995/96. h t tp: / / w w w . i b g e . g o v . br [13] G. F. Burani et al., “Balanço Energético do Tocantins, 2007, ano base 2006,” IEE/USP - Instituto de Ele- trotécnica e Energia da Universidade de São Paulo, SP, ISBN 978-85-86923-14-2, 2008. [14] G. F. Burani et al., “Balanço Energético do Maranhão, 2008, ano Base 2007,” IEE/USP - Instituto de Ele- trotécnica e Energia da Universidade de São Paulo, SP, ISBN 978-85-86933-16-6, 2009. [15] G. F. Burani et al., “Estudo de Cenários Energéticos para o Estado do Ceará,” IEE/USP – Instituto de Eletrotécnica e Energia da Universidade de São Paulo, SP, ISBN 978-85-86923-22-7, 2009. [16] G. F. Burani et al., “Estudo da Projeção da Matriz Ener- gética do Maranhão 2030,” IEE/USP - Instituto de Ele- 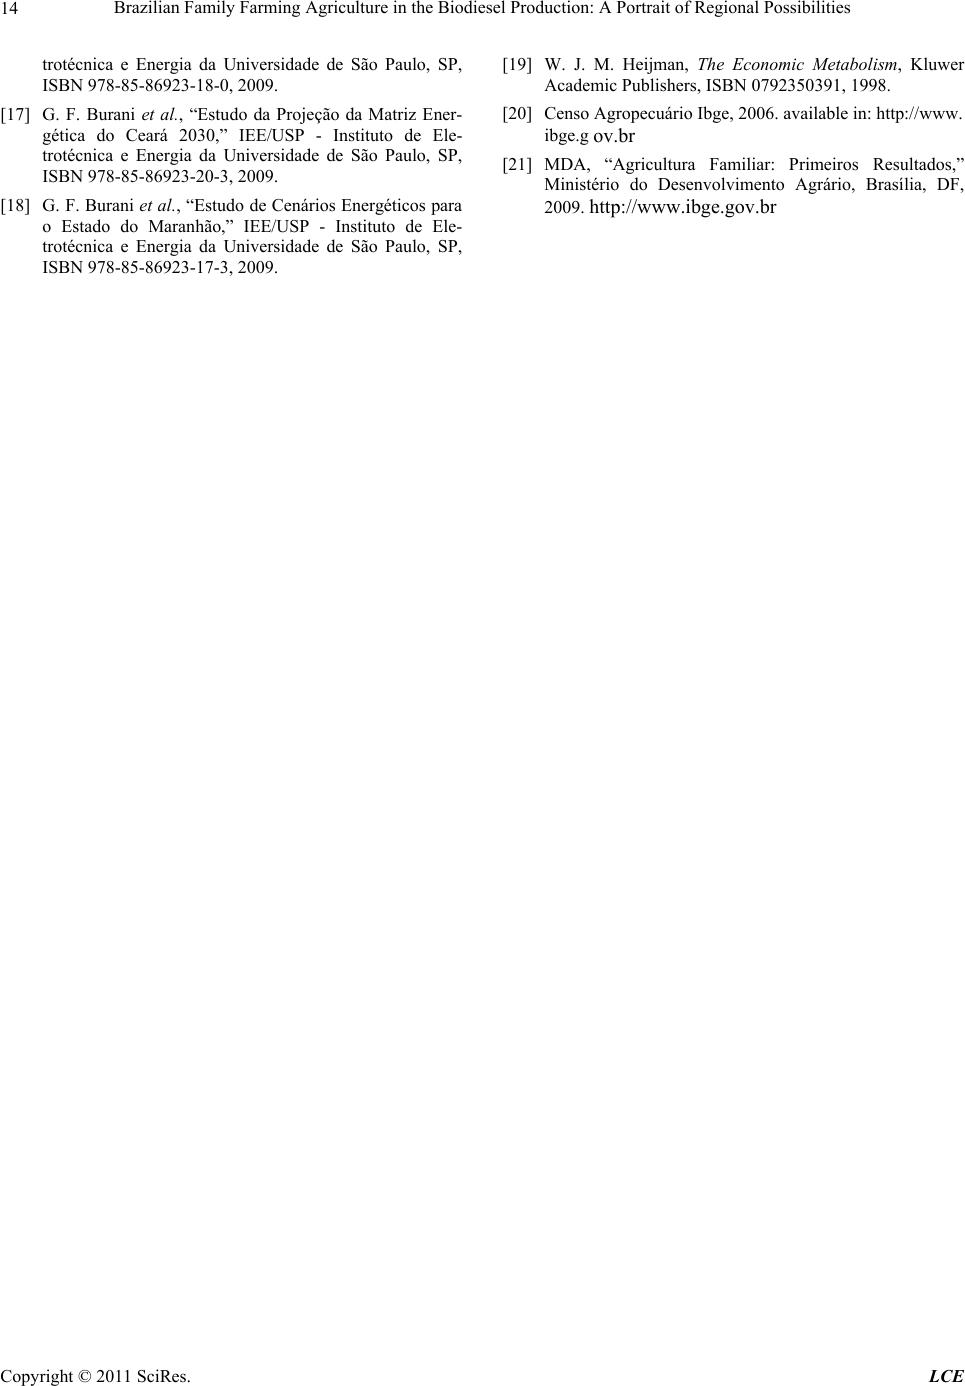 Brazilian Family Farming Agriculture in the Biodiesel Production: A Portrait of Regional Possibilities 14 trotécnica e Energia da Universidade de São Paulo, SP, ISBN 978-85-86923-18-0, 2009. [17] G. F. Burani et al., “Estudo da Projeção da Matriz Ener- gética do Ceará 2030,” IEE/USP - Instituto de Ele- trotécnica e Energia da Universidade de São Paulo, SP, ISBN 978-85-86923-20-3, 2009. [18] G. F. Burani et al., “Estudo de Cenários Energéticos para o Estado do Maranhão,” IEE/USP - Instituto de Ele- trotécnica e Energia da Universidade de São Paulo, SP, ISBN 978-85-86923-17-3, 2009. [19] W. J. M. Heijman, The Economic Metabolism, Kluwer Academic Publishers, ISBN 0792350391, 1998. [20] Censo Agropecuário Ibge, 2006. available in: h t t p://www. ibge.g ov.br [21] MDA, “Agricultura Familiar: Primeiros Resultados,” Ministério do Desenvolvimento Agrário, Brasília, DF, 2009. http://www.ibge.gov.br Copyright © 2011 SciRes. LCE |