

Paper Menu >>
Journal Menu >>
 Intelligent Information Ma nagement, 2011, 3, 56-63 doi:10.4236/iim.2011.32007 Published Online March 2011 (http://www.SciRP.org/journal/iim) Copyright © 2011 SciRes. IIM The BP-M* Methodology for Process Analysis in the Health Sector Antonio Di Leva, Salvatore Femiano Dipartimento di Informatica, Università di Torino, Tori no, Italy E-mail: dileva/[email protected] Received January 12, 2011; revised January 28, 2011; accepted Marc h 1, 2011 Abstract In this paper we present the main phases of the BP-M* methodology and its application to a care pathway for patients in the Oncology Division of a large hospital, to evaluate pros and cons of different drug administra- tion modalities and the impact of these modalities to the organizational process. BP-M* has been developed for the manufacturing sector but the relevance of business modeling, analysis and reorganization is not re- stricted to a specific sector. The aim of this work is to show its application to a real life study of a complex process in the health sector. Keywords: Methodology for Business Process Analysis, Process Simulation and Reengineering, Care Path- way 1. Introduction This paper presents a methodology, called BP-M* (Busi- ness Process Methodology*), which is a practical approach for the modeling, the quantitative analysis and the reengi- neering of business processes. It will be illustrated by means of the patient’ s care pathway in the Oncolog y Divi- sion of the largest hospital in Torino (Italy), the Azienda Ospedaliera San Giovanni Battista. The management of an integrated care department in modern hospitals is not a simple task. Managers have to: • develop care pathwa ys, • identify participants and roles in the care process, • streamline activities, follow progress and respond to actions and events along the care pathways, • evaluate efficiency and effectiveness of the care process. For an Oncology Division, the relevant process is the chemotherapy administration. Chemotherapy is the use of extremely powerful drugs to destroy cancer cells; therefore it requires a very careful monitoring of patient conditions during drug infusion. The overall process is very complex and requires coordination among several doctors, nurses, pharmacists, laboratory and clerical per- sonnel, and the patient. Therefore we need methods that allow a precise defi- nition of the patient care process and provide qualitative and quantitative information about the process, e.g. [1,2]: • the optimal type and number of resources (staff, rooms, beds, etc.), • existing anomalies in the process (such as bottle- necks, long waiting times,…), • suggestions to improve efficiency, i.e., how to use resources in a better way, how to decrease patient length of stay in the department (cycle time), • type of pro blems if something ne w happens (e.g. t he workload increases). In the literature, there is a strong support for the analysis and reengineering of healthcare organizations. Enterprise methodologies originally developed for manu- facturing processes are now used to improve the opera- tions and competitiveness of hospitals [3,4]. Both qualitative (e.g. SWOT - Strengths, Weaknesses, Opportunities and Threats) and quan titative (e.g. process evaluation based on discrete event simulation) analysis have been exploited in real life applications [5,6,7]. This paper is structured as follows. The second section presents the BP-M* methodology. The third section il- lustrates the case study, which aims to improve the effi- ciency and to optimize the resources management of the target organization. Finally the fourth section presents some preliminary conclusions of our analysis. 2. The BP-M* Methodology BP-M* is based on M*-COMPLEX, a general-purpose 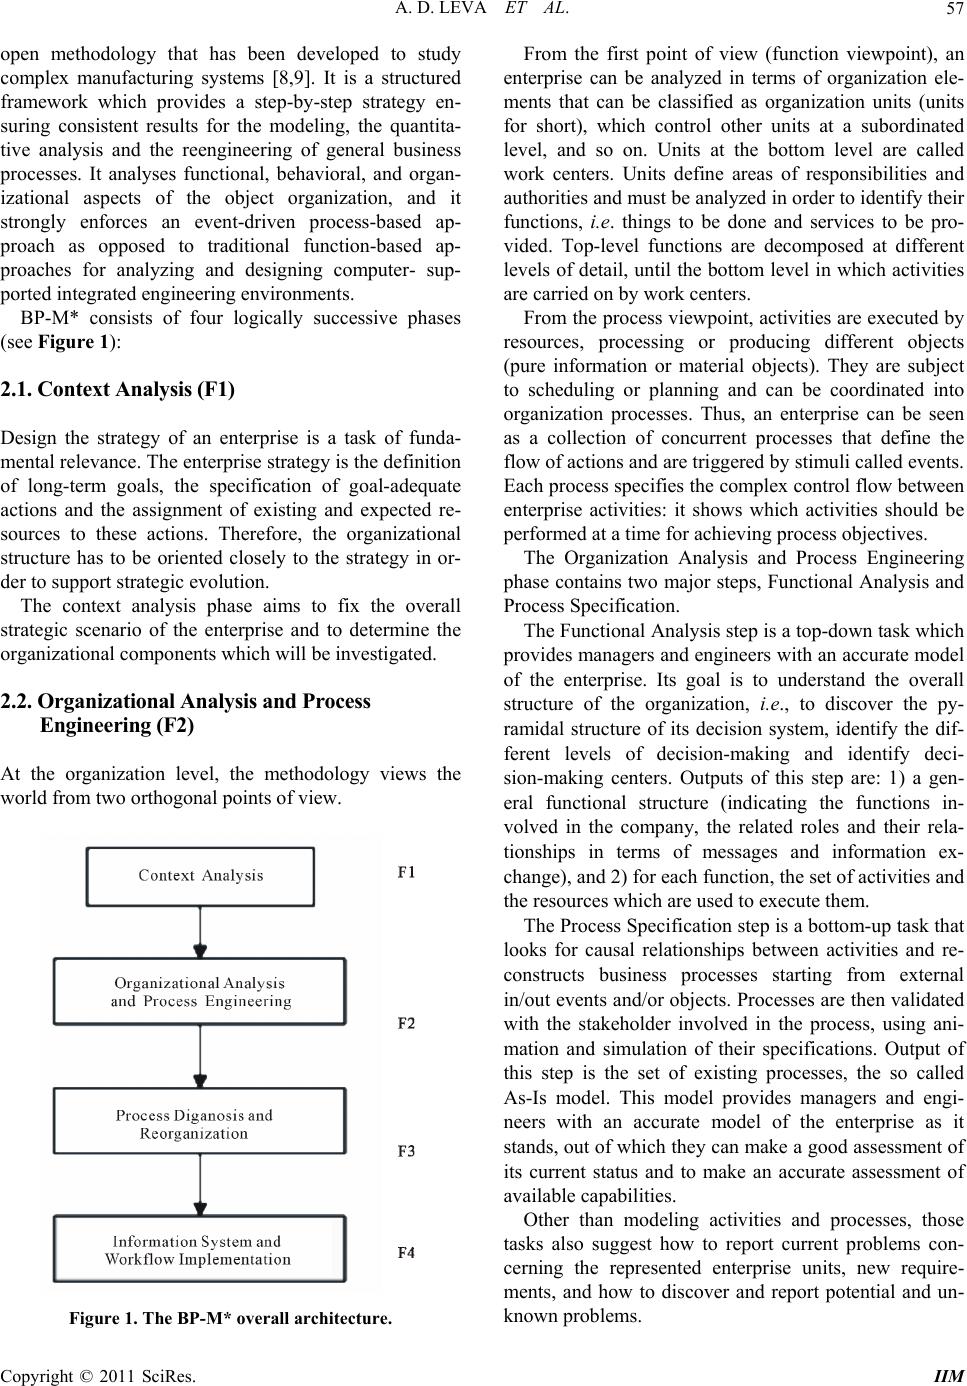 A. D. LEVA ET AL.57 open methodology that has been developed to study complex manufacturing systems [8,9]. It is a structured framework which provides a step-by-step strategy en- suring consistent results for the modeling, the quantita- tive analysis and the reengineering of general business processes. It analyses functional, behavioral, and organ- izational aspects of the object organization, and it strongly enforces an event-driven process-based ap- proach as opposed to traditional function-based ap- proaches for analyzing and designing computer- sup- ported integrated engineering environments. BP-M* consists of four logically successive phases (see Figure 1): 2.1. Context Analysis (F1) Design the strategy of an enterprise is a task of funda- mental relevance. The enterprise strateg y is the definition of long-term goals, the specification of goal-adequate actions and the assignment of existing and expected re- sources to these actions. Therefore, the organizational structure has to be oriented closely to the strategy in or- der to support strategic evolution. The context analysis phase aims to fix the overall strategic scenario of the enterprise and to determine the organizational compone nts which will be investigated. 2.2. Organizational Analysis and Process Engineer ing (F 2) At the organization level, the methodology views the world from two orthog onal p oints of view. Figure 1. The BP-M* overall architecture. From the first point of view (function viewpoint), an enterprise can be analyzed in terms of organization ele- ments that can be classified as organization units (units for short), which control other units at a subordinated level, and so on. Units at the bottom level are called work centers. Units define areas of responsibilities and authorities and must be analyzed in order to identify th eir functions, i.e. things to be done and services to be pro- vided. Top-level functions are decomposed at different levels of detail, until the bottom level in which activities are carried on by work centers. From the process viewpoint, activities are executed by resources, processing or producing different objects (pure information or material objects). They are subject to scheduling or planning and can be coordinated into organization processes. Thus, an enterprise can be seen as a collection of concurrent processes that define the flow of actions and are triggered by stimuli called events. Each process specifies the complex control flow between enterprise activities: it shows which activities should be performed at a time for achieving process objectives. The Organization Analysis and Process Engineering phase contains two major steps, Functional Analysis and Process Specification. The Functional Analysis step is a top-down task which provides managers and engineers with an accurate model of the enterprise. Its goal is to understand the overall structure of the organization, i.e., to discover the py- ramidal structure of its decision system, identify the dif- ferent levels of decision-making and identify deci- sion-making centers. Outputs of this step are: 1) a gen- eral functional structure (indicating the functions in- volved in the company, the related roles and their rela- tionships in terms of messages and information ex- change), and 2) for each function, the set of activities and the resources which are used to execute them. The Process Specification step is a bottom-up task that looks for causal relationships between activities and re- constructs business processes starting from external in/out events and/or objects. Processes are then validated with the stakeholder involved in the process, using ani- mation and simulation of their specifications. Output of this step is the set of existing processes, the so called As-Is model. This model provides managers and engi- neers with an accurate model of the enterprise as it stands, out of which they can make a good assessment of its current status and to make an accurate assessment of available capabilities. Other than modeling activities and processes, those tasks also suggest how to report current problems con- cerning the represented enterprise units, new require- ments, and how to discover and report potential and un- known problems. Copyright © 2011 SciRes. IIM 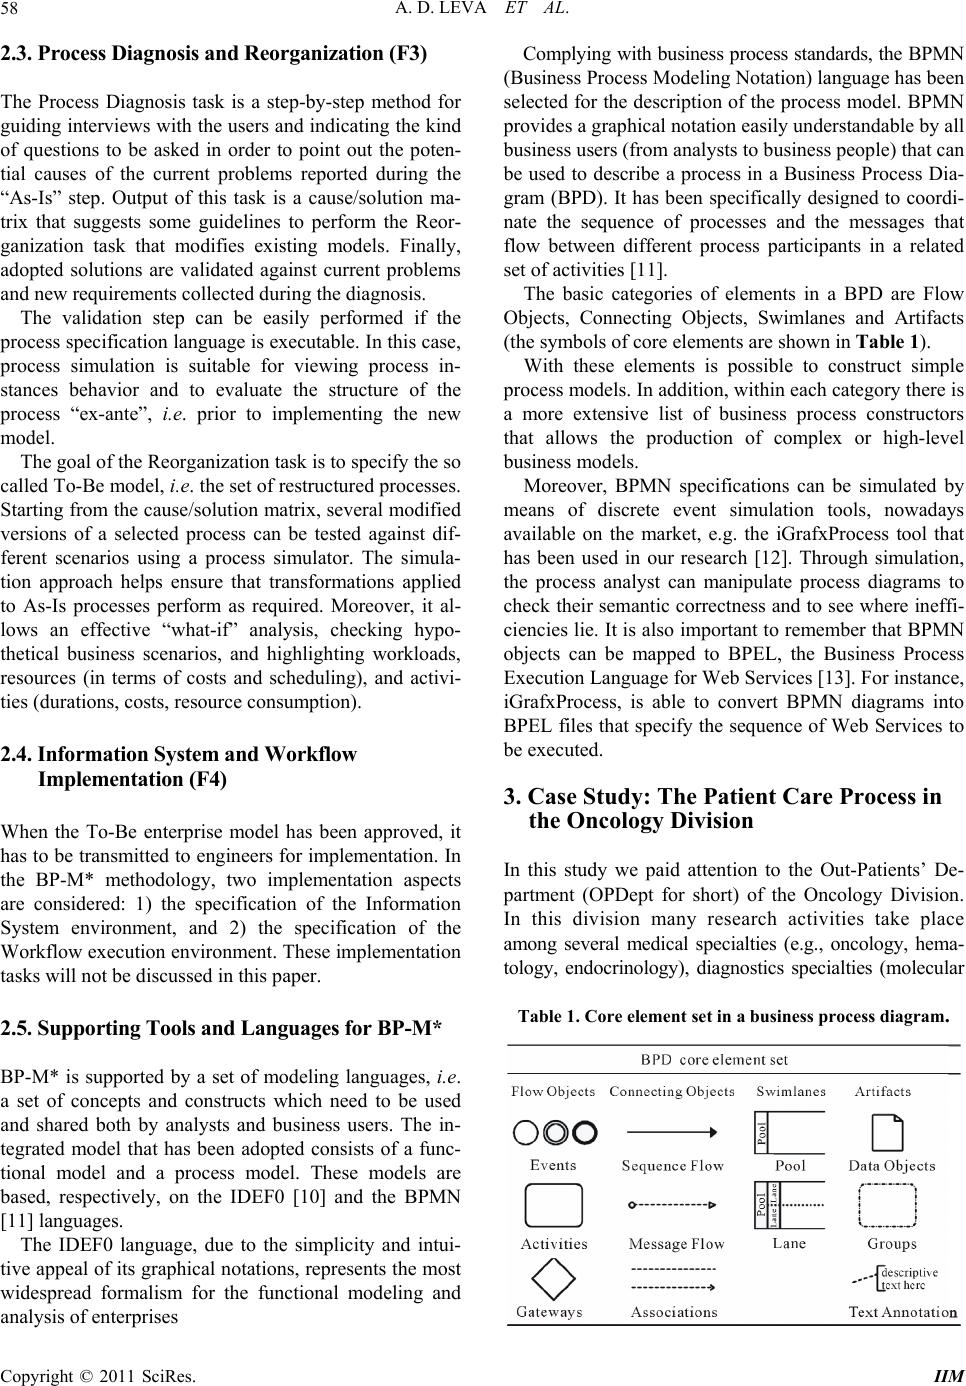 A. D. LEVA ET AL. 58 2.3. Pr ocess D i agn osis a nd Re or ga nizat i on (F 3) The Process Diagnosis task is a step-by-step method for guiding interviews with the users and indicating the kind of questions to be asked in order to point out the poten- tial causes of the current problems reported during the “As-Is” step. Output of this task is a cause/solution ma- trix that suggests some guidelines to perform the Reor- ganization task that modifies existing models. Finally, adopted solutions are validated against current problems and new requirements collected during the diagnosis. The validation step can be easily performed if the process specification language is executable. In this case, process simulation is suitable for viewing process in- stances behavior and to evaluate the structure of the process “ex-ante”, i.e. prior to implementing the new model. The goal of the Reorganization task is to specify the so called To-Be model, i.e. the set of restructured processes. Starting from the cause/solution matrix, several modified versions of a selected process can be tested against dif- ferent scenarios using a process simulator. The simula- tion approach helps ensure that transformations applied to As-Is processes perform as required. Moreover, it al- lows an effective “what-if” analysis, checking hypo- thetical business scenarios, and highlighting workloads, resources (in terms of costs and scheduling), and activi- ties (durations, costs, resource consumption). 2.4. Information System and Workflow Implementation (F4) When the To-Be enterprise model has been approved, it has to be transmitted to engineers for implementation. In the BP-M* methodology, two implementation aspects are considered: 1) the specification of the Information System environment, and 2) the specification of the Workflow execution environmen t. These implementation tasks will not be discussed in this paper. 2.5. Supporting Tools and Languages for BP-M* BP-M* is supported by a set of modeling languages, i.e. a set of concepts and constructs which need to be used and shared both by analysts and business users. The in- tegrated model that has been adopted consists of a func- tional model and a process model. These models are based, respectively, on the IDEF0 [10] and the BPMN [11] languages. The IDEF0 language, due to the simplicity and intui- tive appeal of its graphical notations, represents the most widespread formalism for the functional modeling and analysis of enterprises Complying with business process standards, the BPMN (Business Process Modeling Notation) language has been selected for the description of the process model. BPMN provides a graphical notation easily understandable by all business users (from analysts to business people) that can be used to describe a process in a Business Process Dia- gram (BPD). It has been specifically designed to coordi- nate the sequence of processes and the messages that flow between different process participants in a related set of activities [11]. The basic categories of elements in a BPD are Flow Objects, Connecting Objects, Swimlanes and Artifacts (the symbols of core elements are shown in Table 1). With these elements is possible to construct simple process models. In addition, within each category there is a more extensive list of business process constructors that allows the production of complex or high-level business models. Moreover, BPMN specifications can be simulated by means of discrete event simulation tools, nowadays available on the market, e.g. the iGrafxProcess tool that has been used in our research [12]. Through simulation, the process analyst can manipulate process diagrams to check their semantic correctness and to se e where ineffi - ciencies lie. It is also important to remember that BPMN objects can be mapped to BPEL, the Business Process Execution La n guage for Web Service s [ 13]. For instance , iGrafxProcess, is able to convert BPMN diagrams into BPEL files that specify the sequence of Web Services to be executed. 3. Case Study: The Patient Care Process in the Oncology Division In this study we paid attention to the Out-Patients’ De- partment (OPDept for short) of the Oncology Division. In this division many research activities take place among several medical specialties (e.g., oncology, hema- tology, endocrinology), diagnostics specialties (molecular Table 1. Core element set in a business process diagram. Copyright © 2011 SciRes. IIM 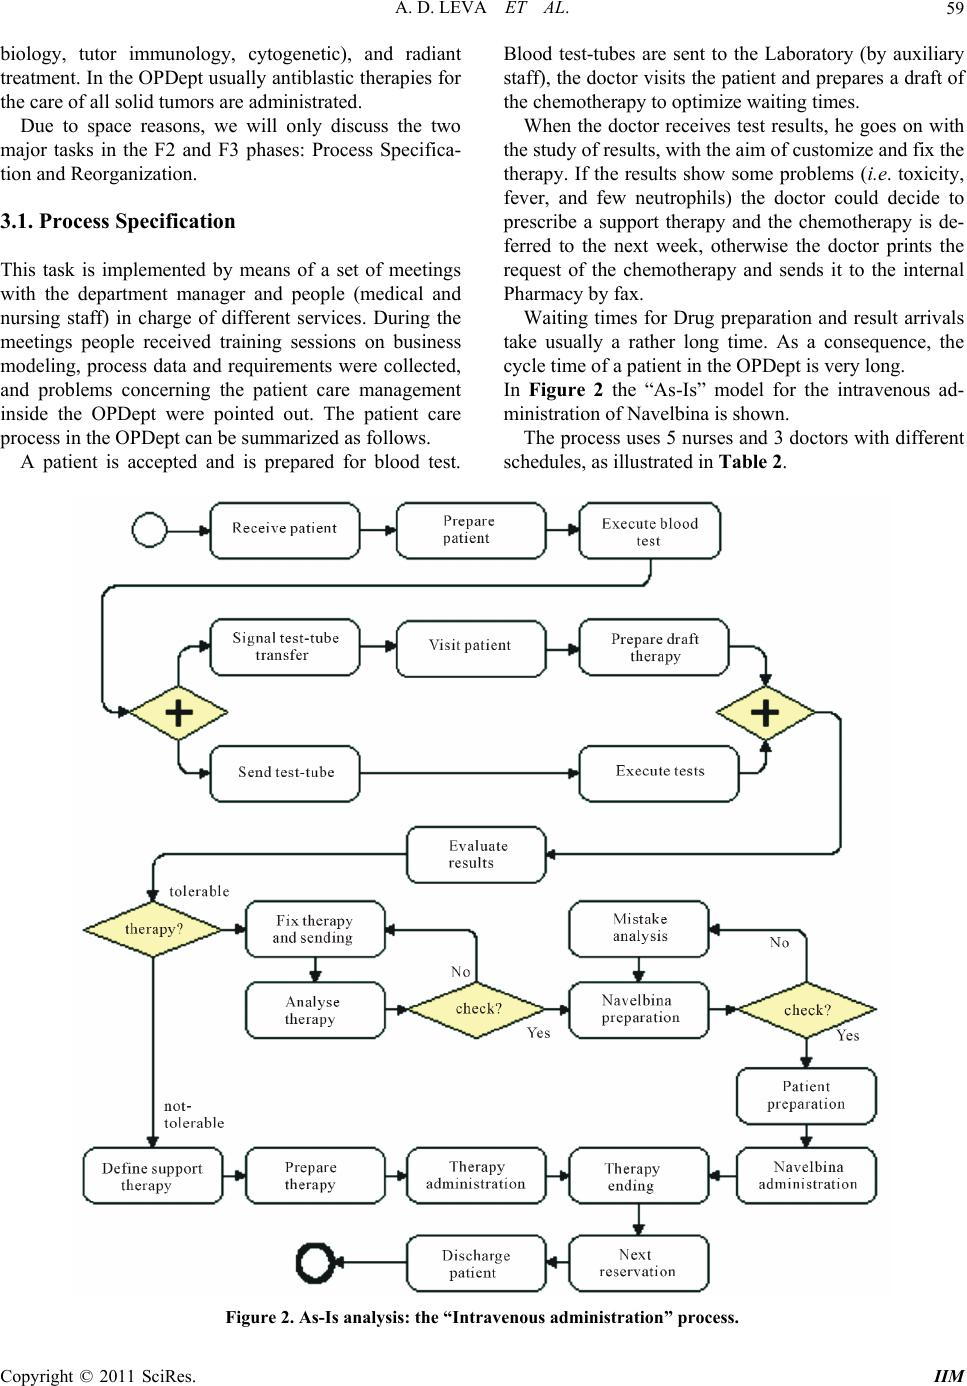 A. D. LEVA ET AL. Copyright © 2011 SciRes. IIM 59 biology, tutor immunology, cytogenetic), and radiant treatment. In the OPDept usually antiblastic therapies for the care of all solid tumors are administrated. Due to space reasons, we will only discuss the two major tasks in the F2 and F3 phases: Process Specifica- tion and Reorgan ization. 3.1. Process Specification This task is implemented by means of a set of meetings with the department manager and people (medical and nursing staff) in charge of different services. During the meetings people received training sessions on business modeling, process data and requirements were collected, and problems concerning the patient care management inside the OPDept were pointed out. The patient care process in the OPDept can be summarized as follows. A patient is accepted and is prepared for blood test. Blood test-tubes are sent to the Laboratory (by auxiliary staff), the doctor visits the patient and prepares a draft of the chemotherapy to optimize waiting times. When the doctor receives test results, he goes on with the study of results, with the aim of customize and fix the therapy. If the results show some problems (i.e. toxicity, fever, and few neutrophils) the doctor could decide to prescribe a support therapy and the chemotherapy is de- ferred to the next week, otherwise the doctor prints the request of the chemotherapy and sends it to the internal Pharmacy by fax. Waiting times for Drug preparation and result arrivals take usually a rather long time. As a consequence, the cycle time of a patient in the OPDept is very long. In Figure 2 the “As-Is” model for the intravenous ad- ministration of Navelbina is shown. The process uses 5 nurses and 3 doctors with different schedules, as illustrated in Table 2. Figure 2. As-Is analysis: the “Intravenous administration” process.  A. D. LEVA ET AL. Copyright © 2011 SciRes. IIM 60 Table 2. – Resources. Resource n.of Schedule Doctor 1 from 8 am. to 3 pm. Doctor 2 from 9.15 am. to 4.30 pm. Nurse 2 from 8 am. to 3 pm. Nurse 2 from 8.30 am. to 4.30 pm. Nurse 1 from 3 am. to 11 pm. After the As-Is process was modeled, we prepared an observation chart where, for patients that used the Navelbina drug, times related to all activities of the process were collected for several weeks in different situa tio ns . For each activity, starting, ending and arrival time of patients, sending fax time, and results and drugs arrival times have been measured. A normal distribution has been used in the event that the Kolmogorov-Smirnov & Shapiro-Wilk test returns positive values. Otherwise, a triangular distribution based on min, max, and mode values of the sample has been selected. Results of this analysis are displayed in Table 3. By means of simulation of the “As-Is” process, it is possible to obtain some key performance indicators as cycle time (range of time that a patient spends in the OPDept) and resource utilization of the more critical resources (doctors and nurses). In our case, the fol- lowing results have been obtained: Resource utilization doctor: 57% nurse: 53% Cycle time 205 minutes Table 3. Resources and duration of activities. Activity name Resources Time (min) Receiv e p at ien t 1 nurse UnifDist(1;2) Prepare patient (blood test preparation) 1 nurse TriangleDist(35;41;38) Execute blood test 1 nurse UnifDist(2;3) Signal test-tube transfer 1 nurse UnifDist(1;3) Visit patient 1 doctor TriangleDist(5;8;7) Prepare draft therapy 1 doctor UnifDist(5;7) Send tes t-tub e (s end test-tu be to Laboratory) Staff UnifDist(26;35) Execute tests Labora to ry TriangleDist(37;63;47) Evaluate results (evaluation of exams and patient examination) 1 doctor UnifDist(3;5) Define support therapy 1 doctor TriangleDist(3;7;5) Prepare therapy (prepare support therapy) 1 nurse TriangleDist(2;5;3) Therapy administration 1 nurse TriangleDist(10;20;12) Therapy ending 1 nurse TriangleDist(3;5;4) Fix therapy and sending (the therapy is fixed and then will be sent by fax to the Pharmacy) 1 doctor UnifDist(7;12) Analyze therapy Pharmacy UnifDist(4;7) Navelbina pr ep aration Pharmacy NormDist(52;14) Mistake analysis (the doctor settles any problems in the drug preparation) 1 doctor TriangleDist(5;7;6) Patient preparation 1 nurse TriangleDist(2;5;3) Navelbina administration 1 nurse UnifDist(10;15) Therapy ending 1 nurse TriangleDist(3;5;4) Next reservation 1 doctor UnifDist(3;5) Discharge patient 1 nurse UnifDist(6;8) 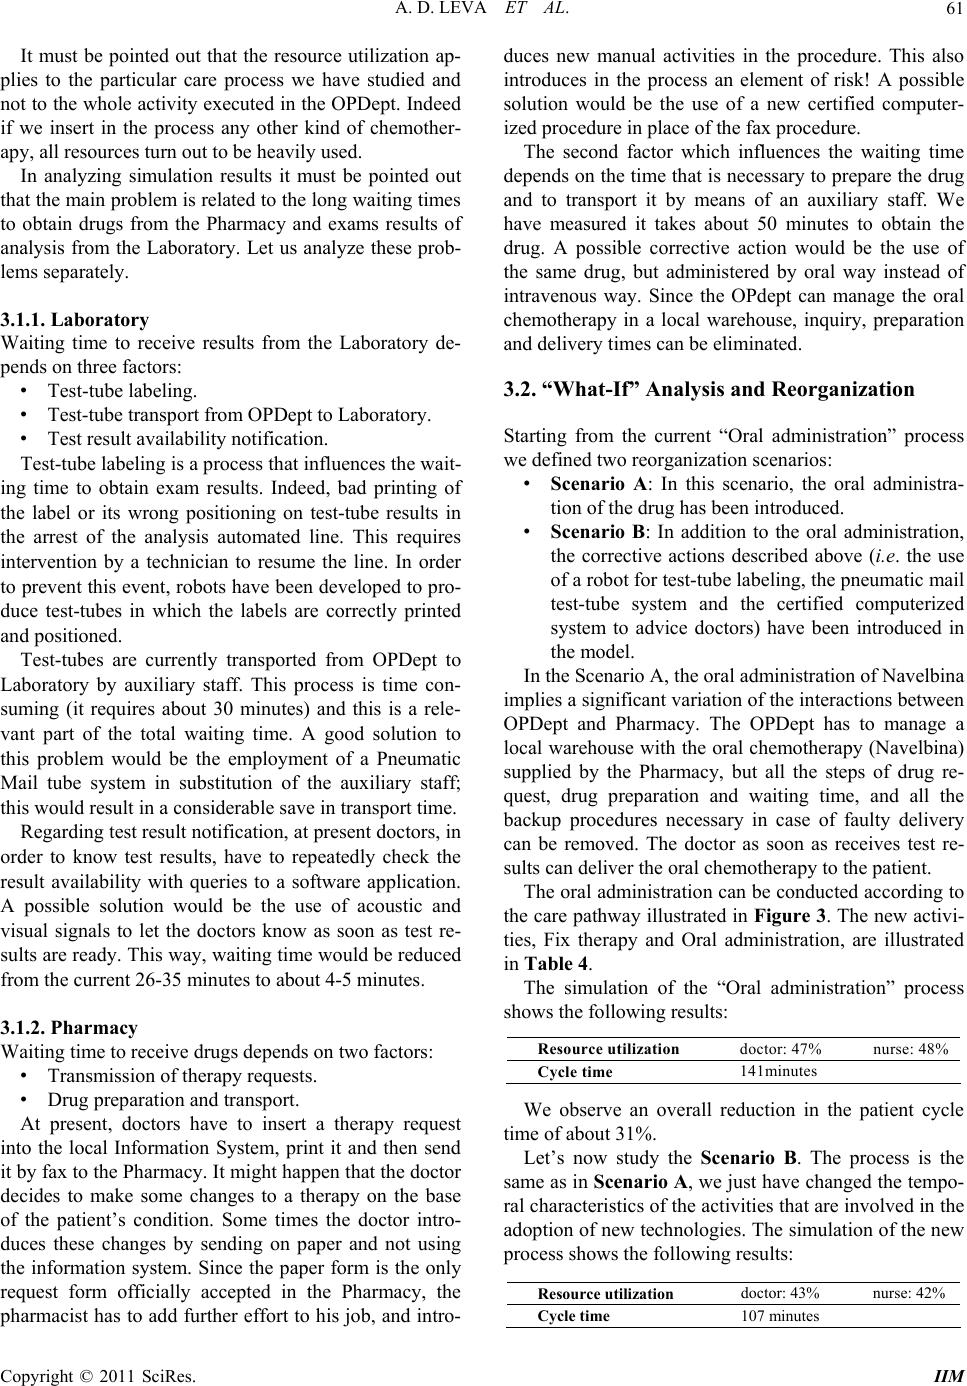 A. D. LEVA ET AL. Copyright © 2011 SciRes. IIM 61 It must be pointed out that the resource utilization ap- plies to the particular care process we have studied and not to the whole activity executed in the OPDept. Indeed if we insert in the process any other kind of chemother- apy, all resources turn out to be heavily used. In analyzing simulation results it must be pointed out that the main problem is related to the long waiting times to obtain drugs from the Pharmacy and exams results of analysis from the Laboratory. Let us analyze these prob- lems separately. 3.1.1. Laboratory Waiting time to receive results from the Laboratory de- pends on three factors: • Test-tube labeling. • Test-tube transport from OPDept to Laboratory. • Test result availability notification. Test-tube labeling is a process that influ ences the wait- ing time to obtain exam results. Indeed, bad printing of the label or its wrong positioning on test-tube results in the arrest of the analysis automated line. This requires intervention by a technician to resume the line. In order to prevent this event, robots have been developed to pro- duce test-tubes in which the labels are correctly printed and positioned. Test-tubes are currently transported from OPDept to Laboratory by auxiliary staff. This process is time con- suming (it requires about 30 minutes) and this is a rele- vant part of the total waiting time. A good solution to this problem would be the employment of a Pneumatic Mail tube system in substitution of the auxiliary staff; this would result in a considerable save in transport time. Regarding test result no tification, at presen t doctors, in order to know test results, have to repeatedly check the result availability with queries to a software application. A possible solution would be the use of acoustic and visual signals to let the doctors know as soon as test re- sults are ready. This way, waiting time would be reduced from the current 26-35 minutes to about 4-5 minutes. 3.1.2. Pharmacy Waiting time to receive drugs depends on two factors: • Transmission of therapy requests. • Drug preparation and transport. At present, doctors have to insert a therapy request into the local Information System, print it and then send it by fax to the Pharmacy. It might h app en th at th e doctor decides to make some changes to a therapy on the base of the patient’s condition. Some times the doctor intro- duces these changes by sending on paper and not using the information system. Since the paper form is the only request form officially accepted in the Pharmacy, the pharmacist has to add further effort to his job, and intro- duces new manual activities in the procedure. This also introduces in the process an element of risk! A possible solution would be the use of a new certified computer- ized procedure in place of the fax procedure. The second factor which influences the waiting time depends on the time that is necessary to prepare the drug and to transport it by means of an auxiliary staff. We have measured it takes about 50 minutes to obtain the drug. A possible corrective action would be the use of the same drug, but administered by oral way instead of intravenous way. Since the OPdept can manage the oral chemotherapy in a local warehouse, inquiry, preparation and delivery times can be eliminated. 3.2. “What-If” Analysis and Reorganization Starting from the current “Oral administration” process we defined two reo rganizatio n sce narios: • Scenario A: In this scenario, the oral administra- tion of the drug has bee n intr od uced. • Scenario B: In addition to the oral administration, the corrective actions described above (i.e. the use of a robot for test-tube labeling, the pneumatic mail test-tube system and the certified computerized system to advice doctors) have been introduced in the model. In the Scenario A, the oral administration of Navelbina implies a significant variation of the interactions between OPDept and Pharmacy. The OPDept has to manage a local warehouse with the oral chemotherapy (Navelbina) supplied by the Pharmacy, but all the steps of drug re- quest, drug preparation and waiting time, and all the backup procedures necessary in case of faulty delivery can be removed. The doctor as soon as receives test re- sults can deliver the oral chemotherapy to the patient. The oral administration can be conducted according to the care pathway illustrated in Figure 3. The new activi- ties, Fix therapy and Oral administration, are illustrated in Table 4. The simulation of the “Oral administration” process shows the following results: Resource utilization doctor: 47% nurse: 48% Cycle time 141minutes We observe an overall reduction in the patient cycle time of about 31%. Let’s now study the Scenario B. The process is the same as in Scenario A, we just have changed the tempo- ral characteristics of the activities that are involved in the adoption of new technologies. The simulation of the new process shows the following results: Resource utilization docto r: 43% nurse: 42% Cycle time 107 minutes 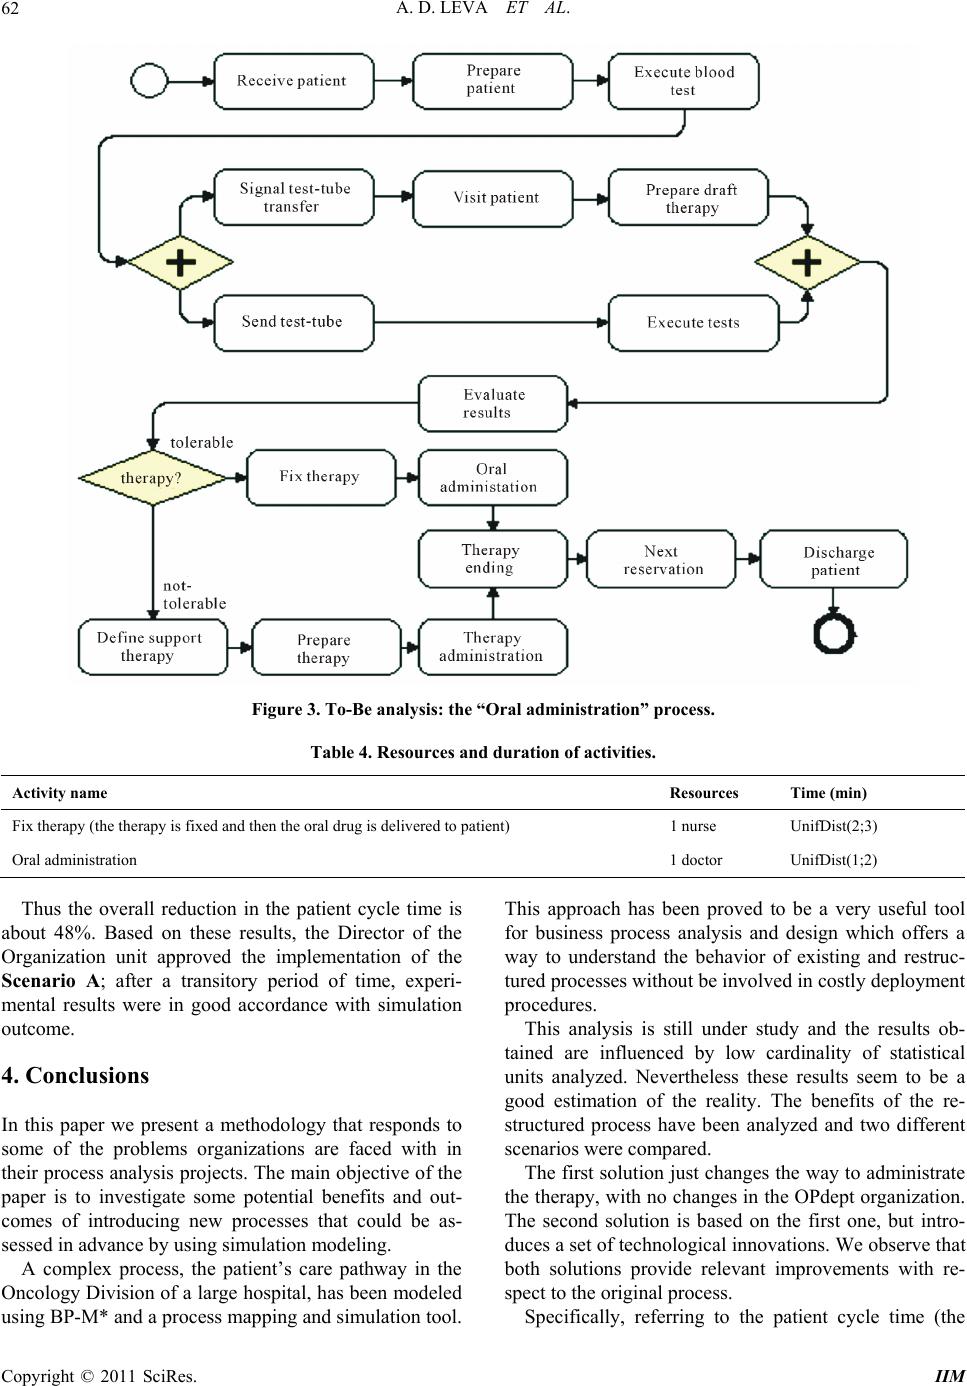 A. D. LEVA ET AL. 62 Figure 3. To-Be analysis: the “Oral administration” process. Table 4. Resources and duration of activities. Activity name Resources Time (min) Fix therapy (the therapy is fixed and then the oral drug is delivered to patient) 1 nurse UnifDist(2;3) Oral administration 1 doctor UnifDist(1;2) Thus the overall reduction in the patient cycle time is about 48%. Based on these results, the Director of the Organization unit approved the implementation of the Scenario A; after a transitory period of time, experi- mental results were in good accordance with simulation outcome. 4. Conclusions In this paper we present a methodology that responds to some of the problems organizations are faced with in their process analysis projects. The main objective of the paper is to investigate some potential benefits and out- comes of introducing new processes that could be as- sessed in advance by using simulation modeling. A complex process, the patient’s care pathway in the Oncology Division of a large hospital, has been modeled using BP-M* and a process mapping and simulation tool. This approach has been proved to be a very useful tool for business process analysis and design which offers a way to understand the behavior of existing and restruc- tured processes without be invo lved in costly dep loyment procedures. This analysis is still under study and the results ob- tained are influenced by low cardinality of statistical units analyzed. Nevertheless these results seem to be a good estimation of the reality. The benefits of the re- structured process have been analyzed and two different scenarios were compared. The first solution just changes the way to administrate the therapy, with no changes in the OPdept organization. The second solution is based on the first one, but intro- duces a set of technological innovations. We observe that both solutions provide relevant improvements with re- spect to the original process. Specifically, referring to the patient cycle time (the Copyright © 2011 SciRes. IIM 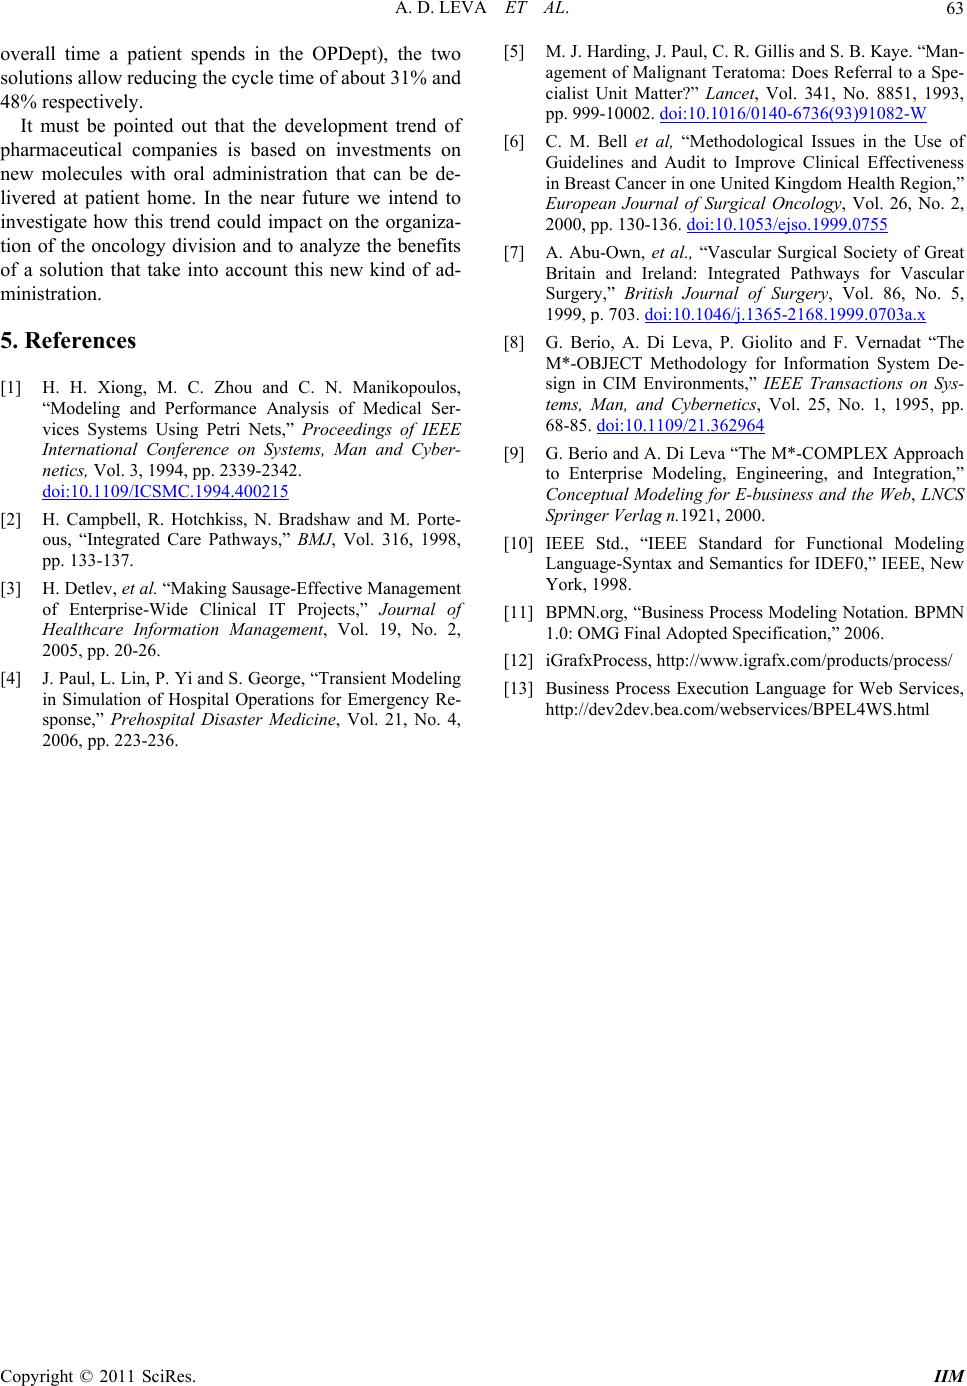 A. D. LEVA ET AL.63 overall time a patient spends in the OPDept), the two solutions allow reducing the cycle time of about 31% and 48% respectively. It must be pointed out that the development trend of pharmaceutical companies is based on investments on new molecules with oral administration that can be de- livered at patient home. In the near future we intend to investigate how this trend could impact on the organiza- tion of the oncology division and to analyze the benefits of a solution that take into account this new kind of ad- ministration. 5. References [1] H. H. Xiong, M. C. Zhou and C. N. Manikopoulos, “Modeling and Performance Analysis of Medical Ser- vices Systems Using Petri Nets,” Proceedings of IEEE International Conference on Systems, Man and Cyber- netics, Vol. 3, 1994, pp. 2339-2342. doi:10.1109/ICSMC.1994.400215 [2] H. Campbell, R. Hotchkiss, N. Bradshaw and M. Porte- ous, “Integrated Care Pathways,” BMJ, Vol. 316, 1998, pp. 133-137. [3] H. Detlev, et al. “Making Sausage-Effective Management of Enterprise-Wide Clinical IT Projects,” Journal of Healthcare Information Management, Vol. 19, No. 2, 2005, pp. 20-26. [4] J. Paul, L. Lin, P. Yi and S. George, “Transient Modeling in Simulation of Hospital Operations for Emergency Re- sponse,” Prehospital Disaster Medicine, Vol. 21, No. 4, 2006, pp. 223-236. [5] M. J. Harding, J. Paul, C. R. Gillis and S. B. Kaye. “Man- agement of Malignant Teratoma: Does Referral to a Spe- cialist Unit Matter?” Lancet, Vol. 341, No. 8851, 1993, pp. 999-10002. doi:10.1016/0140-6736(93)91082-W [6] C. M. Bell et al, “Methodological Issues in the Use of Guidelines and Audit to Improve Clinical Effectiveness in Breast Cancer in one United Kingdom Health Region,” European Journal of Surgical Oncology, Vol. 26, No. 2, 2000, pp. 130-136. doi:10.1053/ejso.1999.0755 [7] A. Abu-Own, et al., “Vascular Surgical Society of Great Britain and Ireland: Integrated Pathways for Vascular Surgery,” British Journal of Surgery, Vol. 86, No. 5, 1999, p. 703. doi:10.1046/j.1365-2168.1999.0703a.x [8] G. Berio, A. Di Leva, P. Giolito and F. Vernadat “The M*-OBJECT Methodology for Information System De- sign in CIM Environments,” IEEE Transactions on Sys- tems, Man, and Cybernetics, Vol. 25, No. 1, 1995, pp. 68-85. doi:10.1109/21.362964 [9] G. Berio and A. Di Leva “The M*-COMPLEX Approach to Enterprise Modeling, Engineering, and Integration,” Conceptual Modeling for E-business and the Web, LNCS Springer Verlag n.1921, 2000. [10] IEEE Std., “IEEE Standard for Functional Modeling Language-Syntax and Semantics for IDEF0,” IEEE, New York, 1998. [11] BPMN.org, “Business Process Modeling Notation. BPMN 1.0: OMG Final Adopted Specification,” 2006. [12] iGrafxProcess, http://www.igrafx.com/products/process/ [13] Business Process Execution Language for Web Services, http://dev2dev.bea.com/webservices/BPEL4WS.html Copyright © 2011 SciRes. IIM |