

Paper Menu >>
Journal Menu >>
 Vol.3, No.1B, 16-19 (2014) Journal of Agricultural Chemistry and Environment http://dx.doi.org/10.4236/jacen.2014.31B004 Modeling crop land soil moisture and impacts of supplimental irrigaiton in a rainfed region of Bangladesh Pramod K. Pandey*, Sagor Biswas Department of Population Health and Reproduction, University of Californian, Davis, USA; *Corresponding Author: [email protected] Received October 213 ABSTRACT A robust water balance model has been tested for predicting soil moisture levels and supple- mental irrigation requirement of a rainfed region of Bangladesh. The predictions were used for improving the understanding of the impacts of rainwater harvesting on rainfed agriculture. The climate data (i.e., rainfall, temperature, evapora- tion, and evapotranspiration) were used as in- puts for predicting the variations in soil mois- ture. Soil moisture levels under rainfed and sup- plementary irrigation conditions were compared. Results showed that rainwater harvesting i.e., rain water storage tanks during rainy seasons can be potentially useful for storing rainwater, which can be utilized for enhancing crop land soil moisture during dry seasons for enhancing crop yield. The study presented here will be use- ful for improving and disseminating rainwater harvesting approaches for enhancing water availability in rainfed regions. KEYWORDS Rainwater Harvesting; Rainfed Crop Land; Supplemental Irrigation; Crop Yiel d 1. INTRODUCTION It is required to increase the agricultural water availa- bility in rainfed regions to enhance the global food pro- duction. Approximately more than 80% of the global crop land is rainfed, which produces more than 70% of global food productions currently [1-3]. For improving food production further, additional water resources capa- ble of providing the irrigation to crop lands is required [4]. One option is increasing the facilities/structures for rainwater harvesting in the crop land itself [5,6]. In many rainfed regions, for instance, in Bangladesh, more than 76% of rainfall oc curs in rainy season (May to October); however, a major portion of it losses as runoff. Due to insufficient water storages, farmers often face irrigation water shortages during dry seasons. Providing the facili- ties capable of storing the rain water during rainy season can potentially facilitate water availability for irrigation. Previous studies have shown that harvested rainwater in on-farm reservoirs during rainy season can enhance crop yield considerably [7,8]. Here we have exploited a water balance model [8] for calculating soil moisture and crop yield under rainwater harvesting facilities and without rainwater harvesting (i.e., rainfed) for improving the un- derstanding of rainfed agriculture and rainwater harvest- ing approaches. 2. METHODS 2.1. Study Area The study area is show n in F i gure 1 . Jessore, a distr ict situated in the southwestern part of Bangladesh (BD), receives about 1741 mm of annual rainfall. Nearly 76% of annual rainfall occurs from May to October. Out of that about 28% of the total annual rainfall occurs in the month of July. Temperature varies from 10˚C to 36˚C. Relative humidity varies from 72% to 86%, and wind speed varies from 0.76 to 4.6 m/s. The rainfall and tem- perature variations of the study area are shown in Fig- ures 2 and 3. Average monthly evapotranspiration varia- tion is shown in Figure 4. 2.2. Model The model used in the study has been described else- where [8]. The model has two components: 1) water bal- ance simulation for crop land; and 2) water balance si- mulation for water storage tanks. Water storage tanks re- ceive water from upland catchment area of 5 ha (as ru- noff), and direct precipitation on tank’s surface. The stored water in the tanks was applied as supplemental irrigation (when needed) to the crop land for enhancing Copyright © 2014 SciRes. OPEN ACCESS 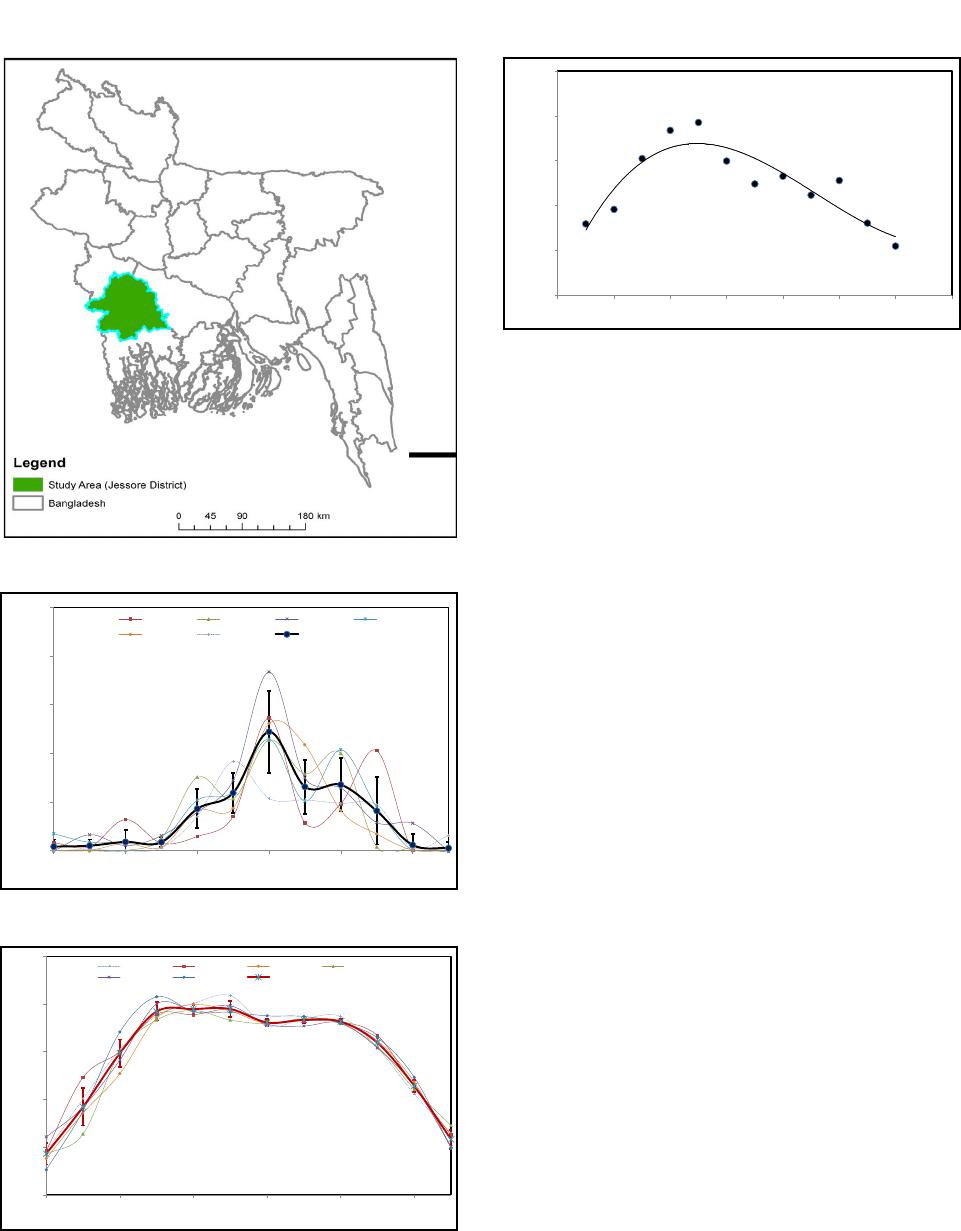 P. K. Pandey, S. Biswas / Journal of Agricultural Chemistry and Environment 3 (2014) 16-19 17 Figure 1. Study area (Jessore District, Bangladesh). Figure 2. Precipitation (Jessore District, Bangladesh). Figure 3. Temperature (Jessore District, Bangladesh). soil moisture. In simulation, we used crop land area of 1 ha, reservoir area of 15% of the catchment area (i.e., 0.8 ha). Figure 4. Potential evapotranspiration (Jessore, BD). The model uses curve number for estimating the ru- noff from catchment to water storage tanks. Daily see- page, evaporation, and spill from the tank were simulated, and the simulation methods are described previously [5, 8]. Crop water requirement were predicted using readily available soil moisture and non-readily available soil moisture [8]. The crop coefficient of bean crop was used for simulating the crop water requirement at various crop growth stages as described previously [8]. The model requires multiple input parameters, which are described in two previous studies [5,8]. Readers are encouraged to preview the published studies for under- standing the model’s details. In this study, we used rainfall, temperature, and evapotranspiration data from the Jes- sore District of Bangladesh. The average monthly rainfall and min/max temperatures were obtained from Bangla- desh Agricultural Research Council (BARC) [9]. Using the monthly data, we estimated daily data using polyno- mial equations (fitted on monthly data). Due to unavaila- bility of evapotranspiration data of the Jessore District, we used neighboring climate stations for estimating the evaporation and evapotranspiration for the study area. The data of the neighboring stations (i.e. West Bengal, India) were obtained from two sources: 1) Indian Meteorologi- cal Department (IMD) [10], and 2 ) Hydrology and Water Resources Information System for India [11]. The climate data (i.e., temperature and rainfall) of the location in India were compared with the Jessore District, and the data were comparable. For example, the annual monthly rain- fall data had similarity of 78% and annual monthly tem- perature had the similarity of 87%. After combining the deviation of rainfall and temperature, we anticipate that there was a possibility of 12.7% deviation in climates between the study area and neighboring climate station. 3. CALCULATIO NS AND INPUT DATA To estimate the daily precipitation from the average monthly data shown in Figure 2, we did perform two separate interpolations: 1) rising limb of precipitation; and 2) falling limb of precipitation, which yielded daily 0 200 400 600 800 1000 1 3 5 7 911 Precipitaiton (mm) Months 2005 2006 2007 2008 2009 2010 Average 15 19 23 27 31 35 1357911 Temperature (d eg C) Months 2005 2006 2007 2008 2009 2010 Average y = 0.2965x3-8.1653x2+ 59.066x + 7.1564 R² = 0.8126 0 40 80 120 160 200 0246810 12 14 Potential evapotranspiratoin monthly (mm) Months Copyright © 2014 SciRes. OPEN A CCESS 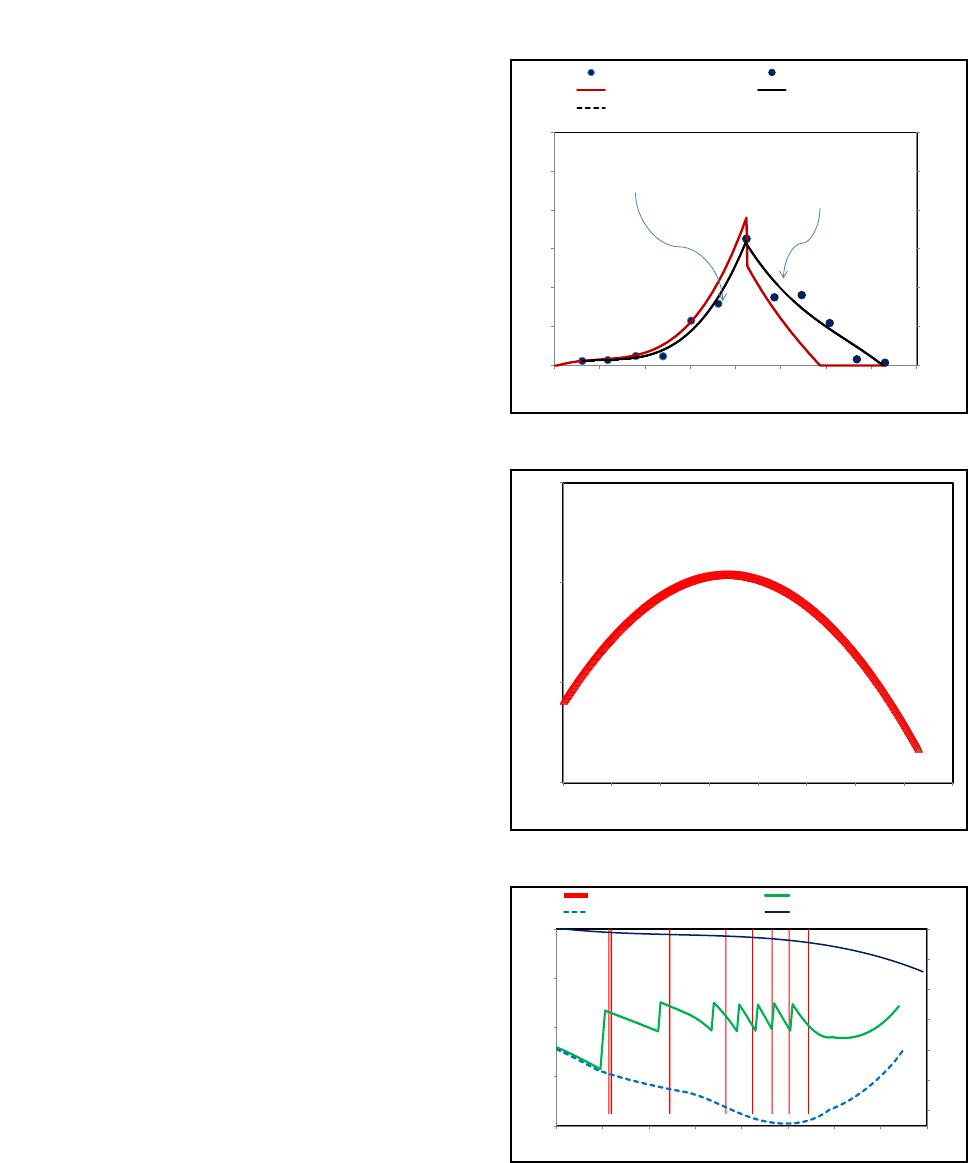 P. K. Pandey, S. Biswas / Journal of Agricultural Chemi s try and Environment 3 (2014) 16-19 18 precipitation data (Figure 5). Two separate interpolations were needed because single interpolation was not able to capture the peak rainfall, which occurred in the month of July. The rising and falling limbs of precipitation are shown in Figure 5, and interpolated precipitation values (daily) are also shown in the figure. Similarly, daily eva- potranspiration was estimated using the average monthly shown in Figure 4. The daily evapotranspiration is shown in Figure 6. The model used in this study requires daily input data (precipitation, temperature, evaporation, and evapotrans- piration). Evaporation was estimated from evapotranspi- ration. Previous studies reported that evaporation values vary approximately 120% - 130% of evapotranspiration. In this study, we used daily evaporation values as 130% of the dail y ev a potranspira t ion values. 4. RESULTS AND DISCUSSION The average annual interpolated daily precipitation was slightly less than the observed data. The observed average annual precipitation for the study area was about 1741 mm, while interpolation yielded average annual precipitation of 1478 mm i.e., 81% of the observed val- ues. The average annual evapotranspiration was approx- imately 1189 mm, while interpolation yielded average annual evapotranspiration of 1147 mm. Figure 7 shows the soil moisture variations in rainfed and irrigated con- ditions. In addition, daily precipitation and supplemental irrigation is also shown in the figure. The simulation is shown for starting from Julian Day 1 to Julian Day 150. As shown in the figure, soil moisture was considerably elevated when supplemental irrigation was applied (sup - plemental irrigation is shown as vertical red bars in Fig- ure 7). Soil moisture in the rainfed and irrigated condi- tions were estimated for two seasons: (Season 1: Julian Day 20 - 119; and Season 2: Juli a n Da y 16 5 - 264). Com- pared to the first season, in the second season i.e., be- yond Julian Day 165, soil moisture in rainfed and irrigat- ed conditions were comparable because of excess rainfall. The available water storages in ponds were not utilized as supplemental irrigation because the soil moisture was suffi cient without supplem ental irrigation ( data not shown). At the end of cropping season, the soil moisture con- tent in irrigated condition was almost three times greater than the rainfed soil moisture. Although actual evapo- transpiration (ET) was almost two times greater in irri- gated condition compared to rainfed condition, the actual yield increased about three times in irrigated condition when compared to the rainfed condition. Addition of 128 mm of supplementary irrigation decreased the green wa- ter use by 45% and increased the total water use by 55% compared to rainfed condition. Subsequently the overall water use efficiency showed a nearly 55% increase in irrigated condition. As shown in the Table 1, water re- Figure 5. Interpolated daily precipitation. Figure 6. Daily evapotranspiration. Figure 7. Soil moisture and supplemental irrigation. charge values (R) of uncultivated land in irrigated condi- tion was 85% of the recharge value of rainfed fed condi- tion. ET value of uncultivated land (i.e., catchment) in irrigated condition was 86% of the rainfed condition. In cultivated land, R and ET values in irrigated condition were higher than the rainfed condition. For example, R y = 4E-06x 3 -0.0006x 2 + 0.0377x -0.1228 R² = 0.9839y = -3E-06x 3 + 0.0028x 2 -0.9952x + 126.7 R² = 0.9403 0 5 10 15 20 25 30 0 5 10 15 20 25 30 050100 150 200 250300 350 400 Interpolated precipitaiton (mm) Precipitation (mm) Julian days Rising limb of rainfallFalling limb of rainfall Interpolated precipitaitonPoly. (Rising limb of rainfall) Poly. (Falling limb of rainfall) 0 2 4 6 050100 150 200 250300 350 400 Potential Evapotranspiration (mm) Julian Days 0 4 8 12 16 20 24 20 60 100 140 180 020406080100 120 140 160 Precipitation (mm) Soil moisture (mm) Julian Days Supplimental irrigationSoil moisture with irrigation Soil moisture with rainfedPrecipitation Copyright © 2014 SciRes. O PEN A CCESS  P. K. Pandey, S. Biswas / Journal of Agricultural Chemistry and Environment 3 (2014) 16-19 19 Table 1. Water balance parameters of catchment area, culti- vated land, and crop yields. Conditions Parameters AMe (mm) ETa (mm) Ya/Ym Ya (kg/ha) TS (mm) GW (mm) Irr. 90.2 268.7 1.0 6000 128 73.53 Rain. 33.2 130.5 0.36 2141 0.0 130.48 Parameters OWUE (kg/m3) UA CA R (m3/yr) ET (m3/yr) R (m3/yr) ET (m3/yr) Irr. 2.98 28101 21588 5907 7842 Rain. 1.64 33060 25397 5498 6298 **Note: Irr. = irrigated; rain. = rainfed; AMe = availab le moistur e at the end of croppi ng seas on 1; Ya = actual cr op yiel d; Y m = maximum crop yield; TS = total supplemental irrigation applied; GW = green water use; OWUE = overall water use efficiency; R = recharge; ET = Evapotranspiration; UA = Uncultivated land area (catchment area of 5 ha); CA = Catchment area (cultivated land area of 1 ha). value in rainfed condition was 93% of the irrigated con- dition, and ET value in rainfed condition was approx- imately 80% of the irrigated condition. In summary, the results of the study showed that rainwater harvesting approach can be an effective alternative for enhancing agricultural water availability in the rainfed regions. 5. CONCLUSION A water balance model was used to estimate the im- pacts of rainwater harvesting appr o ach on enhancing rainfed crop land soil moistures and crop yield for a southwestern district of Bangladesh. The model esti- mated rainwater storages in water storage tank (designed in the farm land). The model uses algorithms to estimate the water requirement of the crop land as well as water availability in the tanks. This decision making allows model to estimate the supplemental irrigation require- ment in the crop land as well as supplemental irrigation availability in the tanks. There sults showed th at the r ain- water harvesting approach presented here increased crop yield considerably in the studied rainfed region of the Bangladesh. The model requires four major parameters: precipitation, temperature, evaporation, and evapotrans- piration. To run the model, daily input data are required. In this study, daily data were estimated from the availa- ble monthly data and used to feed the model. We antic- ipate that the availability of daily observed data will im- prove the model predictions significantly, therefore, fur- ther studies utilizing the daily observed data for predict- ing supplemental irriga tion, soil moisture, and crop yield will be necessary. We suggest future studies utilizing the climate data of multiple locations (rainfed) to enhance the model as well as model predictions. ACKNOWLEDGEMENTS We than k to Dr. Pieter van der Zaag, Professor, UNESCO-IHE Insti- tute for Water Education, Delft, Netherlands, Water Resources Section, Delft University of Technology, Delft, Netherlands for his help in mod- el development, which is already published elsewhere [8]. REFERENCES [1] Human Development Report (2010) The real wealth of nations: pathways to human development. United Nations Development Program (UNDP). http://hdr.undp.org/en/media/HDR_2010_EN_Complete_ reprint.pdf [2] Rockström, J., Falkenmark, M., Karlberg, L., Hoff, H., Rost, S. and Gerten , D. (2009) Future water availability for global food production: The potential of green water for increasing resilience to global change. Water Resourc- es Research, 45, Article ID: W00A12. [3] Rockström, J., Barron, J. and Fox, P. (2003) Water prod- uctivity in rain-fed agriculture: Challenges and opportun- ities for smallholder farmers in drought-prone tropical agro-ecosystems. In: Kijne, J.W., Barker, R. and Molden, D., Eds., Water Productivity in Agriculture: Limits and Opportunities for Improvements, CABI, Publ., Oxon, 145-162. [4] World Bank (2010) Water resource management. Wash- ington, DC. http://web.worldbank.org/WBSITE/EXTERNAL/TOPIC S/EXTWAT/0,,contentMDK:21630583~menuPK:460244 5~pagePK:148956~piPK:216618~theSitePK:4602123,00. html [5] Pandey, P.K., Soupir, M.L., Singh, V.P., Panda, S.N. and Pandey, V. (2011) Modelling rainwater storage in distri- buted reservoir systems in humid subtropical and tropical savannah regions. Water Resources Management, 25, 3091-3111. http://dx.doi.org/10.1007/s11269-011-9847-5 [6] Panigrahi, B., Panda, S.N. and Mull, R. (2001) Simula- tion of water harvesting potential in rainfed ricelands us- ing water balance model. Agricultural Systems, 69, 165- 182. http://dx.doi.org/10.1016/S0308-521X(01)00013-0 [7] Pandey, P.K., Panda, S.N. and Panigrahi, B. (2006) Sizing on-farm reservoirs for crop-fish integration in rainfed farming systems in Eastern India. Biosystems Engineer- ing, 93, 475-489. ttp://dx.doi.org/10.1016/j.biosystemseng.2006.01.009 [8] Pandey, P.K., der Zaag, P., Soupir, M.L. and Singh, V.P. (2013) A new model to simulate hydro-economic poten- tial of rainwater harvesting and supplemental irrigation rainfed agriculture. Water Resources Management, 27, 3145-3164. http://dx.doi.org/10.1007/s11269-013-0340-1 [9] (2013) Bangladesh Agricultural Research Council, Min- istry of Agriculture, Government of Peoples Republic of Bangladesh. http://www.barc.gov.bd/inf_sys_data.php [10] (2013) Indian Meteorological Department (IMD). http://www.imd.gov.in/ [11] (2013) Hydrology and Water Resources Information Sys- tems for India. http://www.nih.ernet.in/rbis/rbis.htm Copyright © 2014 SciRes. OPEN A CCESS |