

Paper Menu >>
Journal Menu >>
 Journal of Environmental Protection, 2011, 2, 83-89 doi:10.4236/jep.2011.21009 Published Online March 2011 (http://www.SciRP.org/journal/jep) Copyright © 2011 SciRes. JEP 83 Qualitative Characterization and Differentiation of Digestates from Different Biowastes Using FTIR and Fluorescence Spectroscopies Maria Rosaria Provenzano1, Giuseppina Iannuzzi1, Claudio Fabbri2, Nicola Senesi1 1Dipartimento di Biologia e Chimica Agroforestale ed Ambientale, University of Bari, Bari, Italy; 2C.R.P.A. S.p.A.Corso Garibaldi, Reggio Emilia, Italy. Email: [email protected] Received September 14th, 2010; revised November 1st, 2010; accepted December 23rd, 2010. ABSTRACT Anaerobic digestion of biomasses originates different products, the most abundant of which are methane and carbon dioxide. During this process, a 60-70% organic matter reduction occurs and the final product, the digestate, is charac- terized by high biological stability and high contents of recalcitrant organic molecules and nutrients. In the present work digestates obtained by different mixture of biomasses in a full-scale co-digestion plant operating in Italy were characterized as whole samples without any pre-treatment or extraction by means of Fourier transform infrared spec- troscopy and fluorescence spectroscopy in the synchronous-scan mode and results were compared to those obtained on the single fresh substrates. Biomasses considered were: beef cattle slurry, maize or sorghum silage, agro-industrial residues, olive residues and olive mill wastewater. These substrates exhibited typical spectra related to their different chemical composition. Results obtained on digestates provided evidence of distinctive characteristic of the final product as a function of the different composition of the biomasses loaded into the digestion plant. We concluded that FTIR and fluorescence spectra of digestates produced in a real co-digestion plant “inherit” the main spectroscopic features of the organic wastes from which they are produced. Spectroscopic techniques used in this work succeeded in qualitatively characterizing and differentiating digestates obtained from biomasses of different chemical composition. Keywords: Organic Wastes, Anaerobic Digestion, Digestates, Fourier Transform Infrared Spectroscopy, Synchronous-Scan Fluorescence Spectra 1. Introduction Anaerobic digestion has been known for centuries but interest in the economical recovery of fuel methane gas from different types of organic wastes on industrial scale has recently enormously increased owing to the changing socio economical situation in the world. In fact, depletion of fossil fuels has posed the urgent need to move to al- ternative energy supplies with emphasis on renewable sources and the number of anaerobic treatment plants in Europe has remarkably increased in recent years. Anaerobic digestion is a biological degradation of or- ganic matter under anaerobic conditions which originates different products, the most abundant of which are methane and carbon dioxide. The decomposition takes place in three stages: Hydrolysis whereby organic poly- mers such as proteins, lipids and carbohydrates are bro- ken down into soluble monomers; Acid formation during which fermentative bacteria degrade these molecules to volatile fatty acids and to ammonia; Methane formation in which the acids are converted to biogas and a residue called digestate. During the anaerobic digestion, a 60- 70% organic matter reduction occurs and the digestate is characterized by high biological stability and high con- tents of recalcitrant organic molecules and nutrients. Co-digestion strategies, referring to the combined treatment of several biomasses with complementary characteristics, in most cases enhance the biogas produc- tion due to positive synergisms established in the diges- tion medium and the supply of missing nutrients by co-substrates [1]. Agro-industrial residues are known to have a high potential for methane production since they can be digested rapidly making them a good source of material for anaerobic co-digestion [2]. The concept of energy crops has been known for many years but recently they have risen to represent a renewable biomass whose  Qualitative Characterization and Differentiation of Digestates from Different Biowastes Using FTIR and 84 Fluorescence Spectroscopies cost is expected to decline as technology improves. For olive oil producing countries on the Mediterranean area such as Italy, treatment and disposal of olive mill effluent and residues represents one of the major environmental problems also because a large volume of this effluent is produced in a short period in wintertime. Difficulties regarding the treatment of olive mill wastewaters are associated to the presence of polyphenols and long fatty acid compounds which are toxic for plant growth [3-5]. Spectroscopic investigation based on Fourier trans- form infrared spectroscopy (FTIR) and fluorescence spectroscopy have been widely applied to the characteri- zation of humic and fulvic acids of different origin and nature [7-9] and whole composts from various organic wastes sampled at different composting time [10,11]. However, as far as we are concerned, very few data [12] are available on spectroscopic characterization of prod- ucts deriving by anaerobic digestion. In the present work a number of digestates obtained in a full-scale co-digestion plant operating in Italy will be analyzed by means of fluorescence spectroscopy in the synchronous-scan mode and FTIR spectroscopy and re- sults will be compared to those obtained on the fresh substrates processed in the plant in order to qualitatively characterize and differentiate digestates obtained from different mixture of organic wastes. 2. Materials and Methods The co-digestion plant is located in the city of Forlì, in Emilia Romagna region, Northern Italy. In this plant, a continuously stirred tank + plug flow reactor is heated to a temperature of 40˚C and the 6300 m3 digesters (5700 m3 net volume) are fed for most of the year with energy crops (maize or sorghum silage), beef cattle slurry, and agro-industrial residues in about 50:20:30 percent vol- ume ratio with an average of about 60 ton/day of bio- masses processed. Loading of biomasses is totally com- puterized and performed continuously with a 30 minutes frequency. The organic loading rate is 3 kg·VS/m3/day with a hydraulic retention time of 95 days. During the olive oil production season, the beef cattle slurry is par- tially substituted with olive mill wastewaters and agro- industrial residues are mixed with a 10% of olive resi- dues. The average biogas composition is quite constant during the year due to the low variability of the composi- tion of biomasses utilized. The methane production is 0.356 Nm3·kg·VS-1 while the electrical energy yield is 1.48 kW·h/kg·VS-1. The biogas, constituted by 53%vol CH4, 47%vol CO2, traces of H2 and H2S, is totally deliv- ered to a power generator to be converted into electricity with an average daily production of about 18 MWh [13]. From this digestion plant, five samples of digestates (D1-D5) were retrieved. D1 and D2 were obtained from beef cattle slurry (BCS), maize or sorghum silage (SS), agro-industrial residues (AIR). D3, D4 were obtained from olive mill wastewater (OMW), maize or sorghum silage (SS), agro-industrial residues (AIR), olive residues (OR), D5 were obtained from olive mill wastewater (OMW), maize or sorghum silage (SS), agro-industrial residues (AIR).The fresh biomasses loaded into the plant were sampled as well. For sampling, several sub-samples were retrieved from the plant and thoroughly mixed and homogenized to obtain a final sample of about 1 kg for analysis. All samples were dried for 24 h at 105˚C, shredded in a blender, sieved using a 2-mm mesh, and stored in a refrigerator. Fresh matter (FM), total solids (TS), and volatile solid (VS) were determined according to standard procedure [14]. NH3-N and total nitrogen (NTK) were determined according to the analytical methods for wastewater sludge [15]. FTIR spectra were generated on pellets obtained by pressing under vacuum about 200 mg of the mixture obtained by crushing in a agate mortar 400 mg KBr, spectrometry grade and 1 mg of whole sample with precaution taken to avoid moisture uptake. Spectra were recorded in the 4000 to 400 cm-1 wavelength range using a Nicolet 5P5 FTIR spectropho- tometer, with a resolution of 2 cm-1 and a scan rate of 64 scans/min. Synchronous-scan fluorescence spectra were obtained on the whole sample without any pre-treatment or extraction using a Perkin-Elmer LS55 Luminescence Spectrophotometer on water solution of samples at a concentration of 100 mg/L after overnight agitation and equilibration at room temperature, successsive filtration with Whatman n˚ 1 paper and adjustment to pH 8 with 0.05 N NaOH for comparison with previous works [8]. Spectra were generated by changing simultaneously both the excitation and the emission wavelengths over a scan range of 300 - 550 nm while maintaining a constant wavelength difference Δλ = λem – λex = 18 nm [16]. 3. Results and Discussion 3.1. Chemical Analysis Chemical analysis of each biomass and digestates are reported respectively in Table 1 and Tab le 2. Fresh sub- strates exhibit distinctive chemical characteristics related to their different nature. High values of TS, VS and TOC are shown by OR, whereas BCS and OMW are charac- terized by high TKN content as opposite to lower values shown by SS and OR. On the contrary, chemical data do not differ significantly among digestates. All pH values are slighly alkaline due to VFA degradation and ammo- nia production [17]. TKN values are very similar whereas NH3-N content decreases slightly in D5 likely due to the Copyright © 2011 SciRes. JEP 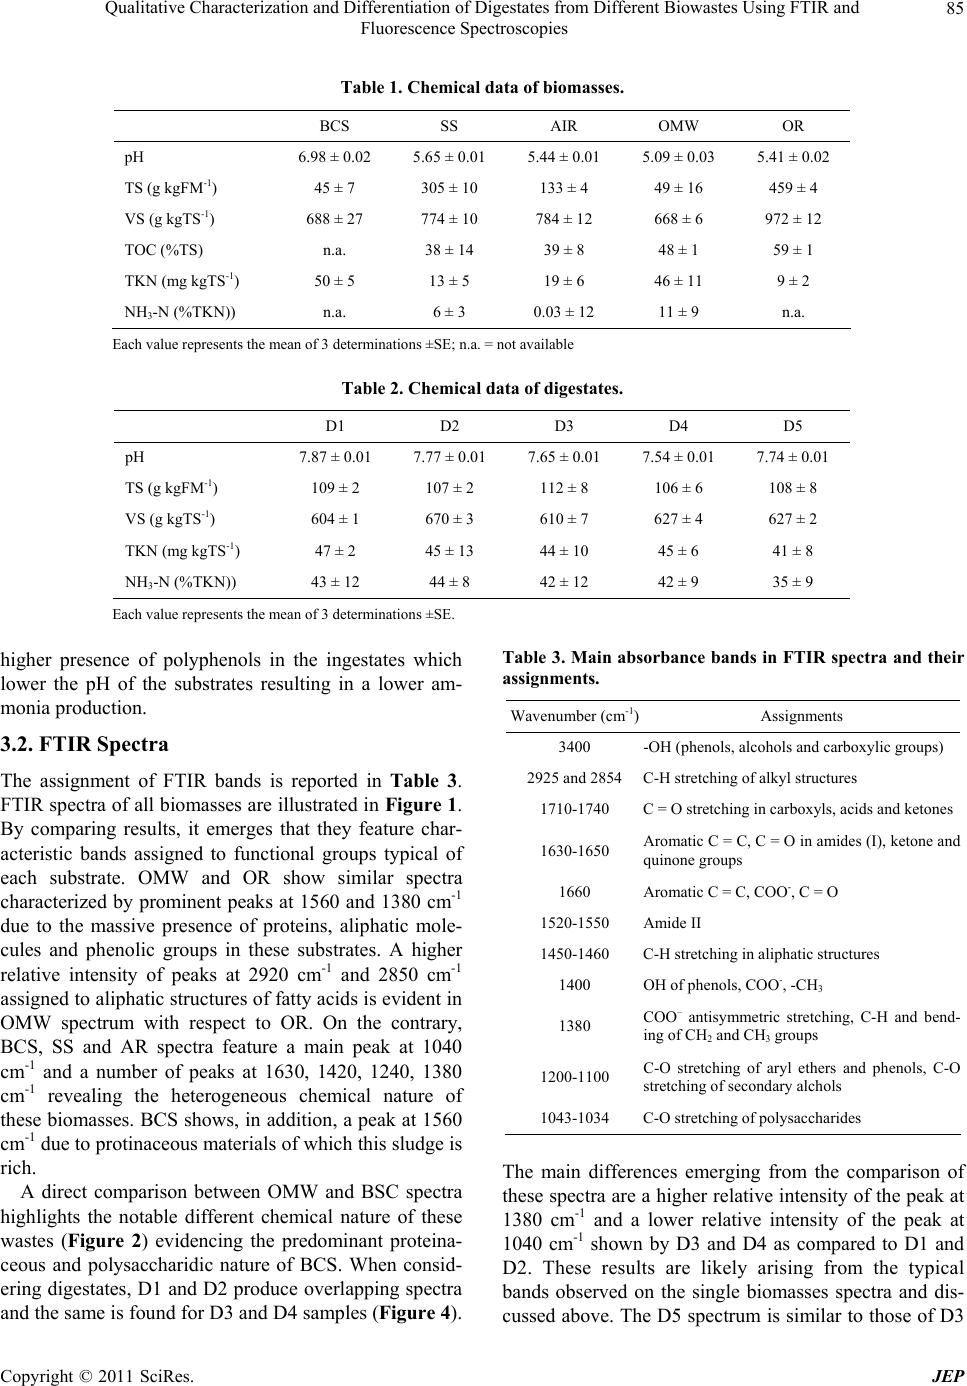 Qualitative Characterization and Differentiation of Digestates from Different Biowastes Using FTIR and Fluorescence Spectroscopies Copyright © 2011 SciRes. JEP 85 Table 1. Chemical data of biomasses. BCS SS AIR OMW OR pH 6.98 ± 0.02 5.65 ± 0.01 5.44 ± 0.01 5.09 ± 0.03 5.41 ± 0.02 TS (g kgFM-1) 45 ± 7 305 ± 10 133 ± 4 49 ± 16 459 ± 4 VS (g kgTS-1) 688 ± 27 774 ± 10 784 ± 12 668 ± 6 972 ± 12 TOC (%TS) n.a. 38 ± 14 39 ± 8 48 ± 1 59 ± 1 TKN (mg kgTS-1) 50 ± 5 13 ± 5 19 ± 6 46 ± 11 9 ± 2 NH3-N (%TKN)) n.a. 6 ± 3 0.03 ± 12 11 ± 9 n.a. Each value represents the mean of 3 determinations ±SE; n.a. = not available Table 2. Chemical data of digestates. D1 D2 D3 D4 D5 pH 7.87 ± 0.01 7.77 ± 0.01 7.65 ± 0.01 7.54 ± 0.01 7.74 ± 0.01 TS (g kgFM-1) 109 ± 2 107 ± 2 112 ± 8 106 ± 6 108 ± 8 VS (g kgTS-1) 604 ± 1 670 ± 3 610 ± 7 627 ± 4 627 ± 2 TKN (mg kgTS-1) 47 ± 2 45 ± 13 44 ± 10 45 ± 6 41 ± 8 NH3-N (%TKN)) 43 ± 12 44 ± 8 42 ± 12 42 ± 9 35 ± 9 Each value represents the mean of 3 determinations ±SE. higher presence of polyphenols in the ingestates which lower the pH of the substrates resulting in a lower am- monia production. 3.2. FTIR Spectra The assignment of FTIR bands is reported in Table 3. FTIR spectra of all biomasses are illustrated in Figure 1. By comparing results, it emerges that they feature char- acteristic bands assigned to functional groups typical of each substrate. OMW and OR show similar spectra characterized by prominent peaks at 1560 and 1380 cm-1 due to the massive presence of proteins, aliphatic mole- cules and phenolic groups in these substrates. A higher relative intensity of peaks at 2920 cm-1 and 2850 cm-1 assigned to aliphatic structures of fatty acids is evident in OMW spectrum with respect to OR. On the contrary, BCS, SS and AR spectra feature a main peak at 1040 cm-1 and a number of peaks at 1630, 1420, 1240, 1380 cm-1 revealing the heterogeneous chemical nature of these biomasses. BCS shows, in addition, a peak at 1560 cm-1 due to protinaceous materials of which this sludge is rich. A direct comparison between OMW and BSC spectra highlights the notable different chemical nature of these wastes (Figure 2) evidencing the predominant proteina- ceous and polysaccharidic nature of BCS. When consid- ering digestates, D1 and D2 produce overlapping spectra and the same is found for D3 and D4 samples (Figure 4). Table 3. Main absorbance bands in FTIR spectra and their assignments. Wavenumber (cm-1)Assignments 3400 -OH (phenols, alcohols and carboxylic groups) 2925 and 2854 C-H stretching of alkyl structures 1710-1740 C = O stretching in carboxyls, acids and ketones 1630-1650 Aromatic C = C, C = O in amides (I), ketone an d quinone groups 1660 Aromatic C = C, COO-, C = O 1520-1550 Amide II 1450-1460 C-H stretching in aliphatic structures 1400 OH of phenols, COO-, -CH3 1380 COO– antisymmetric stretching, C-H and bend- ing of CH2 and CH3 groups 1200-1100 C-O stretching of aryl ethers and phenols, C-O stretching of secondary alchols 1043-1034 C-O stretching of polysaccharides The main differences emerging from the comparison of these spectra are a higher relative intensity of the peak at 1380 cm-1 and a lower relative intensity of the peak at 1040 cm-1 shown by D3 and D4 as compared to D1 and D2. These results are likely arising from the typical bands observed on the single biomasses spectra and dis- cussed above. The D5 spectrum is similar to those of D3 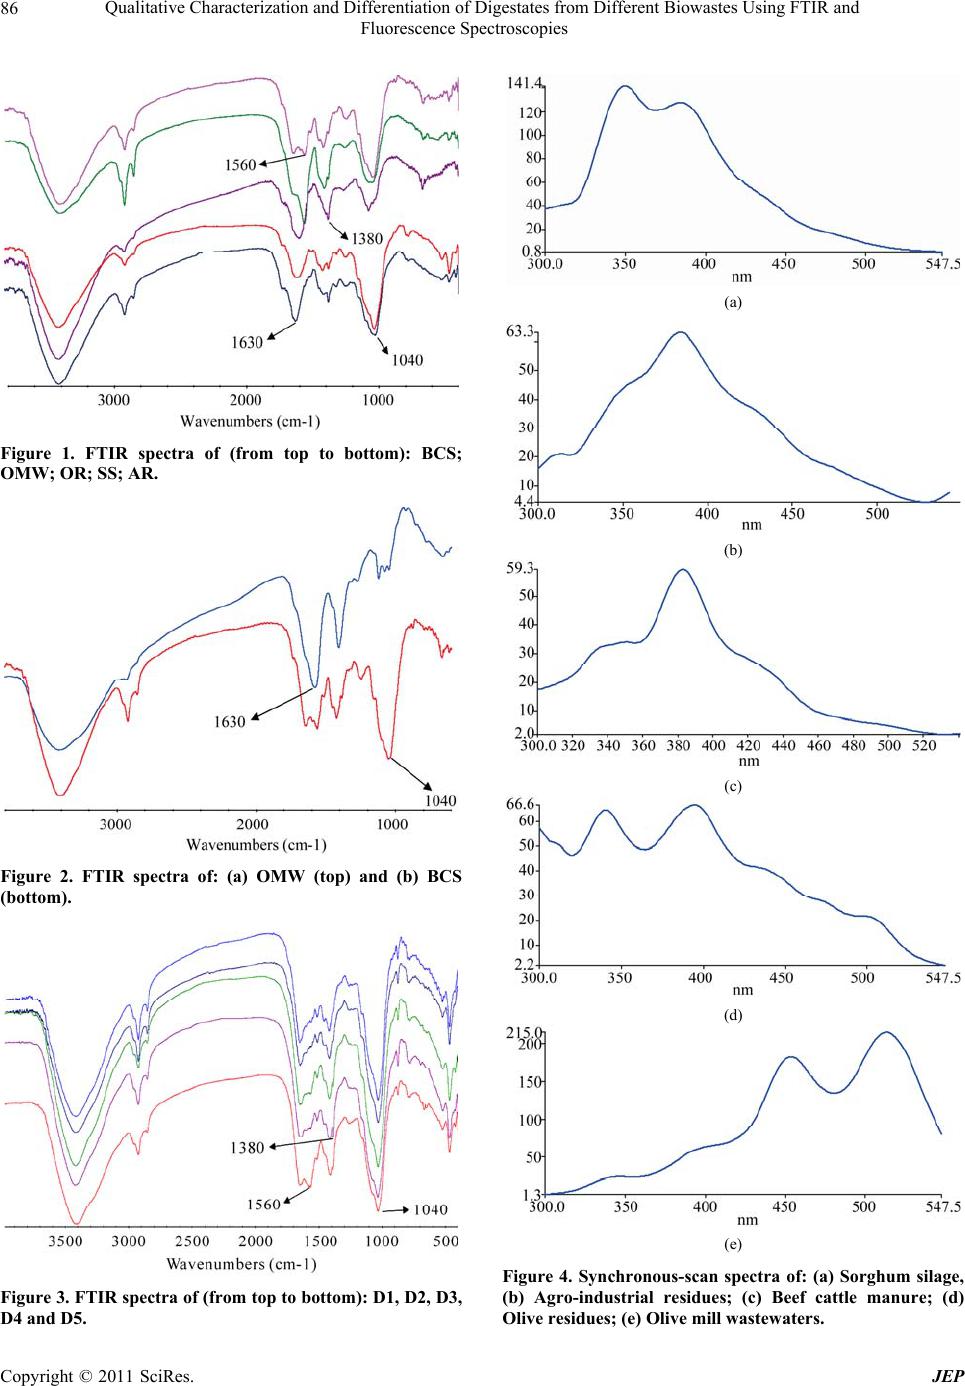 Qualitative Characterization and Differentiation of Digestates from Different Biowastes Using FTIR and 86 Fluorescence Spectroscopies Figure 1. FTIR spectra of (from top to bottom): BCS; OMW; OR; SS; AR. Figure 2. FTIR spectra of: (a) OMW (top) and (b) BCS (bottom). Figure 3. FTIR spectra of (from top to bottom): D1, D2, D3, D4 and D5. (a) (b) (c) (d) (e) Figure 4. Synchronous-scan spectra of: (a) Sorghum silage, (b) Agro-industrial residues; (c) Beef cattle manure; (d) Olive residues; (e) Olive mill wastewaters. Copyright © 2011 SciRes. JEP 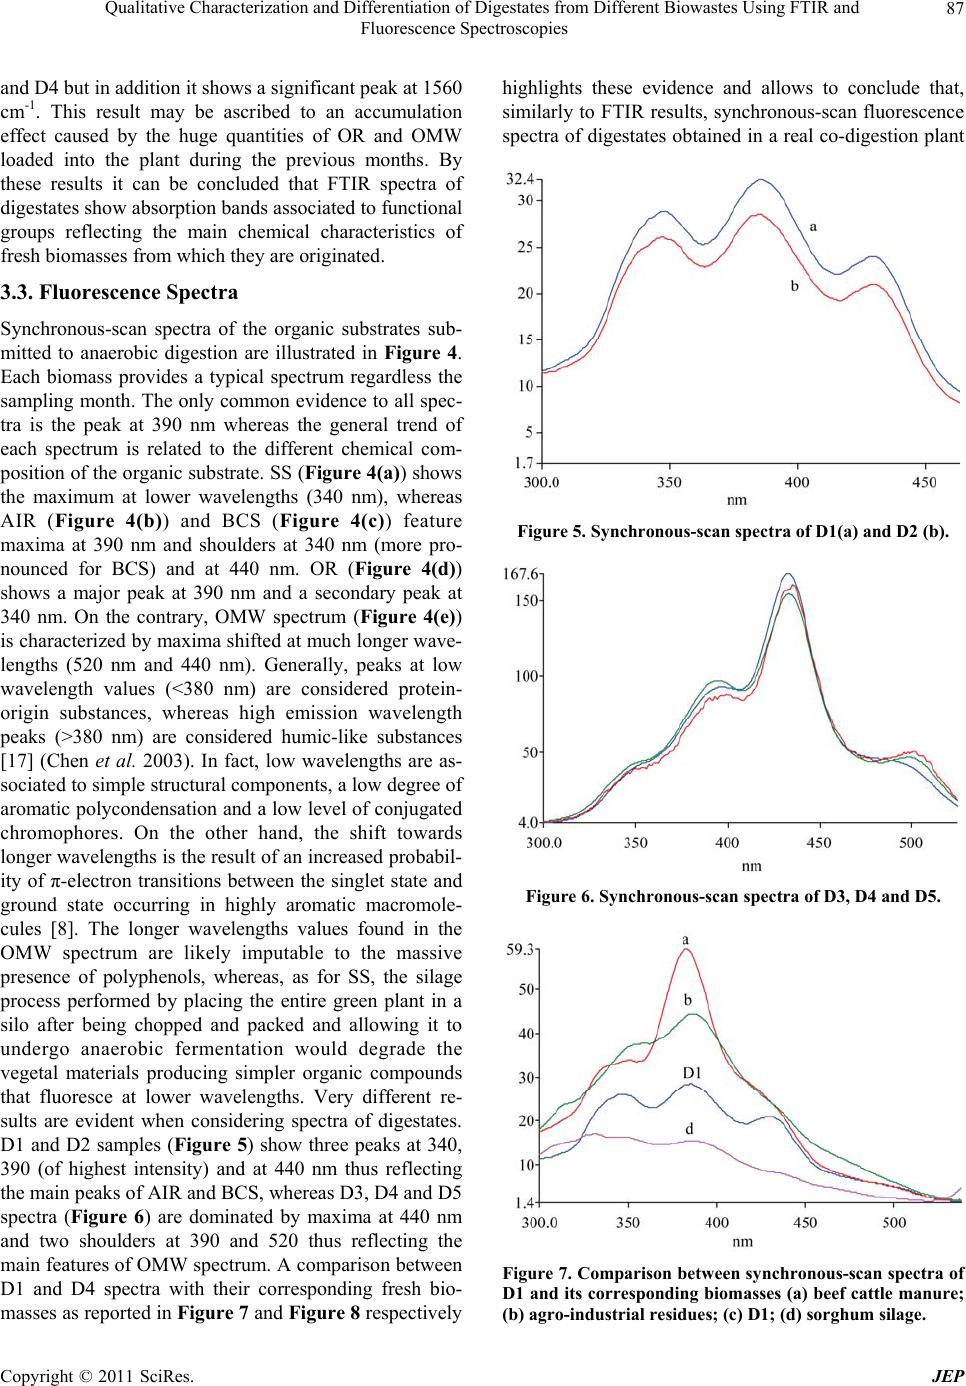 Qualitative Characterization and Differentiation of Digestates from Different Biowastes Using FTIR and 87 Fluorescence Spectroscopies and D4 but in addition it shows a significant peak at 1560 cm-1. This result may be ascribed to an accumulation effect caused by the huge quantities of OR and OMW loaded into the plant during the previous months. By these results it can be concluded that FTIR spectra of digestates show absorption bands associated to functional groups reflecting the main chemical characteristics of fresh biomasses from which they are originated. 3.3. Fluorescence Spectra Synchronous-scan spectra of the organic substrates sub- mitted to anaerobic digestion are illustrated in Figure 4. Each biomass provides a typical spectrum regardless the sampling month. The only common evidence to all spec- tra is the peak at 390 nm whereas the general trend of each spectrum is related to the different chemical com- position of the organic substrate. SS (Figure 4(a)) shows the maximum at lower wavelengths (340 nm), whereas AIR (Figure 4(b)) and BCS (Figure 4(c)) feature maxima at 390 nm and shoulders at 340 nm (more pro- nounced for BCS) and at 440 nm. OR (Figure 4(d)) shows a major peak at 390 nm and a secondary peak at 340 nm. On the contrary, OMW spectrum (Figure 4(e)) is characterized by maxima shifted at much longer wave- lengths (520 nm and 440 nm). Generally, peaks at low wavelength values (<380 nm) are considered protein- origin substances, whereas high emission wavelength peaks (>380 nm) are considered humic-like substances [17] (Chen et al. 2003). In fact, low wavelengths are as- sociated to simple structural components, a low degree of aromatic polycondensation and a low level of conjugated chromophores. On the other hand, the shift towards longer wavelengths is the result of an increased probabil- ity of π-electron transitions between the singlet state and ground state occurring in highly aromatic macromole- cules [8]. The longer wavelengths values found in the OMW spectrum are likely imputable to the massive presence of polyphenols, whereas, as for SS, the silage process performed by placing the entire green plant in a silo after being chopped and packed and allowing it to undergo anaerobic fermentation would degrade the vegetal materials producing simpler organic compounds that fluoresce at lower wavelengths. Very different re- sults are evident when considering spectra of digestates. D1 and D2 samples (Figure 5) show three peaks at 340, 390 (of highest intensity) and at 440 nm thus reflecting the main peaks of AIR and BCS, whereas D3, D4 and D5 spectra (Figure 6) are dominated by maxima at 440 nm and two shoulders at 390 and 520 thus reflecting the main features of OMW spectrum. A comparison between D1 and D4 spectra with their corresponding fresh bio- masses as reported in Figure 7 and Figure 8 respectively highlights these evidence and allows to conclude that, similarly to FTIR results, synchronous-scan fluorescence spectra of digestates obtained in a real co-digestion plant Figure 5. Synchronous-scan spectra of D1(a) and D2 (b). Figure 6. Synchronous-scan spectra of D3, D4 and D5. Figure 7. Comparison between synchronous-scan spectra of D1 and its corresponding biomasses (a) beef cattle manure; (b) agro-industrial residues; (c) D1; (d) sor ghum silage. Copyright © 2011 SciRes. JEP 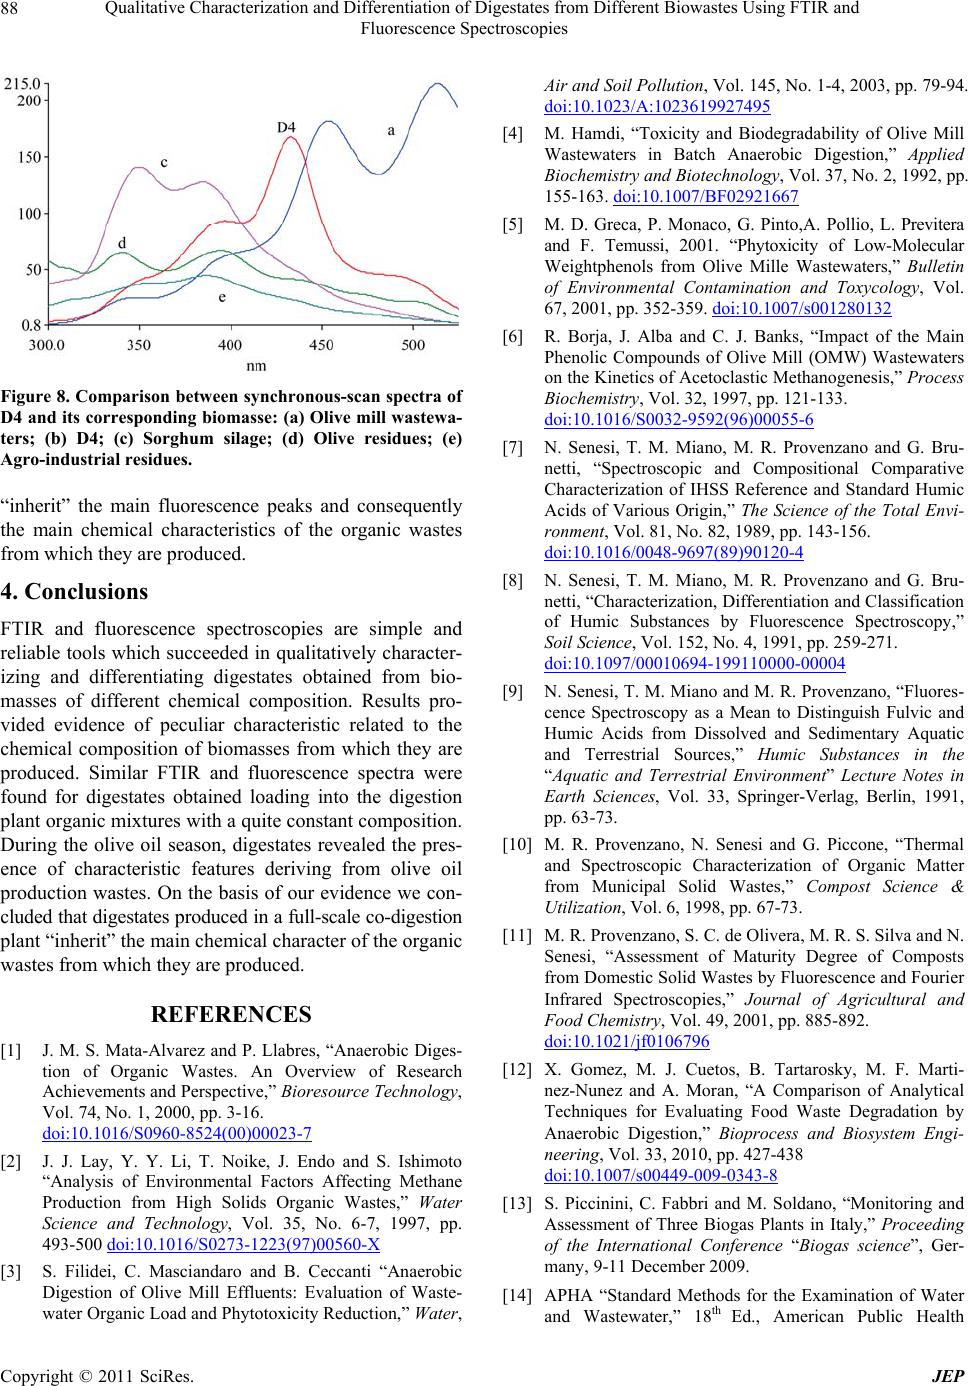 Qualitative Characterization and Differentiation of Digestates from Different Biowastes Using FTIR and 88 Fluorescence Spectroscopies Figure 8. Comparison between synchronous-scan spectra of D4 and its corresponding biomasse: (a) Olive mill wastewa- ters; (b) D4; (c) Sorghum silage; (d) Olive residues; (e) Agro-industrial residues. “inherit” the main fluorescence peaks and consequently the main chemical characteristics of the organic wastes from which they are produced. 4. Conclusions FTIR and fluorescence spectroscopies are simple and reliable tools which succeeded in qualitatively character- izing and differentiating digestates obtained from bio- masses of different chemical composition. Results pro- vided evidence of peculiar characteristic related to the chemical composition of biomasses from which they are produced. Similar FTIR and fluorescence spectra were found for digestates obtained loading into the digestion plant organic mixtures with a quite constant composition. During the olive oil season, digestates revealed the pres- ence of characteristic features deriving from olive oil production wastes. On the basis of our evidence we con- cluded that digestates produced in a full-scale co-digestion plant “inherit” the main chemical character of the organic wastes from which they are produced. REFERENCES [1] J. M. S. Mata-Alvarez and P. Llabres, “Anaerobic Diges- tion of Organic Wastes. An Overview of Research Achievements and Perspective,” Bioresource Technology, Vol. 74, No. 1, 2000, pp. 3-16. doi:10.1016/S0960-8524(00)00023-7 [2] J. J. Lay, Y. Y. Li, T. Noike, J. Endo and S. Ishimoto “Analysis of Environmental Factors Affecting Methane Production from High Solids Organic Wastes,” Water Science and Technology, Vol. 35, No. 6-7, 1997, pp. 493-500 doi:10.1016/S0273-1223(97)00560-X [3] S. Filidei, C. Masciandaro and B. Ceccanti “Anaerobic Digestion of Olive Mill Effluents: Evaluation of Waste- water Organic Load and Phytotoxicity Reduction,” Water, Air and Soil Pollution, Vol. 145, No. 1-4, 2003, pp. 79-94. doi:10.1023/A:1023619927495 [4] M. Hamdi, “Toxicity and Biodegradability of Olive Mill Wastewaters in Batch Anaerobic Digestion,” Applied Biochemistry and Biotechnology, Vol. 37, No. 2, 1992, pp. 155-163. doi:10.1007/BF02921667 [5] M. D. Greca, P. Monaco, G. Pinto,A. Pollio, L. Previtera and F. Temussi, 2001. “Phytoxicity of Low-Molecular Weightphenols from Olive Mille Wastewaters,” Bulletin of Environmental Contamination and Toxycology, Vol. 67, 2001, pp. 352-359. doi:10.1007/s001280132 [6] R. Borja, J. Alba and C. J. Banks, “Impact of the Main Phenolic Compounds of Olive Mill (OMW) Wastewaters on the Kinetics of Acetoclastic Methanogenesis,” Process Biochemistry, Vol. 32, 1997, pp. 121-133. doi:10.1016/S0032-9592(96)00055-6 [7] N. Senesi, T. M. Miano, M. R. Provenzano and G. Bru- netti, “Spectroscopic and Compositional Comparative Characterization of IHSS Reference and Standard Humic Acids of Various Origin,” The Science of the Total Envi- ronment, Vol. 81, No. 82, 1989, pp. 143-156. doi:10.1016/0048-9697(89)90120-4 [8] N. Senesi, T. M. Miano, M. R. Provenzano and G. Bru- netti, “Characterization, Differentiation and Classification of Humic Substances by Fluorescence Spectroscopy,” Soil Science, Vol. 152, No. 4, 1991, pp. 259-271. doi:10.1097/00010694-199110000-00004 [9] N. Senesi, T. M. Miano and M. R. Provenzano, “Fluores- cence Spectroscopy as a Mean to Distinguish Fulvic and Humic Acids from Dissolved and Sedimentary Aquatic and Terrestrial Sources,” Humic Substances in the “Aquatic and Terrestrial Environment” Lecture Notes in Earth Sciences, Vol. 33, Springer-Verlag, Berlin, 1991, pp. 63-73. [10] M. R. Provenzano, N. Senesi and G. Piccone, “Thermal and Spectroscopic Characterization of Organic Matter from Municipal Solid Wastes,” Compost Science & Utilization, Vol. 6, 1998, pp. 67-73. [11] M. R. Provenzano, S. C. de Olivera, M. R. S. Silva and N. Senesi, “Assessment of Maturity Degree of Composts from Domestic Solid Wastes by Fluorescence and Fourier Infrared Spectroscopies,” Journal of Agricultural and Food Chemistry, Vol. 49, 2001, pp. 885-892. doi:10.1021/jf0106796 [12] X. Gomez, M. J. Cuetos, B. Tartarosky, M. F. Marti- nez-Nunez and A. Moran, “A Comparison of Analytical Techniques for Evaluating Food Waste Degradation by Anaerobic Digestion,” Bioprocess and Biosystem Engi- neering, Vol. 33, 2010, pp. 427-438 doi:10.1007/s00449-009-0343-8 [13] S. Piccinini, C. Fabbri and M. Soldano, “Monitoring and Assessment of Three Biogas Plants in Italy,” Proceeding of the International Conference “Biogas science”, Ger- many, 9-11 December 2009. [14] APHA “Standard Methods for the Examination of Water and Wastewater,” 18th Ed., American Public Health Copyright © 2011 SciRes. JEP  Qualitative Characterization and Differentiation of Digestates from Different Biowastes Using FTIR and Fluorescence Spectroscopies Copyright © 2011 SciRes. JEP 89 Association, Washington, DC, USA, 1992. [15] IRSA CNR “Metodi Analitici per le Acque,” Quaderni, Istituto Politecnico e Zecca dello Stato, Rome, Italy, 1994. [16] T. M. Miano and N. Senesi, “Synchronous Excitation Fluorescence Spectroscopy Applied to Soil Humic Sub- stances Chemistry,” The Science of the Total Environ- ment, Vol. 117, No. 118, 1992, pp. 41-51. doi:10.1016/0048-9697(92)90071-Y [17] X. Melamane, R. Tandlich and J. Burgess, “Anaerobic Digestion of Fungally Pre-Treated Wine Distillery Waste- water,” African Journal of Biotechnology, Vol. 6, No. 17, 2007, pp. 1990-1993 [18] W. Chen, P. Westerhoff, J. A. Leeheer and K. Booksh, “Fluorescence Excitation-Emission Matrix Regional In- tegration to Quantify Spectra for Dissolved Organic Mat- ter,” Environmental Science & Technology, Vol. 37, 2003, pp. 5701-5710. doi:10.1021/es034354c |