

Paper Menu >>
Journal Menu >>
 Journal of Computer and Communications, 2014, 2, 57-63 Published Online January 2014 (http://www.scirp.org/journal/jcc) http://dx.doi.org/10.4236/jcc.2014.22011 OPEN ACCESS JCC An Experimental System Development for Head Posture Estimation Based on 3-D Images Measurement Chen Xu, Cunwei Lu Department of Information Electronics, Fukuoka Institute of Technology, Fukuoka, Japan. Email: [email protected]; [email protected] Received November 2013 ABSTRACT Although automobile is an indispensable vehicle to modern life, it also serves as a social problem with a big traf- fic accident. Among the reasons of traffic accidents, careless driving accounts for the largest part. So in order to avoid the careless driving, a system which can measure the posture of a driver and warns driver to drive care- fully in the case of looking aside is necessary. Although the image measurement method is used broadly, there is a problem on which measurement accuracy is influenced by environment light, makeup of the driver, etc. in the general method based on the two-dimensional image. Therefore, in this study, we propose an image measure- ment method to obtain the head posture of driver. First we use three-dimensional measurement method which based on the infrared pattern projection to get 3-D information of head, and then we calculate the angle for faces. In this paper, we explain the composition method of an experiment system, and the results of head posture mea- surement experiment. KEYWORDS Careless Drivi ng ; 3-D Image Measurement; Infrared Pattern Projection; Head Posture Estimation 1. Introduction Although automobile is an indispensable vehicle to mod- ern life, it also serves as a social problem with a big traf- fic accident. Figure 1 shows the statistics of the causes of traffic accidents in 2012 from the Japan Metropolitan Police Department. It shows that in violation of the rules of safe driving is 58.4%. Among them, 30.5% are haphazard driving, and safety careless driving accounted for 16.7% [1]. In order to prevent such problems, it is necessary that the driver bear in mind the safe driving consciously. But it can’t keep safe driving according to psychological fac- tors and physical factors. Therefore, a system which can warn the driver and determine the operating conditions in an objective way is necessary. In recent years, techniques for measuring and quantita- tive evaluation whether the driver is looking aside from the outside have been proposed. There are two methods about the careless driving judgment, one is mainly ac- cording to the viewing direction of the driver, another is according to the face direction of the driver. The first method is taking a 2-D color image of the driver’s face [2]. Through the position of the pupil and the iris of eye, the sight line can be detected. However, this method can’t detect the face direction which is ne- cessary in the judgment of careless driving. The second method is extracting the main parts of the face such as the eyes or mouth [3]. And then use the position rela- tionship to detect the face direction. However, it only can detect the face direction between -15 degrees and 15 de- grees, it is too narrow. Besides the two methods, there are many other problems when using C color image, such as the change of environment light, the detection of the face or eyes, the speed problem of calculation, etc. In order to solve those problems and to build a usable measurement system of head posture of driver, in this study, we propose a 3-D measurement technique based on the infrared pattern projection, and we develop an experimental system to verify the validity of the proposal technique [4,5]. 2. Theoretical Method Before detecting the rotation angle, we should think about the rapidity and reliability of the method, the in- fluence of the driver and so on. So in this study, to im- prove the 3-D measurement speed, slit pattern is used. 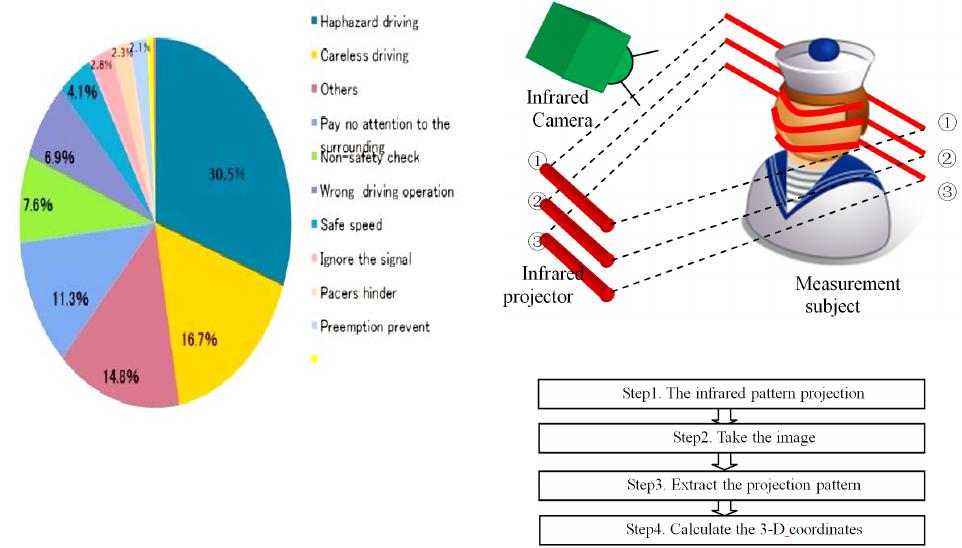 An Experimental System Development for Head Posture Estimation based on 3-D Images Measurement OPEN ACCESS JCC 58 Figure 1. The traffic accidents reasons scale drawing. Slit pattern also has the advantage of simple structure and high precision. In the study, I use the pattern which is projected on the nose, so to make sure that there must have one projected on the nose, more than one patterns are needed. But too many patterns will cost more time. So, 3 patterns are just enough to achieve the rapidity and reliability. And to avoid the influence on the driver, infrared pattern projection is used. In this section, we will introduce the 3-D measurement and the head posture estimation method. 2.1. 3-D Feature Measurement Based Infrared Slit Pattern Projection This part describes a 3-D feature measurement method using infrared slit pattern projection method. Figure 2 shows a schematic of the 3-D feature mea- surement which is used in the study. It is composed of an infrared camera and infrared pro- jector. Firstly, we use the infrared projector projected the infrared pattern onto the target object and captured by an infrared camera. Then, we extract the patterns from the observed images which are obtained. At last, we can calculate the 3-D coordinates by using the principle of triangulation from the position information of patterns which is extracted and the positional relationship of infrared projector and infrared camera. Figure 3 shows the steps of 3-D measurement. 1) The infrared pattern projection In the experiment, we use the information of the pat- tern which is projected on people’s nose. So we should make sure that the pattern is must projected on the nose. When we use only one pattern, it is possible that no one is projected on the nose because of the movement of people’s face. This problem can be solved by increasing Figure 2. A block diagram of the proposed system. Figure 3. The steps of 3-D measurement. the number of the projected slit patterns, but it can be extracted fast and stable when the number of the patterns is small. So in this study, we use 3 slit patterns projected on the driver’s face. Besides it, when we use the visible light, it will affect the driver’s driving, and the color characteristics of the image can’t respond to changes of ambient light rapidly. For these problems, we use infra- red slit patterns proj ection. Figure 4 shows the observed image, (a) and (b) is the image by a normal camera and an infrared camera re- spectively. 2) Take the image After projected the infrared slit patterns on people’s face, we use the infrared camera to take photos. Figure 5 shows the observed pattern images of each face direction. 3) Extract the projection pattern After obtain the observed images, we should extract the projection pattern. In this study, we use binarization method in appropriate threshold values [6]. Figure 6 shows the extracted pattern images of each face direc- tion. 4) Calculate the 3-Dcoordinates After we extract the projection pattern, we should cal- culate the 3-D coordinates of the pattern. In the vertical stereo, using the actual angle of the center coordinates in the vertical direction of the ex- tracted pattern which is (x1, y1) and the actual projection angle of the infrared projectors which is (x2, y2) to calcu- late the center coordinates of 3-D coordinates which is 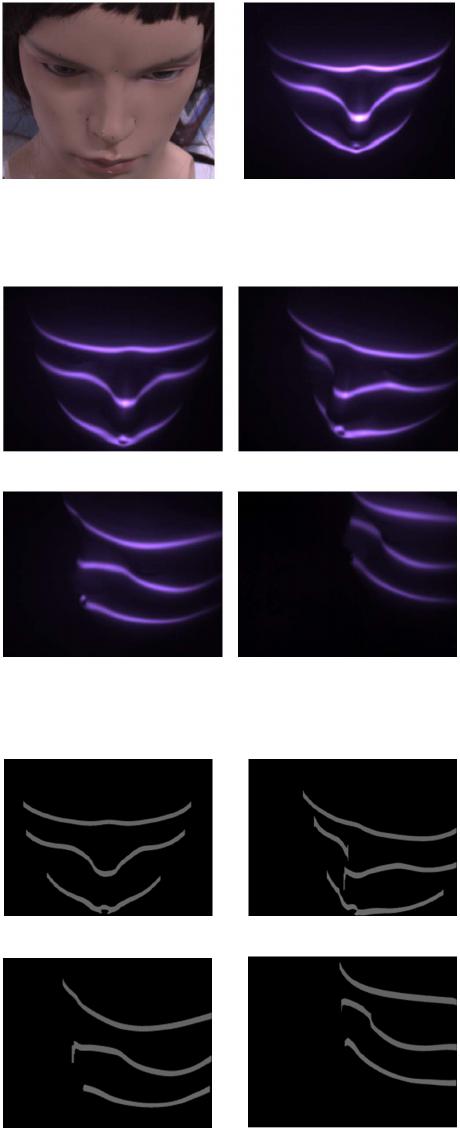 An Experimental System Development for Head Posture Estimation based on 3-D Images Measurement OPEN ACCESS JCC 59 (a) (b) Figure 4. The observed image. (a) Use normal camera; (b) Use infrared camera. (a) (b) (c) (d) Figure 5. The observed images of each face direction. (a) 0˚; (b) 30˚; (c) 60˚; (d) 90˚. (a) (b) (c) (d) Figure 6. The extracted pattern images of each face direc- tion. (a) 0˚; (b) 30˚; (c) 60˚; (d) 90˚. (X,Y,Z) according to the principle of triangulation. The formula is as follows: where, d is the distance between the projector and the camera, and f is the focal length of the camera 2.2. Determination of the Head Posture In the 2.1 part, we have said that there must have one pattern projected on people’s nos e, then how to make sure of it will be introduced in this part. And in this part, we will also introduce a way of the determination of the head posture. Firstly, we should mark each pattern; secondly, we should extract one which is projected on the nose; thirdly, we should calculate the 3-D form to fit a straight line and calculate the slope; at last, we should simulate a d iagram about the slope and the rotation angle. Figure 7 shows the steps of the face direction estima- tion. 1) Mark the pattern Firstly, scan the pattern from the start to the end, and then we can obtain the number of the pattern. The num- ber is three. From the first place where the 3 points oc- curred in the same column, we scan the image again, and then mark the pattern from the top to bottom. The first pattern is red, the second is green, and the last one is blue. 2) Extract the pattern which is projected on the nose After mark the pattern, we should extract one which is projected on the nose. The pattern includes nose which is convex and cheek which is concave. So detecting a con- cave portion and a convex portion of 3-D coordinates of each pattern, we can extract the pattern through the number of convex portions and concave portions. The detection of the uneven portion is by using first deriva- tive and second derivative. Figure 8 shows detection principle of the uneven part. Pattern A is projected on the forehead which has three convex-concave portions. Pattern B is projected on the nose which has five co nv ex-concave portions. Pattern C is projected on the chin which has one convex-concave portions. Pattern B which has the largest number of the convex portions and concave portions is the one which projected on the nose. Figure 9 shows judgment images of each face direc- tion. 3) Calculate the 3-D form to fit a straight line and cal- culate the slope After we got the pattern which is projected on the nose, we should use principle of triangulation to calculate the 3-D coordinate of the pattern, and use the 3-D coordinate to fit a straight line. When the degree is more than 20 degrees, we can only detect one side of the pattern, and then we use all of the information to fit a straight line without any judgment which can reduce the computation time. When the degree is between 0 degree and 20 degrees, the pattern has both sides of the pattern, and then we choose one side of the 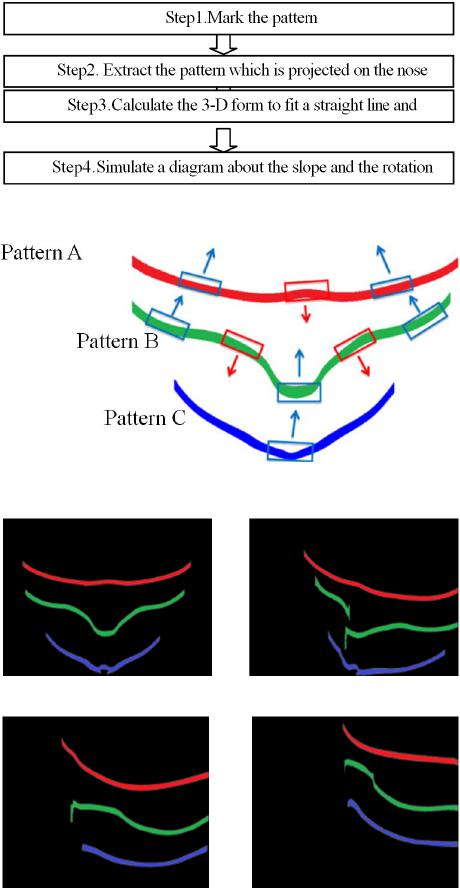 An Experimental System Development for Head Posture Estimation based on 3-D Images Measurement OPEN ACCESS JCC 60 Figure 7. The steps of the face direction estimation. Figure 8. Detection principle of the uneven parts. (a) (b) (c) (d) Figure 9. The judgment images of each face direction. (a) 0˚; (b) 30˚; (c) 60˚; (d) 90˚. pattern which has more information to fit a straight line. When it is 0 degree, we also can get both sides which are the same, so we can get any side of the pattern to fit a straight line. Figure 10 shows fitting straight line images of each face direction. The blue line is the pattern which is pro- jected on the nose, and the red line is the straight line. After we got the fitting straight lines, we can obtain the slope of the straight line easily. 4) Simulate a diagram about the slope and the rotation angle After we got the slope of each straight line, we will find that there is a certain relationship between the slope and the rotation angle. As the angle increases, the slope becomes smaller. Using the least squares method, we can find that their relationship is a straight line. Figure 11 shows the relationship schema about the slope and the rotation angle. 3. Experiment System Development In order to verify the effectiveness of the proposed me- thod, we construct an experimental system. The system is constituted by camera, mannequin, infrared projector and software system. To avoid the influence of ambient light, we use an infrared camera. To avoid the influence on driver, we use an infrared projector. And we use c# to build a software interface. By the system, firstly, we should input the user's login information; secondly, take image of the mannequin by the infrared camera in real time; at last, use the experi- mental system to calculate the rotation degree and deter- mine whether the driver is careless driving. Fig ure 12 shows the steps of experiment. 3.1. Input the User's Login Information Everyone's face is different. Some people's faces are rel- atively small, some large, some long, some round. Therefore, as described in section 2.2, the linear rela- tionship between the curves and angles is different to everyone, so we should input the user’s information be- fore we use it. 3.2. Take Image in Real Time In the experiment, we use a camera which has the focal length of 6mm. The image resolution is 1024 * 768 pix- els. The infrared projector is Industrial Luminar Ace LA-100 IR. The mannequin is made of reinforced plastic and the height is 36cm, the head circumference is 54cm. 3.3. Calculate the Rotation Degree and Judgment After input the login information, we should use the in- terface to calculate the rotation degree and determine whether the driver is careless driving. Figure 13 shows an envisioned system interface design which has follow- ing functions: initial data entry, start and judgment. When you press the button “Start”, the system begin running. If the driver is normal driving, it will show “Normal driving”; if the driver is looking something for a long time, it will show “Please attention and look ahead”; if the driver is rotate a large angle, it will show “Warning! You are careless driving now” and remind the driver that he may cause an accident. But now we still cannot make sure the critical angle of careless driving, so we only can set an adjuster. F igure 14 shows the running result fig-  An Experimental System Development for Head Posture Estimation based on 3-D Images Measurement OPEN ACCESS JCC 61 (a) (b) (c) (d) Figure 10. Fitting straight lines of each face direction. (a) 0˚; (b) 30˚; (c) 60˚; (d) 90˚. Figure 11. The relationship about slope and rotation angle. Figure 12. The steps of experiment. ures. If the experimental system is proved that it is feasible to determine whether the driver is careless driving, we can make the actual software to use in the real life. 4. Experimental Results of the Angle Detection In the experiment, we use a mannequin and a rotation  An Experimental System Development for Head Posture Estimation based on 3-D Images Measurement OPEN ACCESS JCC 62 Figure 13. Envisioned system interface design. stage, the mannequin is put on the rotation stage. The true value of rotation angle is determined by the rotation of the rotating stage. We use the theoretical value to compare with the experiment value and we can examine the error. The angle of rotation was measured between −90˚ and 90˚. Table 1 is a summary of the face direction estimation experimental results. The theoretical value and experi- ment value of the rotation angle can be seen in the Ta- ble.1.In the experiment, the model is controlled to turn left or turn right from 0 degree to 90 degrees at the inter- val of 10 degrees. θ is theoretical value, θ1 is experiment value, θ ∆ is error value and t is the calculate time from read the image to observe the rotation degree. It can be seen that the average error of the rotation angle is 2.2 degrees. The maximum error is 9 degrees. When the face turn to 90 degrees, the error is large, that is because the information of the 90 degrees pattern is less. The time of whole experiment can be divided into two parts, which is taking photos and calculating the degree. The time of taking photos is based on the exposure time and the transmission time of image, and in my experi- ment, the time of taking photos is 116 milliseconds. And the calculating time is shown in the Table.1. The average of calculating time is 29.8 milliseconds by using ordinary computer. The CPU of computer we used is RTM i5- 3570, and the main frequent is 3.4 GHz. 5. Conclusion From the causes of traffic accidents, we can see that it is important to avoid the careless driving. For it, we pro- posed the method to calculate whether the driver is care- less driving. And we build an experimental system which can prove the correctness of our methods. In this study, first to improve the 3-Dmeasurement speed, slit pattern is used. And to prevent the influence of projection light on the driver and the influence of the ambient light, 3 infrared pattern projections are used. In the experiment, the model is controlled to turn left or turn right from 0 degree to 90 degrees at the interval of 10 degrees. The average error is 2.2 degrees. It is possible that measurement and processing speed of the proposed technique are usable. (a) (b) (c) Figure 14. Running result figures. (a) Careless driving; (b) Attention; (c) Normal driving.  An Experimental System Development for Head Posture Estimation based on 3-D Images Measurement OPEN ACCESS JCC 63 Table 1. The summary of the face direction estimation experimental results. θ −90 −80 −70 −60 −50 −40 −30 −20 −10 0 10 20 30 40 50 60 70 80 90 θ1 −86 −80 −66 −63 −53 −42 −30 −18 −9 0 11 22 31 41 50 56 66 81 99 ∆ θ 4 0 4 −3 −3 −2 0 2 1 0 1 2 1 1 0 −4 −4 1 9 t(ms) 30 30 31 32 32 32 34 33 33 32 32 33 32 31 30 31 30 29 30 But in this study, we still use the mannequin to detect the face direction, so in the future, we will use the real people to do the experiment and make a reliable system used in real life. REFERENCES [1] Occurrence of traffic accidents during the year Heisei 24, Police Department, 2013. http://www.keishicho.metro.tokyo.jp/anzen/sub5 [2] M. Yuji, U. Li, “A Study on Delay Prediction of Driver’s Reaction Time by Using the Eye-Opening Rate Mea- surement,” Society of Automotive Engineers Proceedings, Vol. 41-46, 2010, pp. 1445-1450. [3] J. Kasugai, J. Lin, T. Naito, K. Ogawa, S. Ishiguro Hiro- shi, et al., “New Technology Face Orientation Detection Sys te m,” Aisin Technical Report, Vol. 11, 2007, pp. 15- 19. [4] S. Iguchi and S. Kosuke, “Three-Dimensional Image Measurement,” Shokodo, 1990. [5] G. K. Cho and C. W. Lu, “3-D Measurement System Practical Fully Automatic Based on the Pattern Projected Self-Regulation,” Institute of Electrical Engineers Jour- nal C, Vol. 127, No. 4, 2007, pp. 561-567. [6] K. M. Wang, S. D. Zhu and C. Zhang, “Comparative Study about the Method of Automatically Select the Threshold,” Journal Fushun Petroleum Institute, Vol. 22, No. 2, 2002, pp. 69-73. |