

Paper Menu >>
Journal Menu >>
 Journal of Computer and Communications, 2014, 2, 8-13 Published Online January 2014 (http://www.scirp.org/journal/jcc) http://dx.doi.org/10.4236/jcc.2014.22002 OPEN ACCESS JCC Monitoring the Sewage Draining in Shenzhen Reservoirs Using Hyperspectral Data Yin Li1, Wei Pan1, Xiaomao Yang2, Qinglin Tian1 1CNNC Beijing Research Institute of Uranium Geology (BRIUG), Beijing, China; 2College of Environmental Sciences and Engi- neering, Peking University, Beijing, China. Email: [email protected] Received September 2013 ABSTRACT Freshwater resources are regarded as the foundation of urban development and assure the sustainable prosper- ity of the city. The contaminations of fresh water in reservoirs can threaten safety of people directly and force the Industrial processes to be suspended. Therefore, developing a method to detect the potential locations where contaminated water drains off into the reservoirs efficiently and precisely is a challenging task but in urgent need. In this research, we used the air-borne sensor Hymap to get the hyperspectral data of Shenzhen. Finally we find a way to invert five water quality parameters (Suspended Solid (SS), Total Nitrogen (TN), Total Phosphorus (TP), Chemical Oxygen Demand (COD), Biochemical Oxygen Demand (BOD5)) from the Hymap image and we distinguish the clear water and polluted water on the image successfully. KEYWORDS Hyperspectral; Water; Hymap; Shenzhen Reservoirs 1. Introduction Shenzhen is a modern international metropolis with de- veloped industrial and densely population. Freshwater resources are regarded as the foundation of Urban de- velopment and assure the sustainable prosperity of the city. The contaminations of fresh water in reservoirs can threaten safety of people directly and force the Industrial processes to be suspended. There are 171 reservoirs and 396 pound s in Shenzhen, 17 of the reservoirs are middle size. Total capacity is 611 million cubic meters, each year to provide 350 million cubic meters of drinking wa- ter. Although the enormous amounts of water in the re- servoirs, the per capita is less than 200 cubic meters, about 1/12 of the national rate. It’s an urgent task to pre- vent contamination of existing freshwater resources. There are so many reservoirs in Shenzhen that it’s too difficult to monitor the sewage draining in Shenzhen reservoirs by manual effort. The reservoirs in Shenzhen are surrounded by a large number of farms and industrial parks; a way to monitor the sewage draining quickly and effectively is in urgent need [1-3]. Monitoring water quality by remote sensing has grad- ually developed from qualitative to quantitative and the number of parameters is increasing. We can invert Chlo- rophyll a, suspended solids, yellow substance, transpa- rency, turbidity, water temperature, etc., and the retrieval accuracy continues to improve [4]. 2. Data and Process 2.1. Data We get 34 water samples for this paper, 14 of them are clear water and the other 20 of them are contaminated. The locations of the samples are widespread in Shenzhen and typically in the inlet, centre or outlet of the reservoirs. Collecting time is October 31 to November 7, a period of eight days. Recode the locations of the 34 water samples by GPS (the detail is shown in Figure 1), take note of water transparency, water depth, surface temperature and other related data. We had performed a chemical analysis on those water samples (Including SS, TP, TN, BOD5 and COD etc.). See Table 1 below for details. We used ASD Fieldspce (R) Pro to measure the spec- trums of the sample when we collected the samples. ASD Fieldspce (R) Pro can measure continually the spectrums from 350 nm to 2500 nm, the spectral resolution is 1 nm and the number of output bands is 2501. The process measurement was in clear, calm days. We take ten spec- trums for each sample, then take the average as the orig- 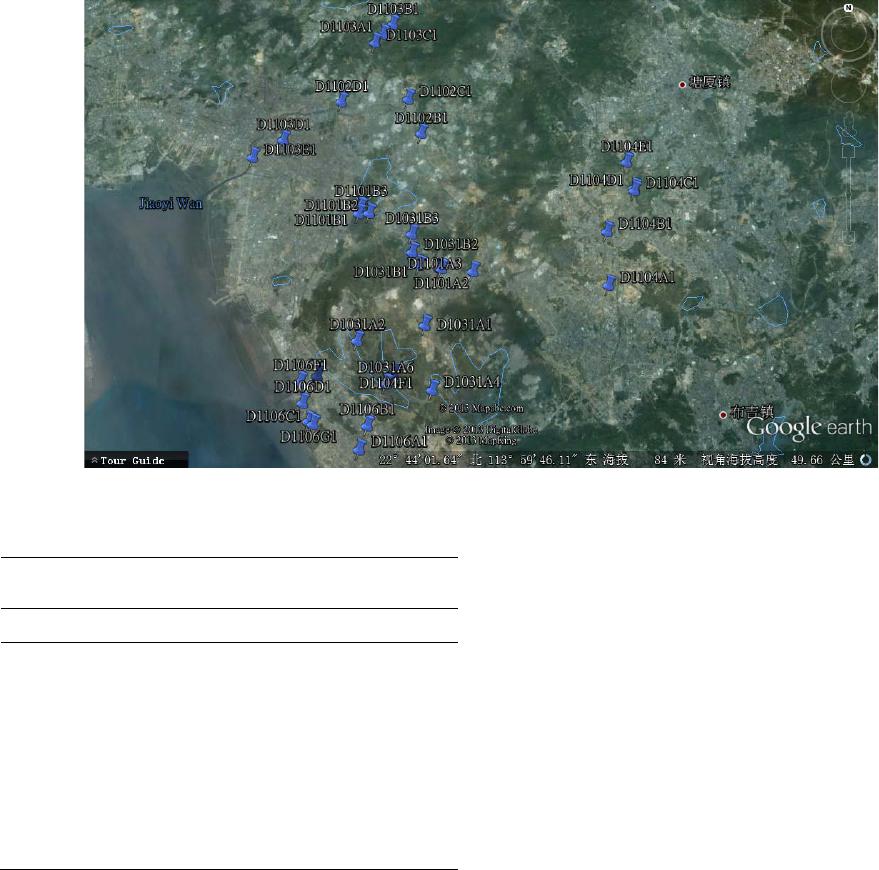 Monitoring the Sewage Draining in Shenzhen Reservoirs Using Hyperspectral Data OPEN ACCESS JCC 9 Figure 1. The locations of the 34 samples. Table 1. Detail of the Biochemical parameters of samples. Biochemical parameters Clear water Polluted water mean max min me a n ma x min CODcr Cr6+ Cu Zn Ni Cyanide SS AN TN BOD5 TP 24.01 _ _ _ _ _ _ _ _ _ _ _ _ _ _ _ 17.64 1.88 5.47 5.59 0.17 43.3 _ _ _ _ _ _ _ _ _ _ _ _ _ _ _ 31 12.1 18.4 10.7 0.73 11.6 _ _ _ _ _ _ _ _ _ _ _ _ _ _ _ 8 0.25 1.67 2.01 0.025 188.71 0.022 0.52 0.27 0.47 0.052 108.85 23.27 29.93 41.09 3.38 419 0.051 3.09 0.78 3.95 0.211 767 43 50.2 90.2 6.1 71.5 0.007 0.061 0.025 0.08 0.005 29 7 10.6 16.7 0.539 inal reflective spectrum of the sample. The data got by ASD is synchronous Hymap data, which has 128 bands, continue from 400 nm to 2500 nm. The spectral resolu- tion of Hymap is 15 ~ 18 nm. 2.2. Processing of Data Due to the spectrometer response differently in each band, there is some noise in the original reflective spec- trums. The original reflective spectrums were smoothed by Mean Filter and the spectrum in 350 nm to 1300 nm has been selected to be regarded the spectrum of the samples. The details of the spectrum are show in the Figure 2 below. 2.3. Spectrum Analysis The most important influencing factors on inland water spectrum are chlorophyll a and suspended solids, other parameters are difficult to find independent spectral cha- racteristics, we need extra information of the relationship between different elements and invert them by remote sensing indirectly. Derivative spectrum can be mathematically calculated from reflective spectrum. It shows the positions of min- imum and the maximum bending point in reflection spectrums. Research shows that derivative spectrum is very sensitive to signal to noise ratio of the spectrum, but it’s less sensitive to signal to noise ratio in lower differ- ence, and it widely used in practical application. The re- sult of correlation analysis is showed in the figures (Fig- ures 3 and 4) below . The figures show that the all six parameters (SS, TN, AN, BOD5, TP, COD) have low correlations with all the original reflective spectrum bands, but the some of them have a high correlation with the derivative spectrum bands. The derivative spectrum has a strong ability to invert water parameters, but the derivative spectrum must be calculated from high spectral resolution spectrum data. To monitor the sewage draining quickly and efficiently, we need to use the airborne or satellitic remote sensing, but the spectrums get from aircrafts can’t have a high spectral resolution like ASD, so the idea that getting in- formation from derivative spectrum doesn’t work. The figure also shows five parameters (SS, TN, BOD5, TP, COD) have some consistent correlation with the de- rivative spectrum bands, In band 150, band 200 and some other bands, the correlation is significantly higher than others. It indicates the five parameters have comprehen- sive representations in some range of the spectrum. In 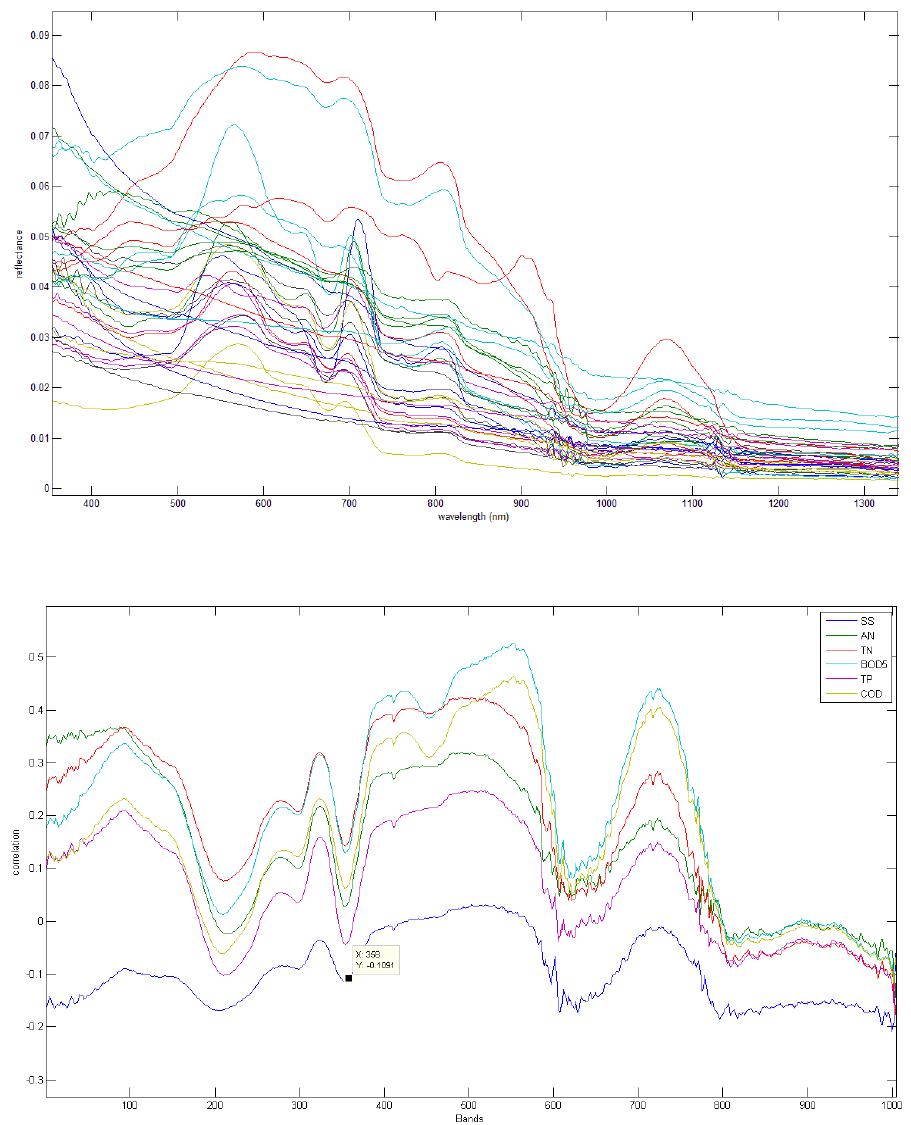 Monitoring the Sewage Draining in Shenzhen Reservoirs Using Hyperspectral Data OPEN ACCESS JCC 10 Figure 2. Spectrum of the samples. Figure 3. Correlations with original reflective spectrum bands. this study, we choose six obvious reflective (or absorp- tive) peaks. The detail is shown below in Table 2. Count all the area of the six peaks in the 34 original reflective spectrums, choose ten spectrums randomly, build simultaneous equation with the peaks area and the all six parameters, then use the model to approach the parameters of the 34 samples. The result is given in the Figure 5 below. The figures show that the approach works well except AN. This way can be used in invert the parameters of the 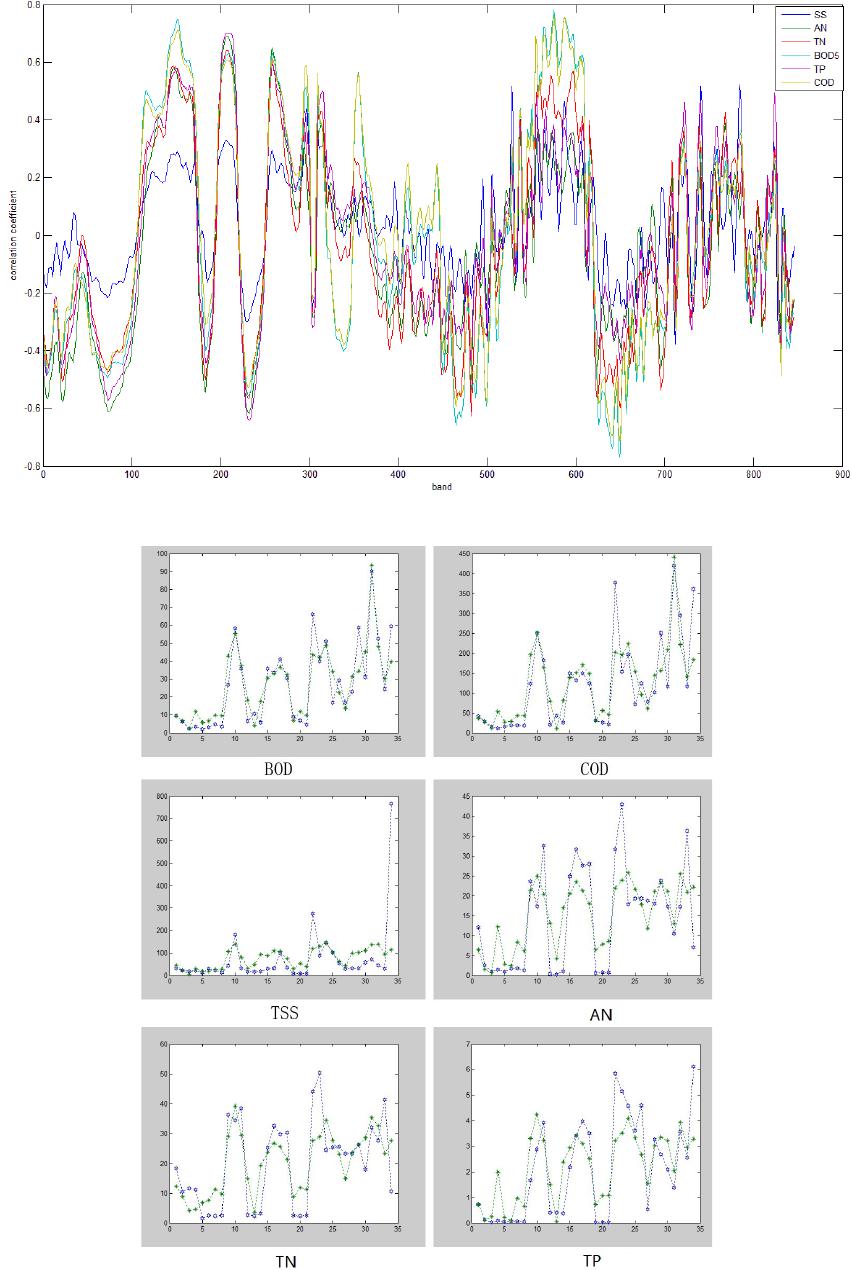 Monitoring the Sewage Draining in Shenzhen Reservoirs Using Hyperspectral Data OPEN ACCESS JCC 11 Figure 4. Correlations with original reflective spectrum bands. Figure 5. Result of approach the parameters. a. Sample of a Table footnote. 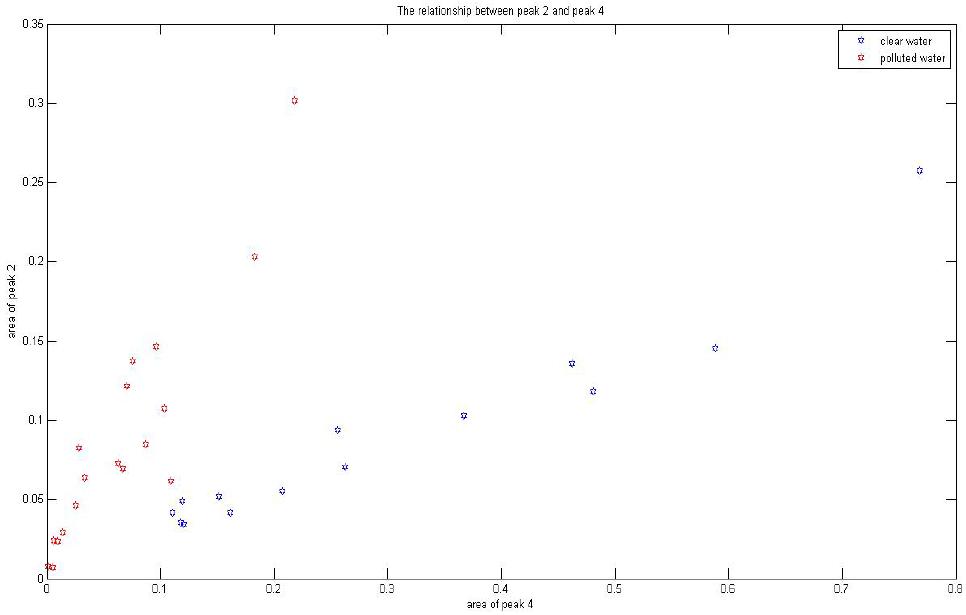 Monitoring the Sewage Draining in Shenzhen Reservoirs Using Hyperspectral Data OPEN ACCESS JCC 12 water. Analyze the relationship between with the area of the six peaks, the result indicates the peak 2 (from 684 nm to 706 nm) and the peak 4 (from 783 nm to 834 nm) can be used to distinguish the polluted water and the clear water. As the Figure 6 show s that the clear water and polluted water are located separately, almost in two lines. It means that we can use an index calculated from the airborne or satellitic data. 2.4. Image Analysis Use the GPS information of the 34 samples to find the corresponding Hymap data. Because of the lower spec- tral resolution and the influence of the atmosphere, the spectrums of the samples are different with the data get by ASD at some wavelength. The peak from 757 nm to 767 nm and the peak from 988 nm to 1155 nm do show in the spectrums get from the Hymap image, but the peak 2 and peak 4 are still obvious in the Hymap spectrums. Using the band 25, band 26, band 27, band 18, band 19 and band 20 to calculate the area of peak 2 and peak 4 and using the ratio of area of peak 2 to area of peak 4 as the index to distinguish the clear water and polluted wa- ter. The results are shown below. The red points indicate the locations of polluted water. As the Figure 7 sh ow s, we can identify the inlet of the polluted water quickly and efficiently and it is also useful in detecting the small inlet which is too small to find by eyes. 3. Conclusion Because of the complex aquatic environment of Shenz- hen, SS, TN, AN, BOD5, TP and COD are not composed of certain particles, they don’t have any certain spectral characteristics. For all six parameters have low correla- tions with all the original reflective spectrum bands, we can’t use any single bands or ratio of two bands to invert those parameters quantitatively. Derivative spectrum is sensitive to the changes in the proportion of SS, TN, AN, BOD5, TP and COD, some bands have high correlations with the five parameters, it can work well with data that have high signal to noise ratio and high spectral resolu- tion, but we need to further study how to use this tech- nique on Hymap image. The area of the six peaks can be used for inverting the proportion of SS, TN, AN, BOD 5, TP and COD accurately; it can work effectively in mon- itoring the sewage draining in Shenzhen reservoirs; the physical significance of this technique needs further study. The ratio of area of peak 2 to area of peak 4 is effective in distinguishing the polluted water and clear Figure 6. The relationship between peak 2 and peak 4. a. Clear water are shown by blue points and polluted water are shown by red points.  Monitoring the Sewage Draining in Shenzhen Reservoirs Using Hyperspectral Data OPEN ACCESS JCC 13 (a) (b) (c) (d) (e) Figure 7. The result of image analysis. Table 2. Detail of the peaks. Reflective peaks Centre point (nm) Begin point (nm) End point (nm) 1 561 510 617 706 684 730 760 757 767 807 783 834 1068 988 1155 675 648 700 water, it can be used on Hymap image successfully, and it’s a quick and effective way to monitor the sewage draining in Shenzhen reservoirs. REFERENCES [1] H. T. Duan, L. Yu and B. Zhang, “Hyperspectral Data Applied in Monitoring and Evaluating the Water Trophic State of Lake Chagan,” Acta Scientiae Circumstantiae, Vol. 26, No. 7, 2006, pp. 1219-1226. [2] S. J. Li and X. J. Wang, “The Spectral Features Analysis and Quantitative Remote Sensing Advances of Inland Water Quality Parameters,” Geography and Territorial Research, Vol. 18, No. 2, 2003, pp. 66-68. [3] S. Wang, F. Yan and Y. Zhou, “Quality Monitoring Us- ing Hyperspectral Remote Sensing Data in Taihu Lake China,” IEEE International Proceedings of Geoscience and Remote Sensing Symposium, 2005, pp. 4553-4556. [4] E. Wit and J. McClure, “Estimating Total Suspended Sediments Concentrations and Transparency with Hyper- Spectral Reflectance in Shitoukoumen Reservoir, Jilin Prvoince,” Acta Tournal of Lake Sciences, Vol. 19, No. 3, 2007, pp. 269-274. |