

Paper Menu >>
Journal Menu >>
 International Journal of Analytical Mass Spectrometry and Chromatography, 2013, 1, 103-108 Published Online December 2013 (http://www.scirp.org/journal/ijamsc) http://dx.doi.org/10.4236/ijamsc.2013.12013 Open Access IJAMSC The Equilibrium Thermal Physics of Supercritical Fluids Boris Sedunov Computer and Information Systems Department, Russian New University (ROSNOU), Moscow, Russia Email: [email protected] Received October 23, 2013; revised November 20, 2013; accepted December 20, 2013 Copyright © 2013 Boris Sedunov. This is an open access article distributed under the Creative Commons Attribution License, which permits unrestricted use, distribution, and reproduction in any medium, provided the original work is properly cited. ABSTRACT To discover particular features of pure supercritical fluids, important for the supercritical fluid extraction and cleaning technologies, the preprocessed and generalized experimental data from the US National Institute of Standards and Technology (NIST) online database have been analyzed. Th e soft transition between gas-like and liquid-like structur es in pure supercritical fluids has been considered in comparison with the abrupt vapor-liquid phase transition. A rough, diffused and boiling boundary between these structures in conditions of extra high gravity is opposed to a flat vapor-liquid boundary at a moderate gravity. The model for molecular diffusivity in carbon dioxide at temperatures near the critical temperature discovers its proportionality to the monomer fraction density. The cluster fraction based model for small molecular weight solids’ solubility in supercritical fluid s has been suggested and successfu lly compared with the well-known experimental results for th e solubility of silica in water. The model shows that at growing pressure the dissolution process has already started in a real gas and discovers the cluster fractions’ role in the solubility process. Keywords: Supercritical Fluid; Real Gas; Cluster; Extraction; Cleaning; Diffusivity; Solubility 1. Introduction Supercritical Fluids (SFs) present a growing interest for modern chemical technologies, such as the Supercritical Fluid Extraction (SFE) [1,2] and Supercritical Fluid Cle an - ing (SFC) [3]. Staying between gases and liquids, they provide a large solub ility of so lid subs tances, characteris- tic to liquids, and a large diffusivity of extracted mole- cules, specific for gases. In the analytical chemistry, the products of the supercritical fluid extraction perfectly match the requirements to candidate substances for fur- ther analysis in chromatography columns and in mass spectrometers. The joint utilization of SFE, chromatog- raphy and mass spectrometry opens remarkable possibili- ties for pharmacology and food and perfume industries. A high resolution of the Supercritical Fluid Chromatog- raphy and Supercritical Fluid Chromatography—Mass Spectrometry in pharmacological analysis was demon- strated by Ilia Brondz and Anton Brondz in [4]. High diffusivity and low viscosity of SFs permit higher flows of substances in chromatography columns, which provide a quicker separation, better resolution and effectiveness of the chromatography process and higher purity of se- lected products. To improve further the SF based tech- nologies, it is needed to penetrate deeper in the thermal and molecular physics of SFs. The thermal physics [5] of supercritical fluids is of a great value for researchers and practitioners: For research ers, it is important to build precise mod- els of SF structures and their thermo physical prop- erties; For practitioners, it is desirable to use correlations between optimal parameters of technological proc- esses and thermo physical properties of SFs. This investigation proceeds answer the questions [6,7] arising in courses of Thermal and Molecular Physics of Fluids, such as: How the extension of the saturation curve can be traced in the supercritical region? What are the changes in the fluid structure, when we come from the gaseous phase to the liquid phase around the critical point? In what conditions it could be possible to visualize the boundary between the gas-like and liquid-like su- percritical fluids? What factors provide high diffusivity of molecules in supercritical fluids? What factors provide high solubility of solids in the gas-like supercritical fluid? The investigation is based on precise experimental data contained in electronic databases for thermophysical  B. SEDUNOV 104 properties of pure fluids. The principal source of initial data is the database for thermophysical pr operties of f luid systems [8]. Due to advanced computer processing of raw experimental data from different sources, this da- tabase contains the generalized data with an improved resulting precision. The data improvement process is de- veloped by the Thermodynamics Research Center (TRC) of the US National Institute of Standards and Techn olog y [9] and is named as the critical evaluation of experimen- tal data. Its main idea sounds as: “critical evaluation is a process of analyzing all available experimental data for a given property to arrive at recommended values together with estimates of uncertainty, providing a highly useful form of thermodynamic data for our customers. The analysis is based on intercomparisons, interpolation, ex- trapolation, and correlation of the original experimental data collected at TRC. Data are evaluated for thermody- namic consistency using fundamental thermodynamic principles, including consistency checks between data and correlations for related properties. While automated as much as possible, this process is overseen by experts with a great deal of experience in the field of thermody- namic data” [9]. The principal goal of this paper is to analyze deeply the structural changes [7] of the supercritical fluid near the extension of the saturation curve to the supercritical region. More practical goals are to correlate the pressure driven steep solubility growth in SFs [1,10] with the structural transition from the gas-like to the liquid-like supercritical fluid and to correlate the high diffusivity [1] of molecules in supercritical fluids with the monomer fraction density [11]. 2. The Nature of the Gas-To-Liquid Transition in the Supercritical Zone In our approach the transition from the gas-like to the liquid-like supercritical fluid is named as the Soft Struc- tural Transition [7,12,13 ]. It differs from the well known Structural Transitions in solids [14]. The solids have long range correlations of their elementary cells’ structures. But the structure of a supercritical fluid is not homoge- neous in space and dynamically changes. It can have only short r ange structural correlations with a correlation radius smaller than the dimensions of clusters and pores. And it differs also from the first order liquid-vapor phase transition that is based on the collective behavior of molecules in a liquid state with a radius for correlations of potential energy much larger than the dimensions of pores. But the correlation radius for potential energy in supercritical fluids is smaller than the dimensions of clusters in the gas-like fluid or pores in the liquid-like fluid. 2.1. The Structure of the Supercritical Ridge Zone The lack of the long range structural and energy correla- tions in supercritical fluids may be explained by large density fluctuations discovered by the group of research- ers headed by Dr. Keiko Nishikawa [15]. This group has investigated by the X-ray diffraction and Raman spec- troscopy the density fluctuations in supercritical fluids. They discovered the peak line Pr (T) of density fluctua- tions on the (T, P) diagram and named it as the ridge. A similar sort of the ridge line Pr (T) may be seen on the diagrams of many thermophysical properties, such as heat capacities, compressibility factors, etc. [7,16]. The saturation curve Ps (T), marking the first order phase transition between liquid and vapor phases on the PT diagram, terminates at the critical point (Pc, Tc). The ridge line Pr (T) is the extension of the saturation line Ps (T) to the supercritical zone, but depends on the nature of the property selected to build this lin e [7,16]. So, there is a plurality of the extension lines, forming together the zone of the soft structural transition. The zone widens with a growth of the T – Tc difference, Figure 1, [17]. The data are from [8]. The ridge zone is the zone of large but controllable changes in thermophysical properties and can be recom- mended as the zone favorable for technological processes. If the pressure P grows at a constant supercritical tem- perature T, the fluid passes through the structural transi- tion from the gas-like structure to the liquid-like one. But this transition is not accompanied by abrupt changes of thermophysical properties. In the ridge zone abruptly changes only topology of the medium: it converts from a scattered form, filled with clusters, to a condensed one, filled with pores, [7,6,17]. The scattered clusters of the gas-like structure over the ridge pressure collect together into an infinite cluster, filled with pores of the same total volume, as the total volume of clusters. The supercritical fluid is a heterogeneous system [18] that can change only its structure at changing pressure or temperature. The structure of the supercritical fluid at pressures lower the ridge pressure Pr (T) is fog-like and consists of different size clusters flying in an ideal gas of monomers, but over the ridge pressure the picture is quite contrary: the structure is foam-like and contains pores of different sizes spread in the continuous liquid media, Figure 2. At the ridge pressure the average densities of both structures are equal and close to the critical density Dc. At the ridge pressure coexist large regions with the gas-like structure and large regions with the foam-like structure, mutually penetrating in each other. It gives rise to the giant fluctuations of density, directly measured in experiments of Dr. K. Nishikawa and her group. In the earlier author’s work [16] the method o f estima- tion the populations and bond parameters of clusters in Open Access IJAMSC 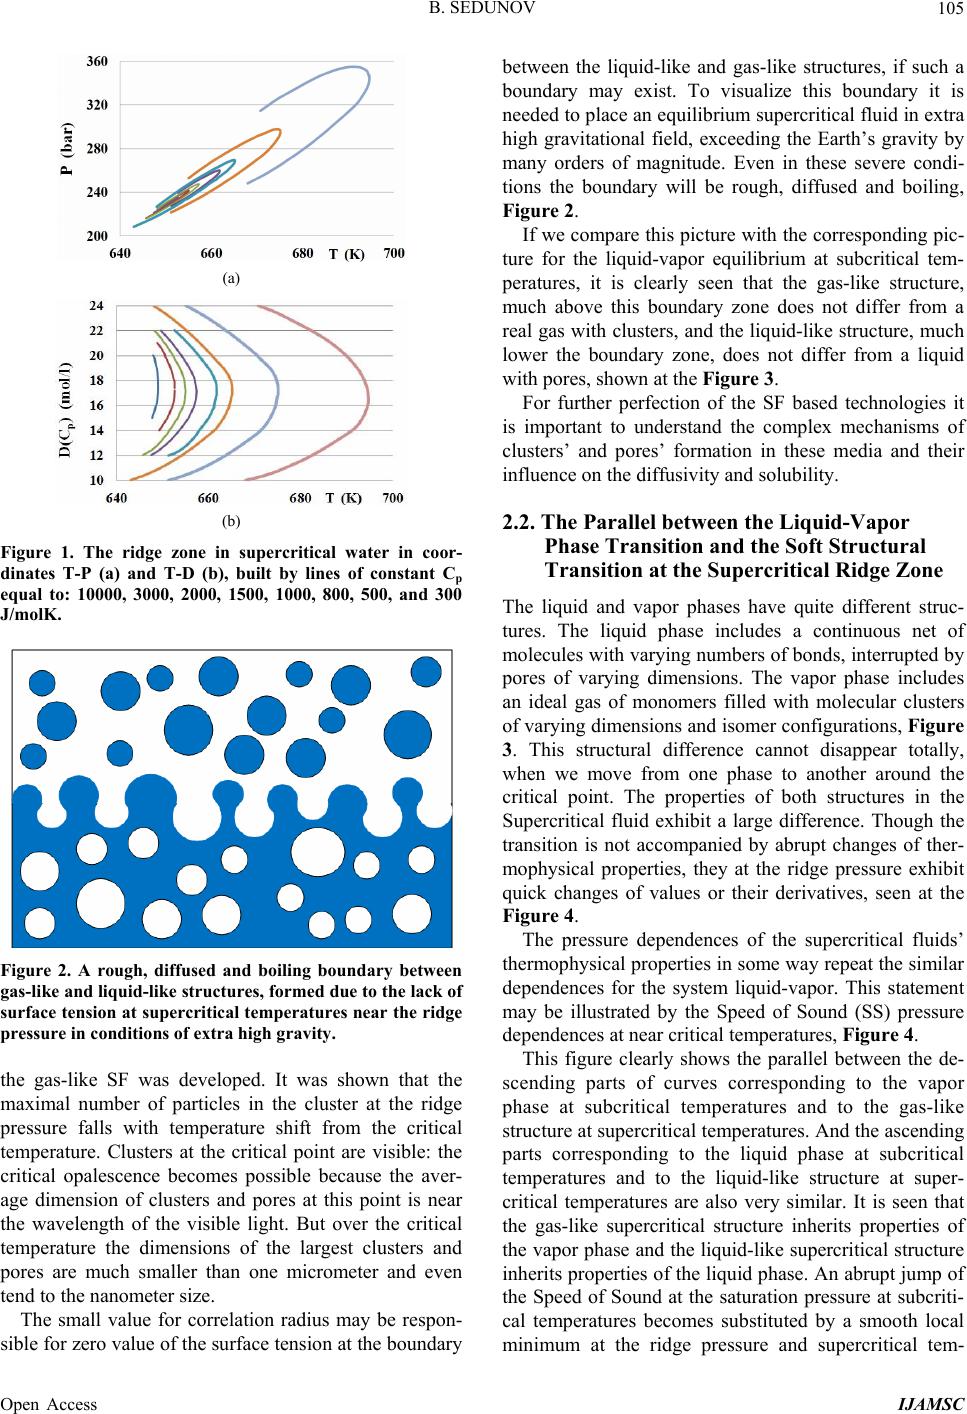 B. SEDUNOV 105 (a) (b) Figure 1. The ridge zone in supercritical water in coor- dinates T-P (a) and T-D (b), built by lines of constant Cp equal to: 10000, 3000, 2000, 1500, 1000, 800, 500, and 300 J/molK. Figure 2. A rough, diffused and boiling boundary between gas-like and liquid-like structures, formed due to the lack of surface tension at supercritical temperatures near the ridge pressure in conditions of extra high gravity. the gas-like SF was developed. It was shown that the maximal number of particles in the cluster at the ridge pressure falls with temperature shift from the critical temperature. Clusters at the critical point are visible: the critical opalescence becomes possible because the aver- age dimension of clusters and pores at this point is near the wavelength of the visible light. But over the critical temperature the dimensions of the largest clusters and pores are much smaller than one micrometer and even tend to the nanometer size. The small value for correlation radius may be respon- sible for zero value of the surface tension at the boundary between the liquid-like and gas-like structures, if such a boundary may exist. To visualize this boundary it is needed to place an equ ilibrium supercritical fluid in extra high gravitational field, exceeding the Earth’s gravity by many orders of magnitude. Even in these severe condi- tions the boundary will be rough, diffused and boiling, Figure 2. If we compare this picture with the corresponding pic- ture for the liquid-vapor equilibrium at subcritical tem- peratures, it is clearly seen that the gas-like structure, much above this boundary zone does not differ from a real gas with clusters, and the liquid-like structure, much lower the boundary zone, does not differ from a liquid with pores, shown at the Figure 3. For further perfection of the SF based technologies it is important to understand the complex mechanisms of clusters’ and pores’ formation in these media and their influence on the diffusivity and so lubility. 2.2. The Parallel between the Liquid-Vapor Phase Transition and the Soft Structural Transition at the Supercritical Ridge Zone The liquid and vapor phases have quite different struc- tures. The liquid phase includes a continuous net of molecules with varying numbers of bond s, interrupted by pores of varying dimensions. The vapor phase includes an ideal gas of monomers filled with molecular clusters of varying dimensions and isomer configurations, Figure 3. This structural difference cannot disappear totally, when we move from one phase to another around the critical point. The properties of both structures in the Supercritical fluid exhibit a large difference. Though the transition is not accompanied by abrupt changes of ther- mophysical properties, they at the ridge pressure exhibit quick changes of values or their derivatives, seen at the Figure 4. The pressure dependences of the supercritical fluids’ thermophysical properties in some way repeat the similar dependences for the system liquid-vapor. This statement may be illustrated by the Speed of Sound (SS) pressure dependences at near critical temperatures, Figure 4. This figure clearly shows the parallel between the de- scending parts of curves corresponding to the vapor phase at subcritical temperatures and to the gas-like structure at supercritical temperatures. And the ascending parts corresponding to the liquid phase at subcritical temperatures and to the liquid-like structure at super- critical temperatures are also very similar. It is seen that the gas-like supercritical structure inherits properties of the vapor phase and the liquid-like supercritical structure inherits properties of the liquid phase. An abrupt jump of the Speed of Sound at the saturation pressure at subcriti- cal temperatures becomes substituted by a smooth local minimum at the ridge pressure and supercritical tem- Open Access IJAMSC 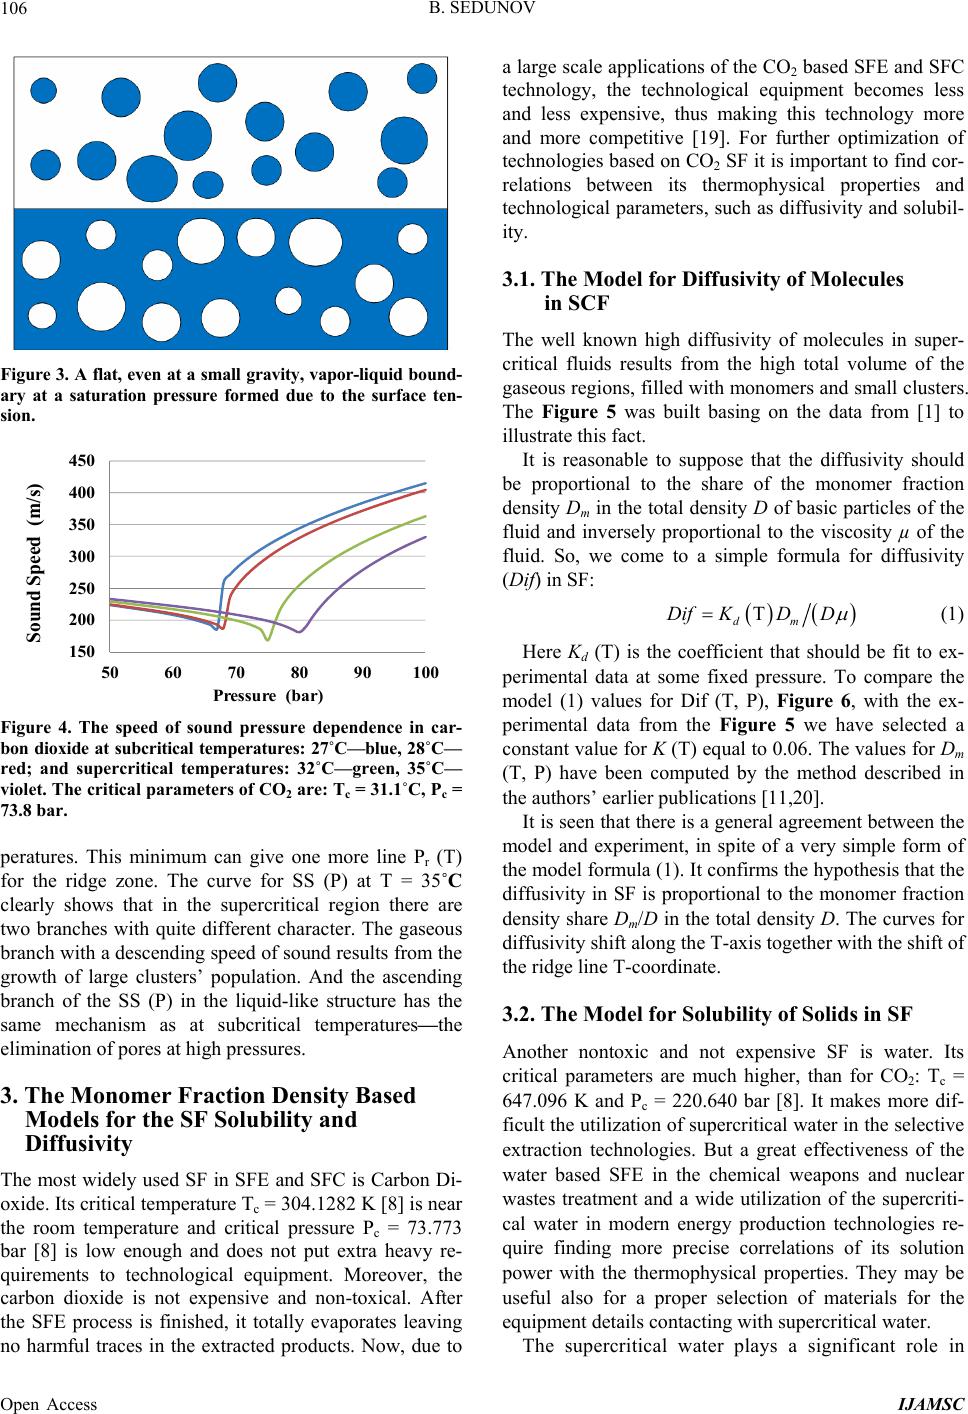 B. SEDUNOV 106 Fi gure 3. A flat, even at a small gravity, vapor-liquid bound- ary at a saturation pressure formed due to the surface ten- sion. 150 200 250 300 350 400 450 50 60 70 80 90100 Sound Spe ed (m/s ) Pressure ( bar ) Figure 4. The speed of sound pressure dependence in car- bon dioxide at subcritical temperatures: 27˚C—blue, 28˚C— red; and supercritical temperatures: 32˚C—green, 35˚C— violet. The critical parameters of CO2 are: Tc = 31.1˚C, Pc = 73.8 bar. peratures. This minimum can give one more line Pr (T) for the ridge zone. The curve for SS (P) at T = 35˚C clearly shows that in the supercritical region there are two branches with quite different character. The gaseous branch with a descending speed of sound results from the growth of large clusters’ population. And the ascending branch of the SS (P) in the liquid-like structure has the same mechanism as at subcritical temperatures—the eliminat ion of pore s at h i gh pressures . 3. The Monomer Fraction Density Based Models for the SF Solubility and Diffusivity The most widely used SF in SFE and SFC is Carbon Di- oxide. Its critical temperature Tc = 304.1282 K [8] is near the room temperature and critical pressure Pc = 73.773 bar [8] is low enough and does not put extra heavy re- quirements to technological equipment. Moreover, the carbon dioxide is not expensive and non-toxical. After the SFE process is finished, it totally evaporates leaving no harmful traces in the extracted products. Now, due to a large scale applications of the CO2 based SFE and SFC technology, the technological equipment becomes less and less expensive, thus making this technology more and more competitive [19]. For further optimization of technologies based on CO 2 SF it is important to find cor- relations between its thermophysical properties and technological parameters, such as diffusivity and solubil- ity. 3.1. The Model for Diffusivity of Molecules in SCF The well known high diffusivity of molecules in super- critical fluids results from the high total volume of the gaseous regions, filled with monomers and small clusters. The Figure 5 was built basing on the data from [1] to illustrate this fact. It is reasonable to suppose that the diffusivity should be proportional to the share of the monomer fraction density Dm in the total density D of basic particles of the fluid and inversely proportional to the viscosity µ of the fluid. So, we come to a simple formula for diffusivity (Dif) in SF: T dm Dif KDD (1) Here Kd (T) is the coefficient that should be fit to ex- perimental data at some fixed pressure. To compare the model (1) values for Dif (T, P), Figure 6, with the ex- perimental data from the Figure 5 we have selected a constant value for K (T) equal to 0.06. The values for Dm (T, P) have been computed by the method described in the authors’ earlier publications [11,20]. It is seen that there is a general agreement between the model and experiment, in spite of a very simple form of the model formula (1). It confirms the hypothesis that th e diffusivity in SF is proportional to the monomer fraction density share Dm/D in the total density D. The curves for diffusivity shift along the T-axis together with the shift of the ridge line T-coordinate. 3.2. The Model for Solubility of Solids in SF Another nontoxic and not expensive SF is water. Its critical parameters are much higher, than for CO2: Tc = 647.096 K and Pc = 220.640 bar [8]. It makes more dif- ficult the utilization of sup ercritical water in the selective extraction technologies. But a great effectiveness of the water based SFE in the chemical weapons and nuclear wastes treatment and a wide utilization of the supercriti- cal water in modern energy production technologies re- quire finding more precise correlations of its solution power with the thermophysical properties. They may be useful also for a proper selection of materials for the equipment details contacting with supercritical water. The supercritical water plays a significant role in Open Access IJAMSC 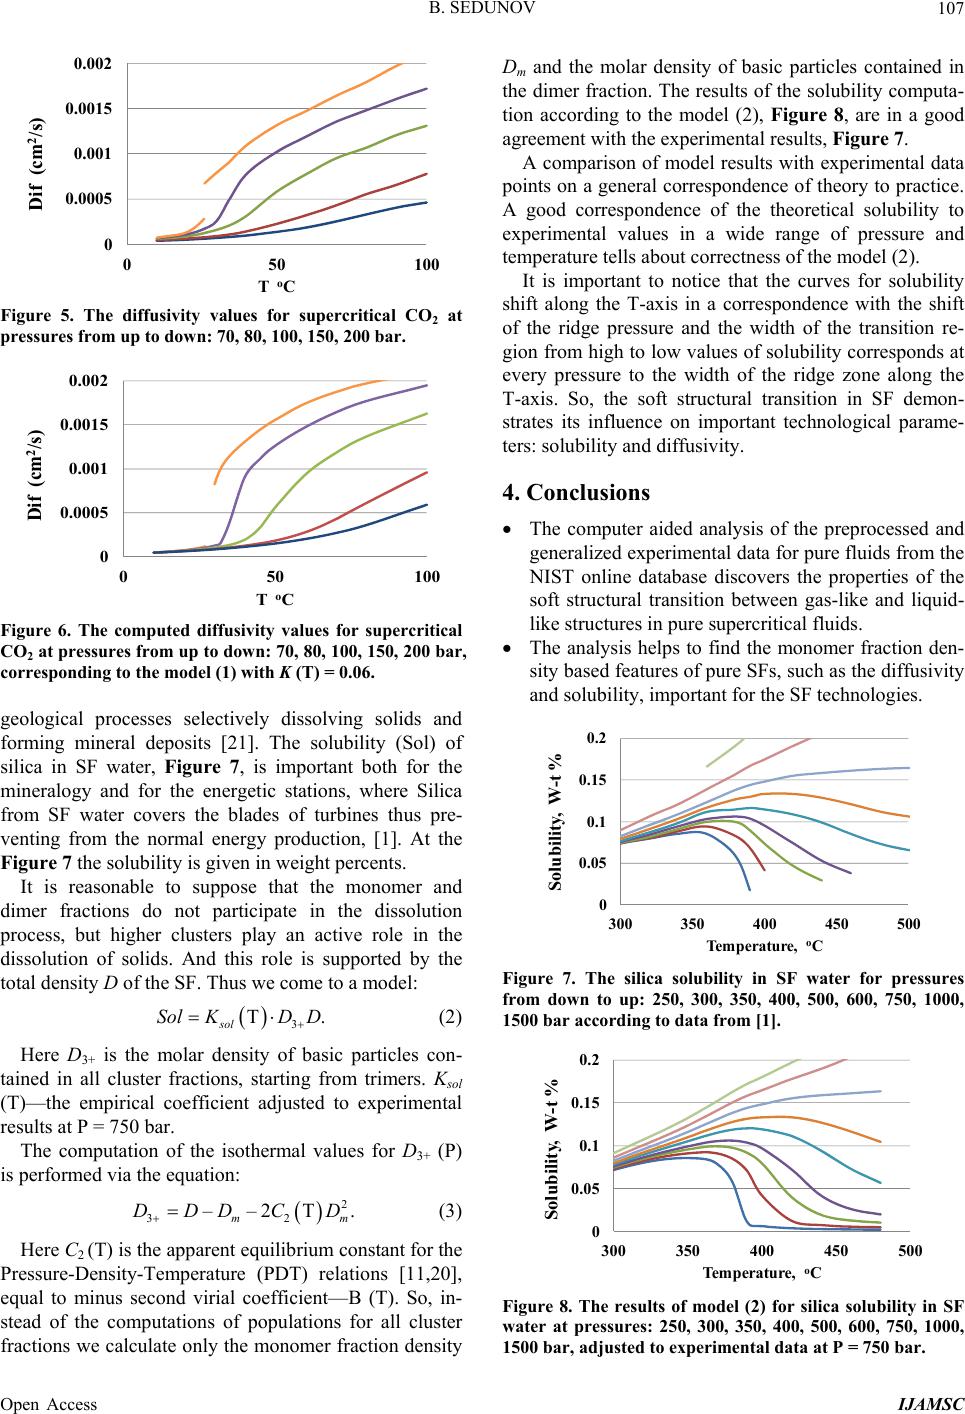 B. SEDUNOV 107 0 0.0005 0.001 0.0015 0.002 05010 0 Dif (cm 2 /s) T o C Figure 5. The diffusivity values for supercritical CO2 at pressures from up to down: 70, 80, 100, 150, 200 bar. 0 0.0005 0.001 0.0015 0.002 050 100 Dif (cm 2 /s) T o C Figure 6. The computed diffusivity values for supercritical CO2 at pressures from up to down: 70, 80, 100, 150, 200 bar, corresponding to the model (1) with K (T) = 0.06. geological processes selectively dissolving solids and forming mineral deposits [21]. The solubility (Sol) of silica in SF water, Figure 7, is important both for the mineralogy and for the energetic stations, where Silica from SF water covers the blades of turbines thus pre- venting from the normal energy production, [1]. At the Figure 7 the solubility is given in weight percents. It is reasonable to suppose that the monomer and dimer fractions do not participate in the dissolution process, but higher clusters play an active role in the dissolution of solids. And this role is supported by the total density D of the SF. Thus we come to a model: 3 T sol SolKD D . . m (2) Here D3+ is the molar density of basic particles con- tained in all cluster fractions, starting from trimers. Ksol (T)—the empirical coefficient adjusted to experimental results at P = 750 bar. The computation of the isothermal values for D3+ (P) is performed via the equation: 2 32 ––2T m DDDCD (3) Here C2 (T) is the apparent equilibriu m constant for the Pressure-Density-Temperature (PDT) relations [11,20], equal to minus second virial coefficient—B (T). So, in- stead of the computations of populations for all cluster fractions we calculate only the monomer fraction density Dm and the molar density of basic particles contained in the dimer fraction. The results of the solub ility computa- tion according to the model (2), Figure 8, are in a good agreement with the experimental results, Figure 7. A comparison of model results with experimental data points on a general correspondence of theory to practice. A good correspondence of the theoretical solubility to experimental values in a wide range of pressure and temperature tells about co rrectness of the model (2). It is important to notice that the curves for solubility shift along the T-axis in a correspondence with the shift of the ridge pressure and the width of the transition re- gion from high to low values of solubility corresponds at every pressure to the width of the ridge zone along the T-axis. So, the soft structural transition in SF demon- strates its influence on important technological parame- ters: solubility and diffusivity. 4. Conclusions The computer aided analysis of the preprocessed and generalized experimental data for pure fluids from the NIST online database discovers the properties of the soft structural transition between gas-like and liquid- like structures in pure supercritical fluids. The analysis helps to find the monomer fraction den- sity based features of pure SFs, such as the diffusivity and solubility, impor tant for the SF technologies. 0 0.05 0.1 0.15 0.2 300 350 400 450 500 Solubili ty, W -t % Temp eratu re, o C Figure 7. The silica solubility in SF water for pressures from down to up: 250, 300, 350, 400, 500, 600, 750, 1000, 1500 bar according to data from [1]. 0 0.05 0.1 0.15 0.2 300 350 400 450 500 Sol ubil ity, W- t % Temperatu re, o C Figure 8. The results of model (2) for silica solubility in SF water at pressures: 250, 300, 350, 400, 500, 600, 750, 1000, 1500 bar, adjusted to experimental data at P = 750 bar. Open Access IJAMSC 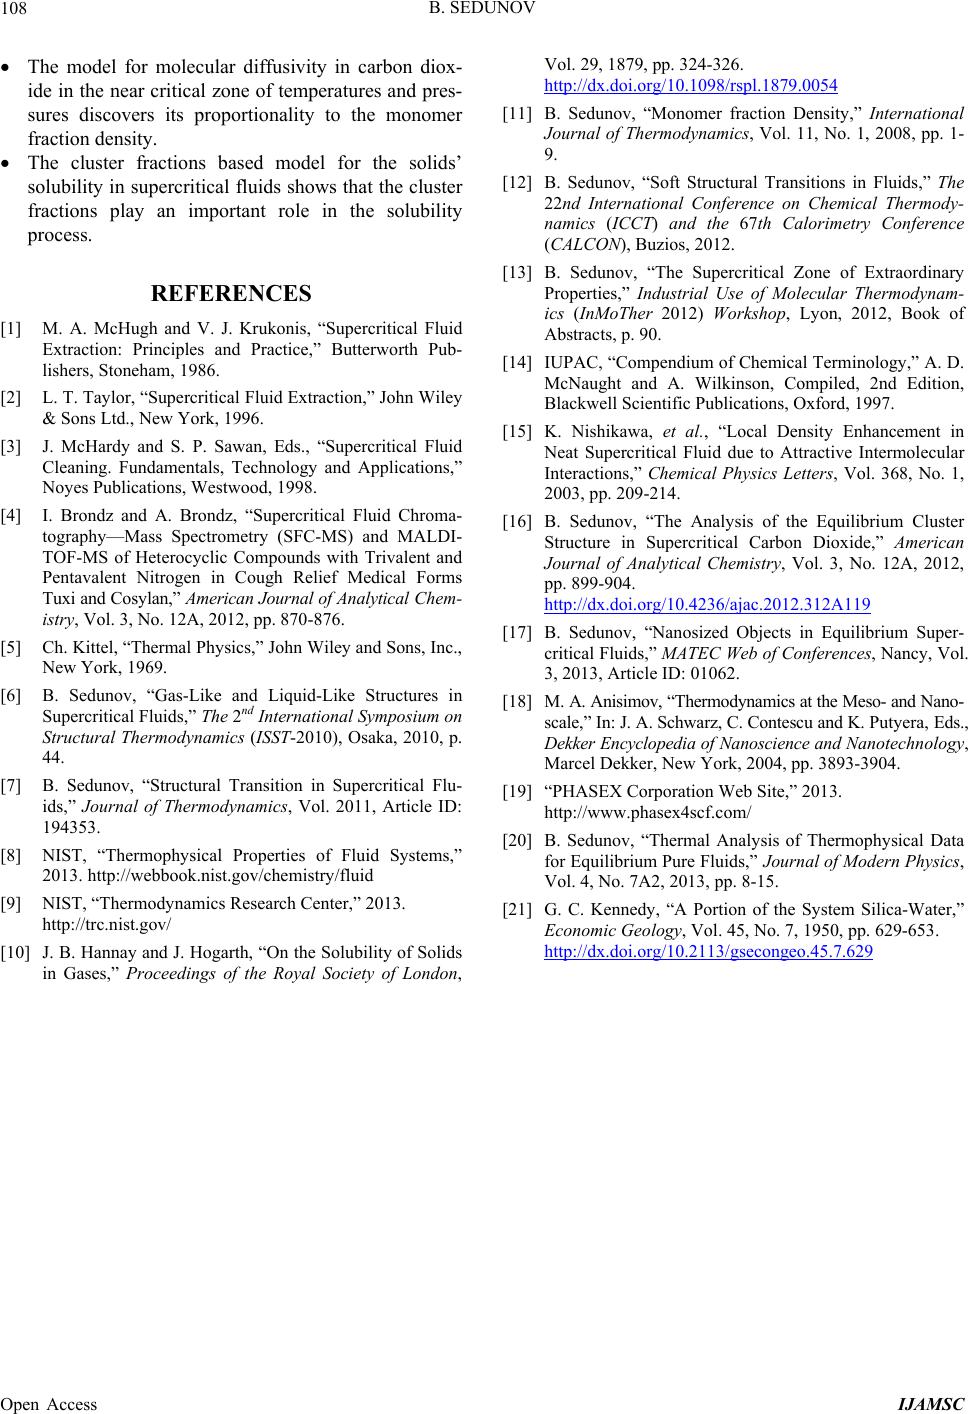 B. SEDUNOV Open Access IJAMSC 108 The model for molecular diffusivity in carbon diox- ide in the near critical zone of temperatures and pres- sures discovers its proportionality to the monomer fraction density. The cluster fractions based model for the solids’ solubility in supercritical fluids shows that the cluster fractions play an important role in the solubility process. REFERENCES [1] M. A. McHugh and V. J. Krukonis, “Supercritical Fluid Extraction: Principles and Practice,” Butterworth Pub- lishers, Stoneham, 1986. [2] L. T. Taylor, “Supercritical Fluid Extraction,” John Wiley & Sons Ltd., New York, 1996. [3] J. McHardy and S. P. Sawan, Eds., “Supercritical Fluid Cleaning. Fundamentals, Technology and Applications,” Noyes Publications, Westwood, 1998. [4] I. Brondz and A. Brondz, “Supercritical Fluid Chroma- tography—Mass Spectrometry (SFC-MS) and MALDI- TOF-MS of Heterocyclic Compounds with Trivalent and Pentavalent Nitrogen in Cough Relief Medical Forms Tuxi and Cosylan,” American Journal of Analytical C he m- istry, Vol. 3, No. 12A, 2012, pp. 870-876. [5] Ch. Kittel, “Thermal Physics,” John Wiley and Sons, Inc., New York, 1969. [6] B. Sedunov, “Gas-Like and Liquid-Like Structures in Supercritical Fluids,” The 2nd International Symposium on Structural Thermodynamics (ISST-2010), Osaka, 2010, p. 44. [7] B. Sedunov, “Structural Transition in Supercritical Flu- ids,” Journal of Thermodynamics, Vol. 2011, Article ID: 194353. [8] NIST, “Thermophysical Properties of Fluid Systems,” 2013. http://webbook.nist.gov/chemistry/fluid [9] NIST, “Thermodynamics Research Center,” 2013. http://trc.nist.gov/ [10] J. B. Hannay and J. Hogarth, “On the Solubility of Solids in Gases,” Proceedings of the Royal Society of London, Vol. 29, 1879, pp. 324-326. http://dx.doi.org/10.1098/rspl.1879.0054 [11] B. Sedunov, “Monomer fraction Density,” International Journal of Thermodynamics, Vol. 11, No. 1, 2008, pp. 1- 9. [12] B. Sedunov, “Soft Structural Transitions in Fluids,” The 22nd International Conference on Chemical Thermody- namics (ICCT) and the 67th Calorimetry Conference (CALCON), Buzios, 2012. [13] B. Sedunov, “The Supercritical Zone of Extraordinary Properties,” Industrial Use of Molecular Thermodynam- ics (InMoTher 2012) Workshop, Lyon, 2012, Book of Abstracts, p. 90. [14] IUPAC, “Compendium of Chemical Terminology,” A. D. McNaught and A. Wilkinson, Compiled, 2nd Edition, Blackwell Scientific Publications, Oxford, 1997. [15] K. Nishikawa, et al., “Local Density Enhancement in Neat Supercritical Fluid due to Attractive Intermolecular Interactions,” Chemical Physics Letters, Vol. 368, No. 1, 2003, pp. 209-214. [16] B. Sedunov, “The Analysis of the Equilibrium Cluster Structure in Supercritical Carbon Dioxide,” American Journal of Analytical Chemistry, Vol. 3, No. 12A, 2012, pp. 899-904. http://dx.doi.org/10.4236/ajac.2012.312A119 [17] B. Sedunov, “Nanosized Objects in Equilibrium Super- critical Fluids,” MATEC Web of Conferences, Nancy, Vol. 3, 2013, Article ID: 01062. [18] M. A. Anisimov, “Thermodynamics at the Meso- and Nano- scale,” In: J. A. Schwarz, C. Contescu and K. Puty e r a , Eds., Dekker Encyclopedia of Nanoscience and N anotechnology, Marcel Dekker, New York, 2004, pp. 3893-3904. [19] “PHASEX Corporation Web Site,” 2013. http://www.phasex4scf.com/ [20] B. Sedunov, “Thermal Analysis of Thermophysical Data for Equilibrium Pure Fluids,” Journal of Modern Physics, Vol. 4, No. 7A2, 2013, pp. 8-15. [21] G. C. Kennedy, “A Portion of the System Silica-Water,” Economic Geology, Vol. 45, No. 7, 1950, pp. 629-653. http://dx.doi.org/10.2113/gsecongeo.45.7.629 |