

Paper Menu >>
Journal Menu >>
 Open Journal of Nephrology, 2013, 3, 205-210 Published Online December 2013 (http://www.scirp.org/journal/ojneph) http://dx.doi.org/10.4236/ojneph.2013.34035 Open Access OJNeph Twenty-Two-Year Observation on Urinary Cadmium and ß2-Microglobulin in Inhabitants after Cessation of Cadmium-Exposure in Japan* Reiko Sato1#, Teruhiko Kido1, Hideaki Nakagawa2, Muneko Nishijo2, Ryumon Honda2, Etsuko Kobayashi3, Yasushi Suwazono3 1Graduate School of Medical Science, Kanazawa University, Kanazawa, Japan 2Kanazawa Medical University, Uchinada, Japan 3Graduate School of Medical Science, Chiba University, Chiba, Japan Email: #[email protected] Received October 22, 2013; revised November 20, 2013; accepted December 15, 2013 Copyright © 2013 Reiko Sato et al. This is an open access article distributed under the Creative Commons Attribution License, which permits unrestricted use, distribution, and reproduction in any medium, provided the original work is properly cited. ABSTRACT Obje ctive: This is an epidemiological survey that was conducted for 22 years to investigate the physical effects on in- habitants who had been exposed to cadmium (Cd) from processing of remnants discharged at the time of copper re- finement. It was possible to obtain findings on physical effects 27 years after Cd exposure. Materials and Methods: Of the inhabitants who were 50 years old or younger in 1981 and who were living in the most contaminated area in the Kakehashi River basin, 68 (32 males and 36 females) who underwent all of the 5 screenings during the 22-year period were extracted as subjects. Early morning urine was collected for urinalysis, and Cd and ß2-MG concentrations were determined. Results: 27 years after cessation of Cd exposure, it was shown that urinary Cd concentrations were signifi- cantly decreased and urinary ß2-MG concentrations were significantly increased. Conclusion: Once exposed to Cd, it takes about 30 years for the Cd that remains in the body to decrease by half. Once renal tubular dysfunction occurs after Cd exposure, irreversible aggravation is inevitable. Keywords: Twenty-Two-Year Observation; Urinary-Cadmium; Urinary-ß2-Microglobulin; Itai-Itai Disease; Biological-Half-Life 1. Introduction A long-term follow-up survey was conducted to investi- gate the effects of Cd exposure on the health of inhabi- tants who had been living in a contaminated region con- tinually in Japan with regard to the following: 1) Cd that remained in the body as determined based on changes in urinary Cd concentration [1], and 2) renal tubular disor- der [2], a typical consequence of Cd exposure, based on changes in urinary ß2-microglobulin (ß2-MG) [3,4] con- centration. Once exposed to Cd, about 30 years [5,6] are required to reduce by half the Cd that remains in the body regard- less of the amount of exposure. Even after a long period of time, ß2-MG, an index of renal tubular dysfunction caused by exposure, continues to irreversibly increase [7-10] instead of decreasing. It has therefore been sug- gested that with larger exposure volumes, the risk of de- velopment of distressing Itai-itai disease [11-13] may in- crease infinitely. The Kakehashi River basin located in Komatsu City, Ishikawa Prefecture, Japan, was contaminated with Cd waste water from the former Ogoya Cupper Mine [14] from 1882 to 1971. The inhabitants of the region were orally exposed to Cd [15] for a long time because they cultivated and consumed rice as a staple food with con- taminated water used for irrigation in rice paddies. How- ever, the Ishikawa Prefecture government conducted an health impairment investigation only afterward, in the 1970s. The physical effects of Cd exposure include renal tu- bular dysfunction, osteomalacia, osteoporosis, hepatic disorder, hypertension [16], and others. The most severe consequence is Itai-itai disease. The name of this disease *The authors declare no competing financial interests. #Corresponding author.  R. SATO ET AL. 206 is Japanese, and literally means “ouch-ouch” because even small movements result in fractures due to ad- vanced osteomalacia, making the patient cry (According to autopsy reports, 42 fractures were observed in some cases.). The Ministry of Health and Welfare of Japan recog- nized Itai-itai disease as the first mining-related illness in April 1968 [17] and subsequently enacted a law to im- prove the polluted soil. Based on this law, in 1981 Ishi- kawa Prefecture improved the soil of the Kakehashi Riv- er basin district that was contaminated with Cd. Since the Ogoya Mine had already been closed by this time and its operation suspended, it was declared that Cd exposure had discontinued in this region [18]. At the same time in 1981, the prefectural government investigated health ef- fects [19] only among inhabitants of the Kakehashi River district who were 50 years old or older at that time and also believed to be severely exposed to Cd. In the survey, findings of ß2-MG of 1000 µg/g·Cr [20,21] or higher were judged abnormal. The incidence of abnormal values was 14.3% in males and 18.7% in females who lived in the polluted area, and 6% and 5%, respectively, in those who lived in non-polluted areas, clearly demonstrating a significant difference (p < 0.01) [22] between the pol- luted and non polluted areas. However, the inhabitants who were 50 years of age or younger and assumed to be moderately exposed to Cd were not investigated by Ishi- kawa Prefecture even though they lived in the same pol- luted Kakehashi River area. During 22 years from 1986, 5 years after the declaration on the discontinuation of exposure, up to 2008, Kido et al. who were concerned about the pollution, conducted a survey 5 times (1986, 1991, 1999, 2003 and 2008) [23,24] to investigate health effects using only excluded inhabitants who were 50 years of age or younger at the time of the former survey. Our study summarizes these investigations. The objectives of the studies were 1) to investigate the changes in urinary Cd and ß2-MG concentrations in males and females over the 22-year period to determine the excretion of these substances and 2) to determine the relationship between Cd exposure and renal tubular dys- function on the basis of the correlation of urinary Cd with ß2-MG in males and females over the 22 years. The following methods were used. 2. Materials and Methods Of all the inhabitants who were 50 years old or younger in 1981 and who were living in the commune, which was one of the most contaminated areas in the Kakehashi River basin, 68 (32 males and 36 females) who un- der-went all of the 5 screenings during the 22-year period were included as subjects. Inhabitants who neither par- ticipated at least once due to their illness or moving were excluded. Early morning urine was collected for urinaly- sis, and Cd and ß2-MG concentrations were determined. The measured Cd and ß2-MG concentrations were cor- rected with Cr. As methods of determination, RIA (Ra- dioimmunoassay), flameless atomic absorption spectro- photometry [25] and the Jaffe method were used to de- termine ß2-MG concentration, Cd concentration, and Cr concentration, respectively. A questionnaire was also used to investigate gender, age, and duration of resi- dence. ß2-MG is a plasma protein of low molecular weight (11.800 Daltons) and is produced from immunologically competent cells, the liver, and other tissues. Almost 100% of ß2-MG is filtered through the glomeruli of the kidneys and 99.9% of that is reabsorbed in the renal tu- bules [24-26]. Accordingly, ß2-MG was used as an index of renal tubular dysfunction. Currently, new indexes of renal tubular dysfunction are being described. However, the newest and the most sensitive index as of 1986 was urinary ß2-MG [24,25]. In a long-term follow-up epide- miology survey, it was necessary to employ the same investigation method in the same subjects for 22 years. Therefore, urinary ß2-MG was continuously used as an index of renal tubular dysfunction for the 22-year period. The results were statically analyzed using analysis of covariance (ANCOVA), Bonferroni and Pearson correla- tion coefficient. The software used for analysis was SPSS12 OJ for Windows. The inhabitants participated in the survey of their own free will. The survey in 2008 was granted approval by the Ethics Committee of Kanazawa University (2008, ap- proval No. 166). 3. Results and Discussion The mean ages of subjects in 2008 were 65 years and 68 years in the case of males and females, respectively. The mean years of residence were 53 years and 46 years, re- spectively (Table 1). The scales of Figures 1-3 show concentrations con- verted to logarithmic values. Figure 1 shows a graph of average urinary Cd con- centrations of 32 males and 36 females during the 22-year period. On t-testing of the difference in average Cd concentrations of male and female urine specimens in 1986 and 2008, the levels of significance were females p = 0.001 and males p = 0.001, indicating a significant decrease in 2008. The average actual measurements in 1986 were males 6.0 μg/g·Cr and females 8.20 μg/g·Cr, while the 2008 average actual measurements were males 2.30 μg/g·Cr and females 5.70 μg/g·Cr. This graph reflects the biological half-life of Cd, which is about 30 years, though the results also suggest long-term residue of Cd in the body even 27 years after exposure. In addition, the Open Access OJNeph 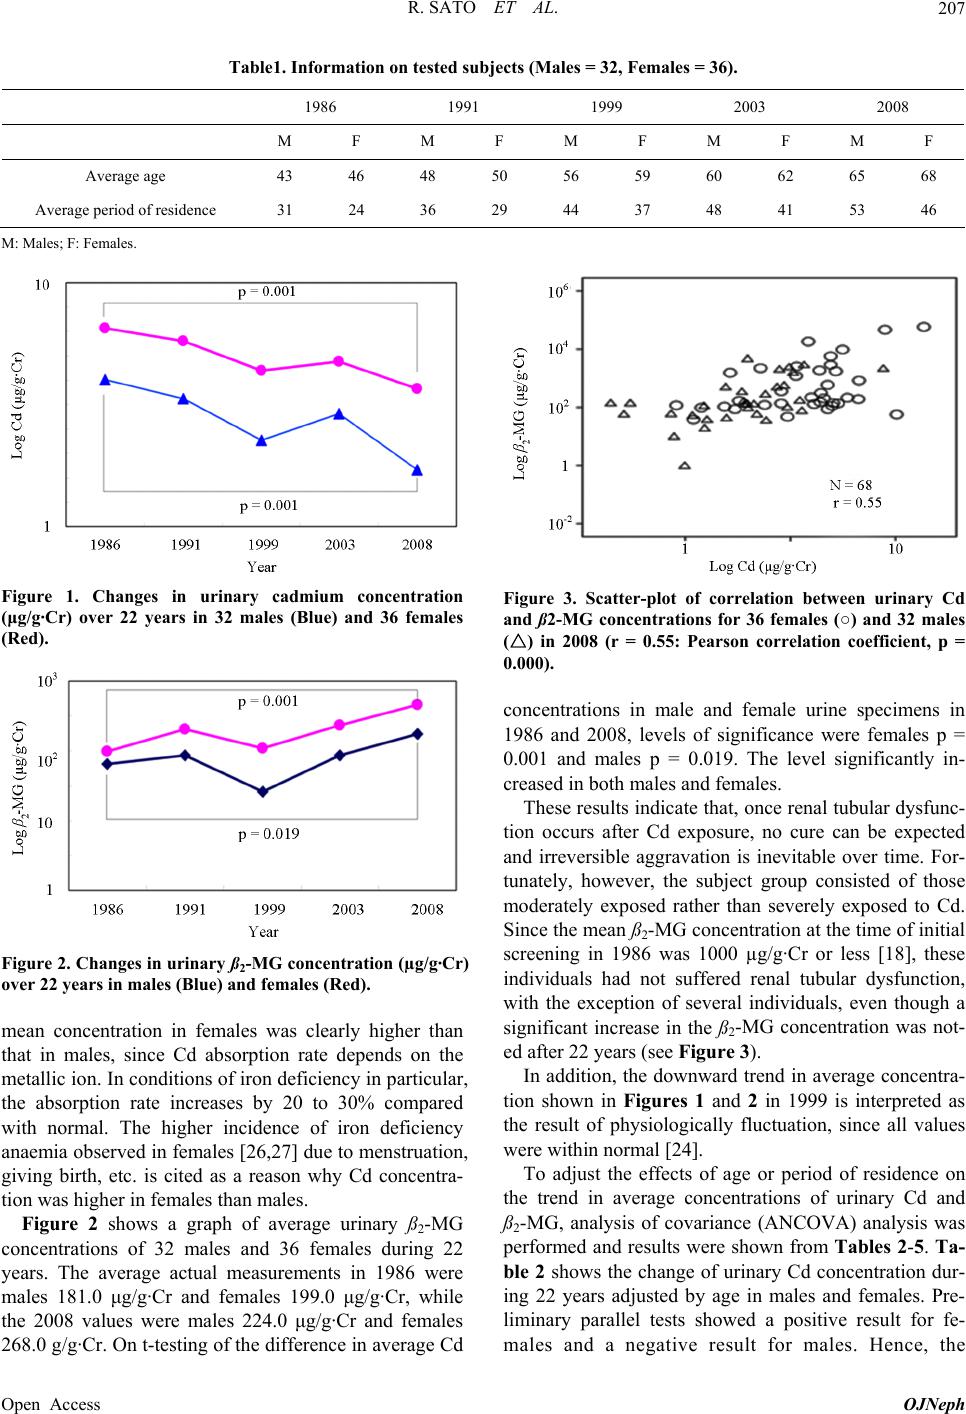 R. SATO ET AL. Open Access OJNeph 207 Table1. Information on tested subjects (Males = 32, Females = 36). 1986 1991 1999 2003 2008 M F M F M F M F M F Average age 43 46 48 50 56 59 60 62 65 68 Average period of residence 31 24 36 29 44 37 48 41 53 46 M: Males; F: Females. Figure 1. Changes in urinary cadmium concentration (μg/g·Cr) over 22 years in 32 males (Blue) and 36 females (Red). Figure 3. Scatter-plot of correlation between urinary Cd and ß2-MG concentrations for 36 females (○) and 32 males (△) in 2008 (r = 0.55: Pearson correlation coefficient, p = 0.000). concentrations in male and female urine specimens in 1986 and 2008, levels of significance were females p = 0.001 and males p = 0.019. The level significantly in- creased in both males and females. These results indicate that, once renal tubular dysfunc- tion occurs after Cd exposure, no cure can be expected and irreversible aggravation is inevitable over time. For- tunately, however, the subject group consisted of those moderately exposed rather than severely exposed to Cd. Since the mean ß2-MG concentration at the time of initial screening in 1986 was 1000 µg/g·Cr or less [18], these individuals had not suffered renal tubular dysfunction, with the exception of several individuals, even though a significant increase in the ß2-MG concentration was not- ed after 22 years (see Figure 3). Figure 2. Changes in urinary ß2-MG concentration (µg/g·Cr) over 22 years in males (Blue) and females (Red). mean concentration in females was clearly higher than that in males, since Cd absorption rate depends on the metallic ion. In conditions of iron deficiency in particular, the absorption rate increases by 20 to 30% compared with normal. The higher incidence of iron deficiency anaemia observed in females [26,27] due to menstruation, giving birth, etc. is cited as a reason why Cd concentra- tion was higher in females than males. In addition, the downward trend in average concentra- tion shown in Figures 1 and 2 in 1999 is interpreted as the result of physiologically fluctuation, since all values were within normal [24]. To adjust the effects of age or period of residence on the trend in average concentrations of urinary Cd and ß2-MG, analysis of covariance (ANCOVA) analysis was performed and results were shown from Tables 2-5. Ta- ble 2 shows the change of urinary Cd concentration dur- ing 22 years adjusted by age in males and females. Pre- liminary parallel tests showed a positive result for fe- males and a negative result for males. Hence, the Figure 2 shows a graph of average urinary ß2-MG concentrations of 32 males and 36 females during 22 years. The average actual measurements in 1986 were males 181.0 μg/g·Cr and females 199.0 μg/g·Cr, while the 2008 values were males 224.0 μg/g·Cr and females 268.0 g/g·Cr. On t-testing of the difference in average Cd 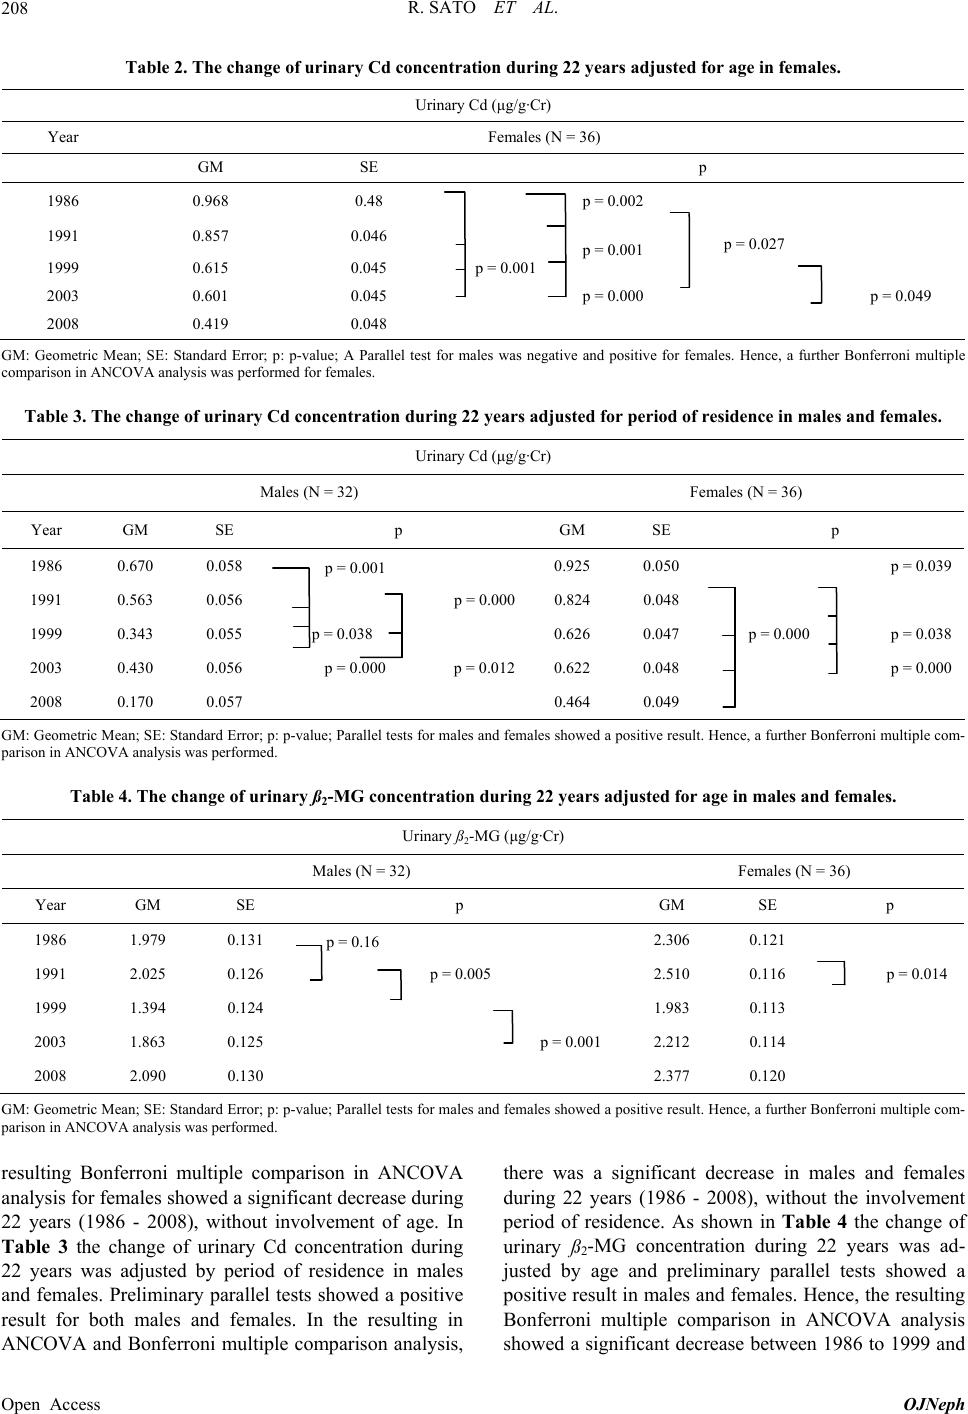 R. SATO ET AL. 208 Table 2. The change of urinary Cd concentration during 22 years adjusted for age in females. Urinary Cd (μg/g·Cr) Year Females (N = 36) GM SE p 1986 0.968 0.48 p = 0.002 1991 0.857 0.046 p = 0.027 1999 0.615 0.045 p = 0.001 p = 0.001 2003 0.601 0.045 p = 0.000 p = 0.049 2008 0.419 0.048 GM: Geometric Mean; SE: Standard Error; p: p-value; A Parallel test for males was negative and positive for females. Hence, a further Bonferroni multiple comparison in ANCOVA analysis was performed for females. Table 3. The change of urinary Cd concentration during 22 years adjusted for period of residence in males and females. Urinary Cd (μg/g·Cr) Males (N = 32) Females (N = 36) Year GM SE p GM SE p 1986 0.670 0.058 p = 0.001 0.925 0.050 p = 0.039 1991 0.563 0.056 p = 0.0000.824 0.048 1999 0.343 0.055 p = 0.038 0.626 0.047 p = 0.000 p = 0.038 2003 0.430 0.056 p = 0.000 p = 0.0120.622 0.048 p = 0.000 2008 0.170 0.057 0.464 0.049 GM: Geometric Mean; SE: Standard Error; p: p-value; Parallel tests for males and females showed a positive result. Hence, a further Bonferroni multiple com- parison in ANCOVA analysis was performed. Table 4. The change of urinary ß2-MG concentration during 22 years adjusted for age in males and females. Urinary ß2-MG (μg/g·Cr) Males (N = 32) Females (N = 36) Year GM SE p GM SE p 1986 1.979 0.131 p = 0.16 2.306 0.121 1991 2.025 0.126 p = 0.005 2.510 0.116 p = 0.014 1999 1.394 0.124 1.983 0.113 2003 1.863 0.125 p = 0.001 2.212 0.114 2008 2.090 0.130 2.377 0.120 GM: Geometric Mean; SE: Standard Error; p: p-value; Parallel tests for males and females showed a positive result. Hence, a further Bonferroni multiple com- parison in ANCOVA analysis was performed. resulting Bonferroni multiple comparison in ANCOVA analysis for females showed a significant decrease during 22 years (1986 - 2008), without involvement of age. In Table 3 the change of urinary Cd concentration during 22 years was adjusted by period of residence in males and females. Preliminary parallel tests showed a positive result for both males and females. In the resulting in ANCOVA and Bonferroni multiple comparison analysis, there was a significant decrease in males and females during 22 years (1986 - 2008), without the involvement period of residence. As shown in Table 4 the change of urinary ß2-MG concentration during 22 years was ad- justed by age and preliminary parallel tests showed a positive result in males and females. Hence, the resulting Bonferroni multiple comparison in ANCOVA analysis showed a significant decrease between 1986 to 1999 and Open Access OJNeph 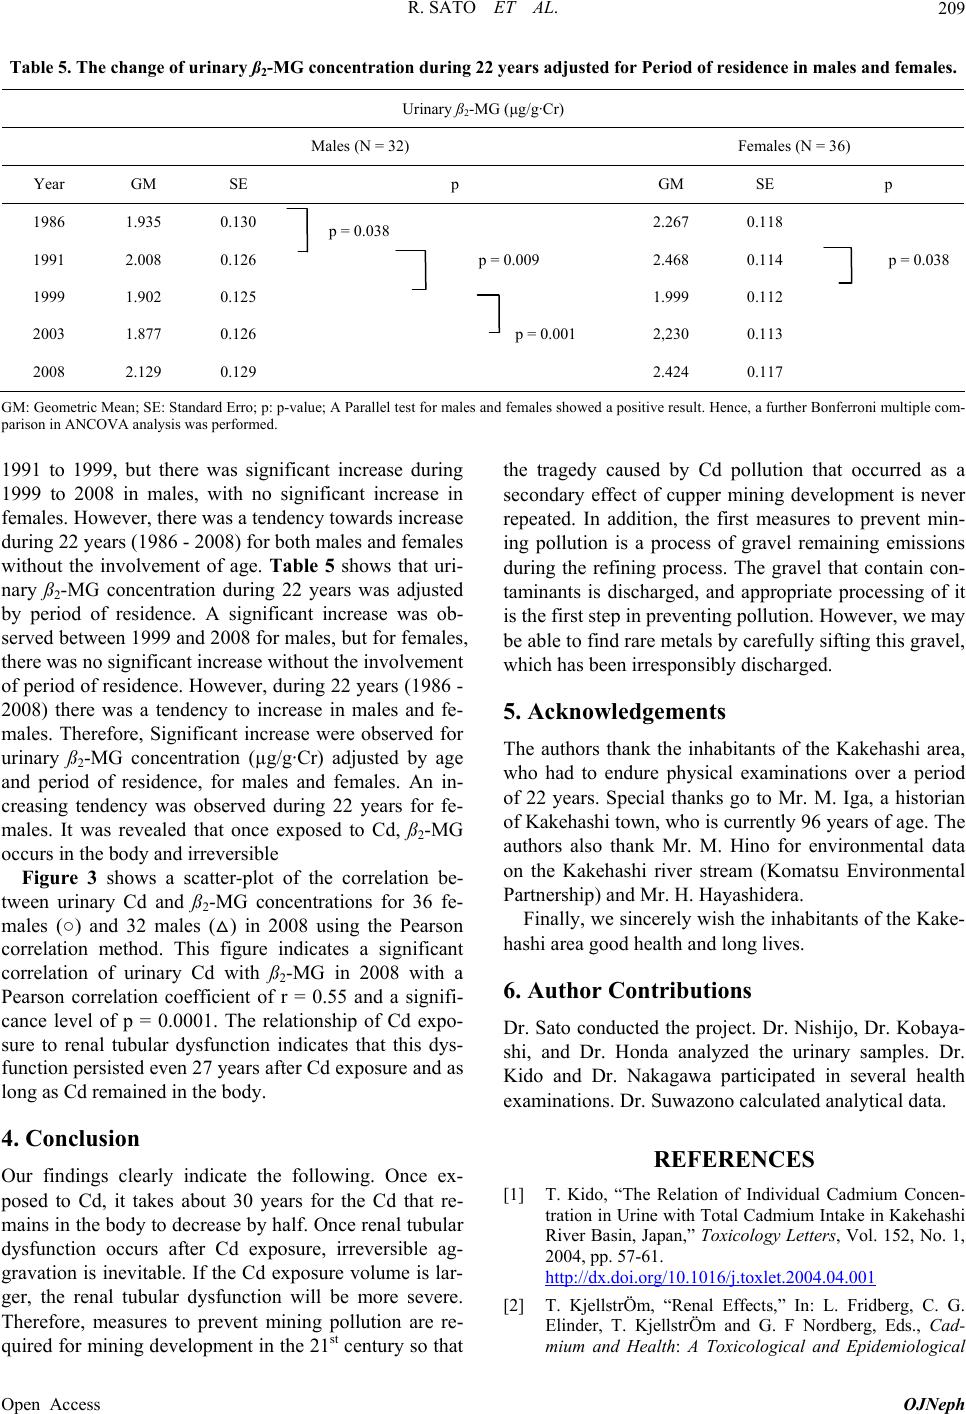 R. SATO ET AL. 209 Table 5. The change of urinary ß2-MG concentration during 22 years adjusted for Period of residence in males and females. Urinary ß2-MG (μg/g·Cr) Males (N = 32) Females (N = 36) Year GM SE p GM SE p 1986 1.935 0.130 p = 0.038 2.267 0.118 1991 2.008 0.126 p = 0.009 2.468 0.114 p = 0.038 1999 1.902 0.125 1.999 0.112 2003 1.877 0.126 p = 0.001 2,230 0.113 2008 2.129 0.129 2.424 0.117 GM: Geometric Mean; SE: Standard Erro; p: p-value; A Parallel test for males and females showed a positive result. Hence, a further Bonferroni multiple com- parison in ANCOVA analysis was performed. 1991 to 1999, but there was significant increase during 1999 to 2008 in males, with no significant increase in females. However, there was a tendency towards increase during 22 years (1986 - 2008) for both males and females without the involvement of age. Table 5 shows that uri- nary ß2-MG concentration during 22 years was adjusted by period of residence. A significant increase was ob- served between 1999 and 2008 for males, but for females, there was no significant increase without the involvement of period of residence. However, during 22 years (1986 - 2008) there was a tendency to increase in males and fe- males. Therefore, Significant increase were observed for urinary ß2-MG concentration (µg/g·Cr) adjusted by age and period of residence, for males and females. An in- creasing tendency was observed during 22 years for fe- males. It was revealed that once exposed to Cd, ß2-MG occurs in the body and irreversible Figure 3 shows a scatter-plot of the correlation be- tween urinary Cd and ß2-MG concentrations for 36 fe- males (○) and 32 males (△) in 2008 using the Pearson correlation method. This figure indicates a significant correlation of urinary Cd with ß2-MG in 2008 with a Pearson correlation coefficient of r = 0.55 and a signifi- cance level of p = 0.0001. The relationship of Cd expo- sure to renal tubular dysfunction indicates that this dys- function persisted even 27 years after Cd exposure and as long as Cd remained in the body. 4. Conclusion Our findings clearly indicate the following. Once ex- posed to Cd, it takes about 30 years for the Cd that re- mains in the body to decrease by half. Once renal tubular dysfunction occurs after Cd exposure, irreversible ag- gravation is inevitable. If the Cd exposure volume is lar- ger, the renal tubular dysfunction will be more severe. Therefore, measures to prevent mining pollution are re- quired for mining development in the 21st century so that the tragedy caused by Cd pollution that occurred as a secondary effect of cupper mining development is never repeated. In addition, the first measures to prevent min- ing pollution is a process of gravel remaining emissions during the refining process. The gravel that contain con- taminants is discharged, and appropriate processing of it is the first step in preventing pollution. However, we may be able to find rare metals by carefully sifting this gravel, which has been irresponsibly discharged. 5. Acknowledgements The authors thank the inhabitants of the Kakehashi area, who had to endure physical examinations over a period of 22 years. Special thanks go to Mr. M. Iga, a historian of Kakehashi town, who is currently 96 years of age. The authors also thank Mr. M. Hino for environmental data on the Kakehashi river stream (Komatsu Environmental Partnership) and Mr. H. Hayashidera. Finally, we sincerely wish the inhabitants of the Kake- hashi area good health and long lives. 6. Author Contributions Dr. Sato conducted the project. Dr. Nishijo, Dr. Kobaya- shi, and Dr. Honda analyzed the urinary samples. Dr. Kido and Dr. Nakagawa participated in several health examinations. Dr. Suwazono calculated analytical data. REFERENCES [1] T. Kido, “The Relation of Individual Cadmium Concen- tration in Urine with Total Cadmium Intake in Kakehashi River Basin, Japan,” Toxicology Letters, Vol. 152, No. 1, 2004, pp. 57-61. http://dx.doi.org/10.1016/j.toxlet.2004.04.001 [2] T. KjellstrÖm, “Renal Effects,” In: L. Fridberg, C. G. Elinder, T. KjellstrÖm and G. F Nordberg, Eds., Cad- mium and Health: A Toxicological and Epidemiological Open Access OJNeph 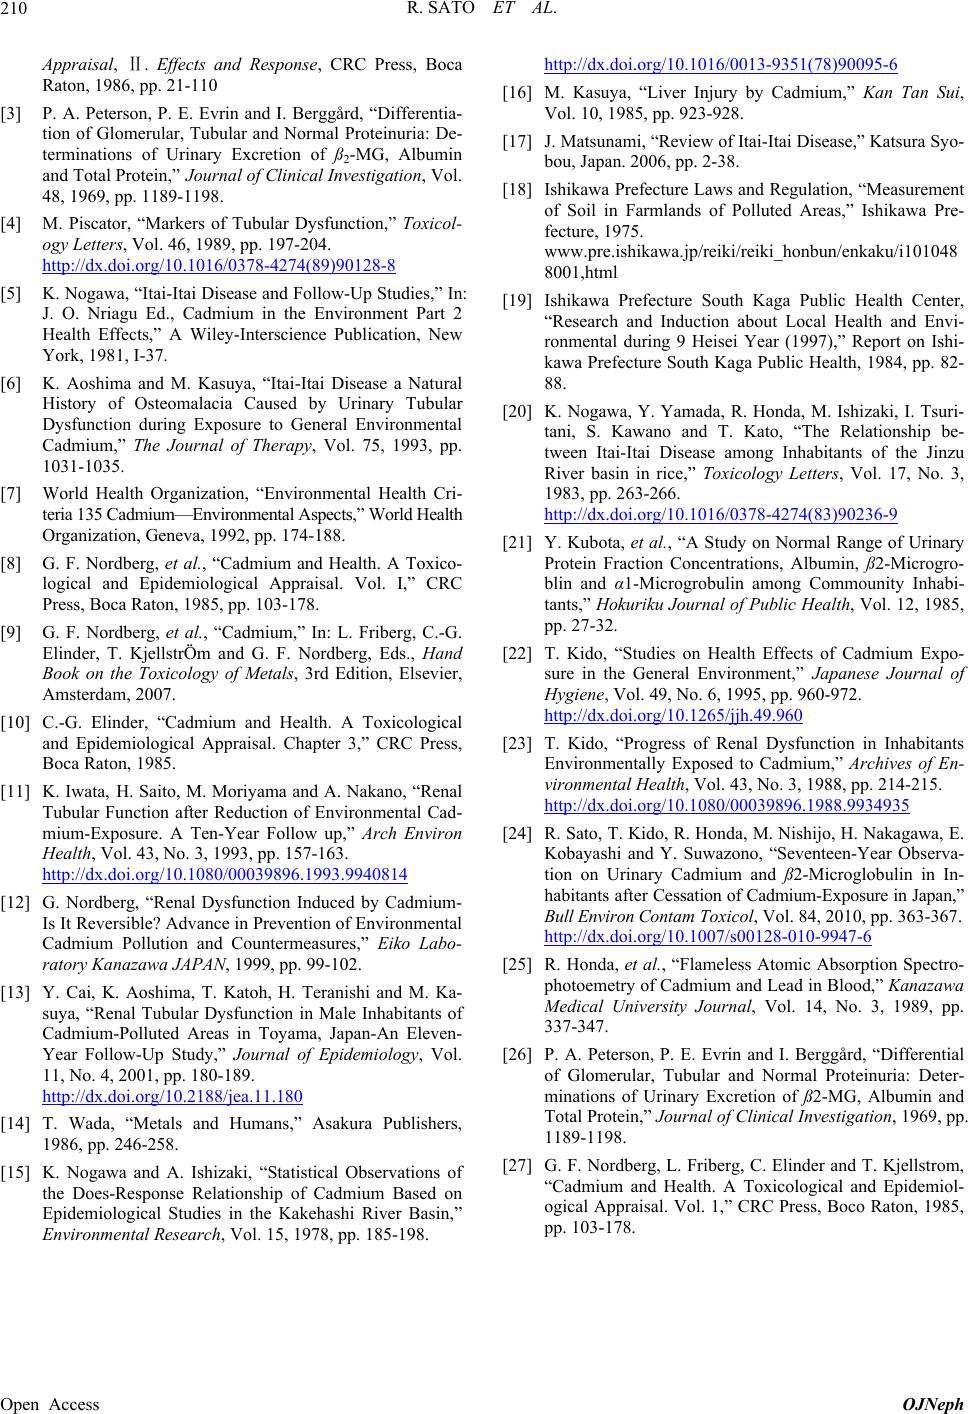 R. SATO ET AL. 210 Appraisal, .Ⅱ Effects and Response, CRC Press, Boca Raton, 1986, pp. 21-110 [3] P. A. Peterson, P. E. Evrin and I. Berggård, “Differentia- tion of Glomerular, Tubular and Normal Proteinuria: De- terminations of Urinary Excretion of ß2-MG, Albumin and Total Protein,” Journal of Clinical Investigation, Vol. 48, 1969, pp. 1189-1198. [4] M. Piscator, “Markers of Tubular Dysfunction,” Toxicol- ogy Letters, Vol. 46, 1989, pp. 197-204. http://dx.doi.org/10.1016/0378-4274(89)90128-8 [5] K. Nogawa, “Itai-Itai Disease and Follow-Up Studies,” In: J. O. Nriagu Ed., Cadmium in the Environment Part 2 Health Effects,” A Wiley-Interscience Publication, New York, 1981, I-37. [6] K. Aoshima and M. Kasuya, “Itai-Itai Disease a Natural History of Osteomalacia Caused by Urinary Tubular Dysfunction during Exposure to General Environmental Cadmium,” The Journal of Therapy, Vol. 75, 1993, pp. 1031-1035. [7] World Health Organization, “Environmental Health Cri- teria 135 Cadmium—Environmental Aspects,” World Health Organization, Geneva, 1992, pp. 174-188. [8] G. F. Nordberg, et al., “Cadmium and Health. A Toxico- logical and Epidemiological Appraisal. Vol. I,” CRC Press, Boca Raton, 1985, pp. 103-178. [9] G. F. Nordberg, et al., “Cadmium,” In: L. Friberg, C.-G. Elinder, T. KjellstrÖm and G. F. Nordberg, Eds., Hand Book on the Toxicology of Metals, 3rd Edition, Elsevier, Amsterdam, 2007. [10] C.-G. Elinder, “Cadmium and Health. A Toxicological and Epidemiological Appraisal. Chapter 3,” CRC Press, Boca Raton, 1985. [11] K. Iwata, H. Saito, M. Moriyama and A. Nakano, “Renal Tubular Function after Reduction of Environmental Cad- mium-Exposure. A Ten-Year Follow up,” Arch Environ Health, Vol. 43, No. 3, 1993, pp. 157-163. http://dx.doi.org/10.1080/00039896.1993.9940814 [12] G. Nordberg, “Renal Dysfunction Induced by Cadmium- Is It Reversible? Advance in Prevention of Environmental Cadmium Pollution and Countermeasures,” Eiko Labo- ratory Kanazawa JAPAN, 1999, pp. 99-102. [13] Y. Cai, K. Aoshima, T. Katoh, H. Teranishi and M. Ka- suya, “Renal Tubular Dysfunction in Male Inhabitants of Cadmium-Polluted Areas in Toyama, Japan-An Eleven- Year Follow-Up Study,” Journal of Epidemiology, Vol. 11, No. 4, 2001, pp. 180-189. http://dx.doi.org/10.2188/jea.11.180 [14] T. Wada, “Metals and Humans,” Asakura Publishers, 1986, pp. 246-258. [15] K. Nogawa and A. Ishizaki, “Statistical Observations of the Does-Response Relationship of Cadmium Based on Epidemiological Studies in the Kakehashi River Basin,” Environmental Research, Vol. 15, 1978, pp. 185-198. http://dx.doi.org/10.1016/0013-9351(78)90095-6 [16] M. Kasuya, “Liver Injury by Cadmium,” Kan Tan Sui, Vol. 10, 1985, pp. 923-928. [17] J. Matsunami, “Review of Itai-Itai Disease,” Katsura Syo- bou, Japan. 2006, pp. 2-38. [18] Ishikawa Prefecture Laws and Regulation, “Measurement of Soil in Farmlands of Polluted Areas,” Ishikawa Pre- fecture, 1975. www.pre.ishikawa.jp/reiki/reiki_honbun/enkaku/i101048 8001,html [19] Ishikawa Prefecture South Kaga Public Health Center, “Research and Induction about Local Health and Envi- ronmental during 9 Heisei Year (1997),” Report on Ishi- kawa Prefecture South Kaga Public Health, 1984, pp. 82- 88. [20] K. Nogawa, Y. Yamada, R. Honda, M. Ishizaki, I. Tsuri- tani, S. Kawano and T. Kato, “The Relationship be- tween Itai-Itai Disease among Inhabitants of the Jinzu River basin in rice,” Toxicology Letters, Vol. 17, No. 3, 1983, pp. 263-266. http://dx.doi.org/10.1016/0378-4274(83)90236-9 [21] Y. Kubota, et al., “A Study on Normal Range of Urinary Protein Fraction Concentrations, Albumin, ß2-Microgro- blin and α1-Microgrobulin among Commounity Inhabi- tants,” Hokuriku Journal of Public Health, Vol. 12, 1985, pp. 27-32. [22] T. Kido, “Studies on Health Effects of Cadmium Expo- sure in the General Environment,” Japanese Journal of Hygiene, Vol. 49, No. 6, 1995, pp. 960-972. http://dx.doi.org/10.1265/jjh.49.960 [23] T. Kido, “Progress of Renal Dysfunction in Inhabitants Environmentally Exposed to Cadmium,” Archives of En- vironmental Health, Vol. 43, No. 3, 1988, pp. 214-215. http://dx.doi.org/10.1080/00039896.1988.9934935 [24] R. Sato, T. Kido, R. Honda, M. Nishijo, H. Nakagawa, E. Kobayashi and Y. Suwazono, “Seventeen-Year Observa- tion on Urinary Cadmium and ß2-Microglobulin in In- habitants after Cessation of Cadmium-Exposure in Japan,” Bull Environ Contam Toxicol, Vol. 84, 2010, pp. 363-367. http://dx.doi.org/10.1007/s00128-010-9947-6 [25] R. Honda, et al., “Flameless Atomic Absorption Spectro- photoemetry of Cadmium and Lead in Blood,” Kanazawa Medical University Journal, Vol. 14, No. 3, 1989, pp. 337-347. [26] P. A. Peterson, P. E. Evrin and I. Berggård, “Differential of Glomerular, Tubular and Normal Proteinuria: Deter- minations of Urinary Excretion of ß2-MG, Albumin and Total Protein,” Journal of Clinical Investigation, 1969, pp. 1189-1198. [27] G. F. Nordberg, L. Friberg, C. Elinder and T. Kjellstrom, “Cadmium and Health. A Toxicological and Epidemiol- ogical Appraisal. Vol. 1,” CRC Press, Boco Raton, 1985, pp. 103-178. Open Access OJNeph |