

Paper Menu >>
Journal Menu >>
 American Journal of Analytical Chemistry, 2013, 4, 771-775 Published Online December 2013 (http://www.scirp.org/journal/ajac) http://dx.doi.org/10.4236/ajac.2013.412094 Open Access AJAC Studies on the Binding Mechanism of VB1 and VB9 with Trypsin Yan Gao, Congying Shao, Wanru Ji, Min Xiao, Fan Yi, Tong Zhou, Yanqin Zi Department of Chemistry and Materials Science, Huaibei Normal University, Huaibei, China Email: [email protected] Received November 16, 2013; revised December 18, 2013; accepted December 25, 2013 Copyright © 2013 Yan Gao et al. This is an open access article distributed under the Creative Commons Attribution License, which permits unrestricted use, distribution, and reproduction in any medium, provided the original work is properly cited. ABSTRACT The binding characteristics of vitamin B1 (VB1) and vitamin B9 (VB9) with trypsin were investigated by fluorescence spectrometry and UV/vis spectrophotometry under simulated physiological conditions. With the addition of VB1 or VB9, the intrinsic fluorescence emission intensity of trypsin was quenched by the nonradiative energy transfer mechanism. The fluorescence quenching process of trypsin may be mainly governed by a static quenching mechanism. The binding parameters such as the binding constants and the number of binding sites can be evaluated by fluorescence quenching experiments. The numbers of the apparent binding constant Kb of VB1-trypsin at different temperatures were 0.4948 and 4.8340 × 10⁴ L/mol and the numbers of binding sites n were 0.9359 and 1.1820. Similarly, the numbers of the apparent binding constant Kb of VB9-trypsin at different temperatures were 5.9310 and 13.040 × 10⁴ L/mol and the numbers of binding sites n were 0.9908 and 1.0750. The thermodynamic parameters, with a negative value of ΔG, revealed that the bindings are spontaneous processes and the positive values for both enthalpy change (ΔH) and entropy change (ΔS) in- dicate that the binding powers of VB1 and VB9 with trypsin are mainly hydrophobic interactions. And synchronous spectrums were used to study the conformational change of trypsin. In addition, the binding distances of VB1-trypsin and VB9-trypsin were estimated to be 0.55 nm and 0.87 nm according to the Förster’s resonance energy transfer theory. Keywords: Trypsin; VB1 and VB9; Fluorescence Spectrometry; Nonradiative Energy Transfer Mechanism 1. Introduction There are main functions of VB1 in sugar metabolism, energy metabolism and digestive system normal work [1]. VB9 is the floorboard of the compounds which contains pteroylglutamic acid and is well studied and separated from spinach leaf [2]. Proteins are important and wide- spread in kinds of biological macromolecules in living organisms and take part in almost all life processes. Trypsin is a serine proteinase, which hydrolyzes proteins and peptides at the carboxyl sides of arginine and lysine residues. Many investigations between proteins and vi- tamins have been published including bovine serum al- bumin [3-6] and human serum albumin [7-9], but the studies on the interaction between vitamin B and trypsin have not been reported. In this paper, the interactions between vitamin B and trypsin have been studied at dif- ferent temperatures under physiological conditions using UV/vis spectrophotometry and fluorescence spectrome- try. The effects of VB1 and VB9 on the trypsin have been evaluated and compared, such as quenching mechanism, binding constants, binding sites, binding mode and so on. 2. Experimental 2.1. Apparatus and Reagents An FP-8300 fluorescence spectrometer (Jasco, Japan) was used to record the fluorescence spectra in 1.00 cm quartz cell, a TU1901 UV/vis Spectrophotometer (PGeneral, Bei- jing, China) was employed to record the absorption spec- tra and a PHS-3C meter (Shanghai Precision Scientific Instrument Co., Ltd China) was used to measure the pH values of B-R buffer solutions. VB1 solutions (1.00 × 10⁻⁴ mol/L) were prepared by diluting 0.0094 g (337.27 Da, Sinopharm Chemical Ren- gent Co., Ltd, Shanghai, China) in 250.00 mL of deion- ized water. VB9 solutions (1.00 × 10⁻⁴ mol/L) were dis- solved by diluting 0.0110 g (441.41 Da, Tianjin recovery fine chemical industry research institute, Tianjing, China) in 250.00 mL of deionized water. Trypsin solutions (1.00 × 10⁻⁴ mol/L) were prepared by diluting 0.6005 g of trypsin (24000 Da, Sinopharm Chemical Rengent Co., 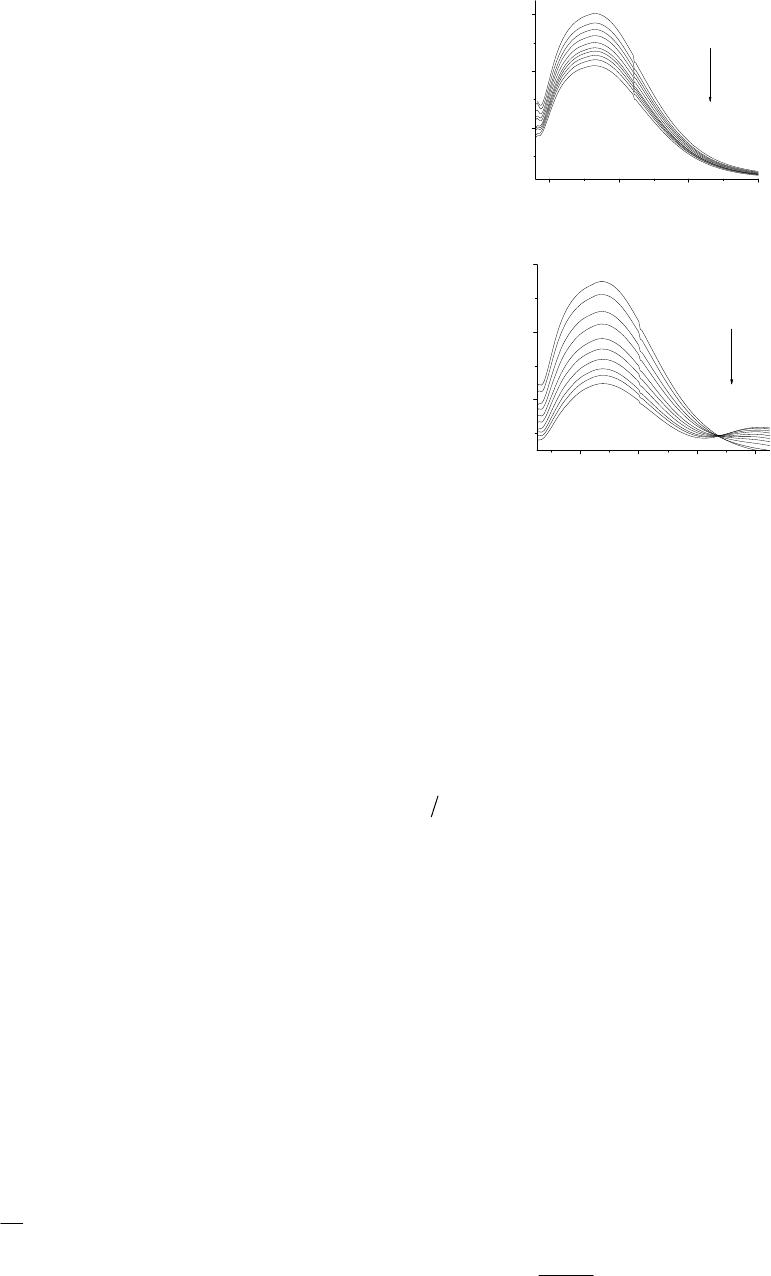 Y. GAO ET AL. 772 Ltd, Shanghai, China) in 250.00 mL of water. Britton- Robinson (B-R) buffer solutions (pH = 7.90) were pre- pared by combining a mixed acid (composed of 0.04 mol/L of H3PO4, HAc, and H3BO 3) with 0.20 mol/L of NaOH in equal proportions. NaCl (0.20 mol/L) were dissolved to adjust the ionic strength of the VB1-trypsin and VB9- trypsin solutions so as to study the effects of electrolytes on binding. All solutions were prepared using double-dis- tilled, deionized water and the reagents were of analytical reagent grade. In the experiments, a known volume stan- dard of VB1 or VB9 solutions were added in 10.00 mL calibrated tubes with deionized water and mixed well. 2.2. General Procedure In 10.00 mL calibrated tubes, 1.00 mL B-R buffer solu- tions (pH = 7.90), 1.00 mL of 1.00 × 10⁻⁴ mol/L trypsin solutions and a known volume of the standard VB1 or VB9 solutions were added. Then the mixture were diluted to 10.00 mL with NaCl (0.20 mol/L) and mixed thor- oughly by shaking. After reaction for 30 min, the solu- tions were taken into the optical cell. The system’s fluo- rescence spectra wavelengths were recorded from 290 nm to 450 nm and the bandwidths were 5 nm. 3. Results and Discussion 3.1. Fluorescence Quenching Spectra and Quenching Mechanism of VB1 and VB9 with Trypsin Figure 1 shows that fluorescence emission spectra of trypsin with the increasing concentrations of VB1 and VB9 following an excitation wavelength at 281 nm. Tryp- sin shows a fluorescence emission with a peak at 340 nm. The fluorescence intensity of trypsin decreased gradually with the increasing concentrations of vitamin B, and higher concentrations led to more efficient quenching of the tryptic fluorescence. By comparison, it was known that VB9 led to more apparently efficient quenching of the protein fluorescence than VB1. Such a quenching clearly indicated the binding of VB1 and VB9 with tryp- sin. Meanwhile, there are not a shift of maximum emis- sion peaks, indicating that vitamin B didn’t influence the microenvironment around trypsin. The fluorescence quen- ching mechanisms usually contain dynamic quenching and static quenching, which are caused by diffusion and ground-state complex formation spectively [10,11]. In order to further clarify the fluorescence quenching me- chanism induced by vitamin B, the Stern-Volmer equa- tion get used to evaluate the data. 0 0 11 sv q F K QKQ F (1) where F0 and F represent the steady-state fluorescence intensities in the absence and presence of the quencher, 300 350 400 450 200 400 600 Fluorescence intensity Wavelength(nm) 1 10 VB1 (a) 320 360 400440 200 400 600 Fluorescence intensity Wavelength(nm) 1 10 VB9 (b) Figure 1. (a) Evolution of fluorescence spectra of trypsin in presence of VB1 with different concentrations. (b) Evolution of fluorescence spectra of trypsin in presence of VB9 with dif- ferent concentrations. [Trypsin] = 1.0 × 10⁻⁵ mol/L; [VB1] × 10−5 mol/L, 1-10: 0.00, 0.50, 1.00, 1.50, 2.00, 2.50, 3.00, 3.50, 4.00, 4.50, [VB9] × 10−5 mol/L, 1-10: 0.00, 0.10, 0.30, 0.50, 0.70, 0.90, 1.10, 1.30, 1.50, 1.70, λex = 281 nm, λem = 340 nm; pH = 7.90; T = 300 K. respectively; Q is the concentration of quencher; s v K is the Stern-Volmer quenching constant; q K is the bi- molecular quenching rate constant and q K is equal to 0sv K ; 0 is the average lifetime of the molecule without any quencher and this 0 = 10−8 s [12]. The Stern-Volmer curves at two temperatures were shown in Figure 2. The values of s v K and q K derived from Equation (1) are listed in Table 1. The minimum value of q K as shown in Table 1 is 8.621 × 10¹¹ L/(mol·s), which is greater than the maximum diffusion collision quenching rate constant of 2.0 × 10¹⁰ L/(mol·s) [13]. So it indicated that the fluorescence quenching process of trypsin with VB1 and VB9 may be mainly governed by a static quenching mechanism. 3.2. Binding Constant and Number of Binding Site In static quenching process, when small molecules are bound independently to a set of equivalent sites on a macromolecule, the equilibrium between free and bound molecules is given by Equation (2) [14]: 0 loglog log b FF K nQ F (2) Open Access AJAC 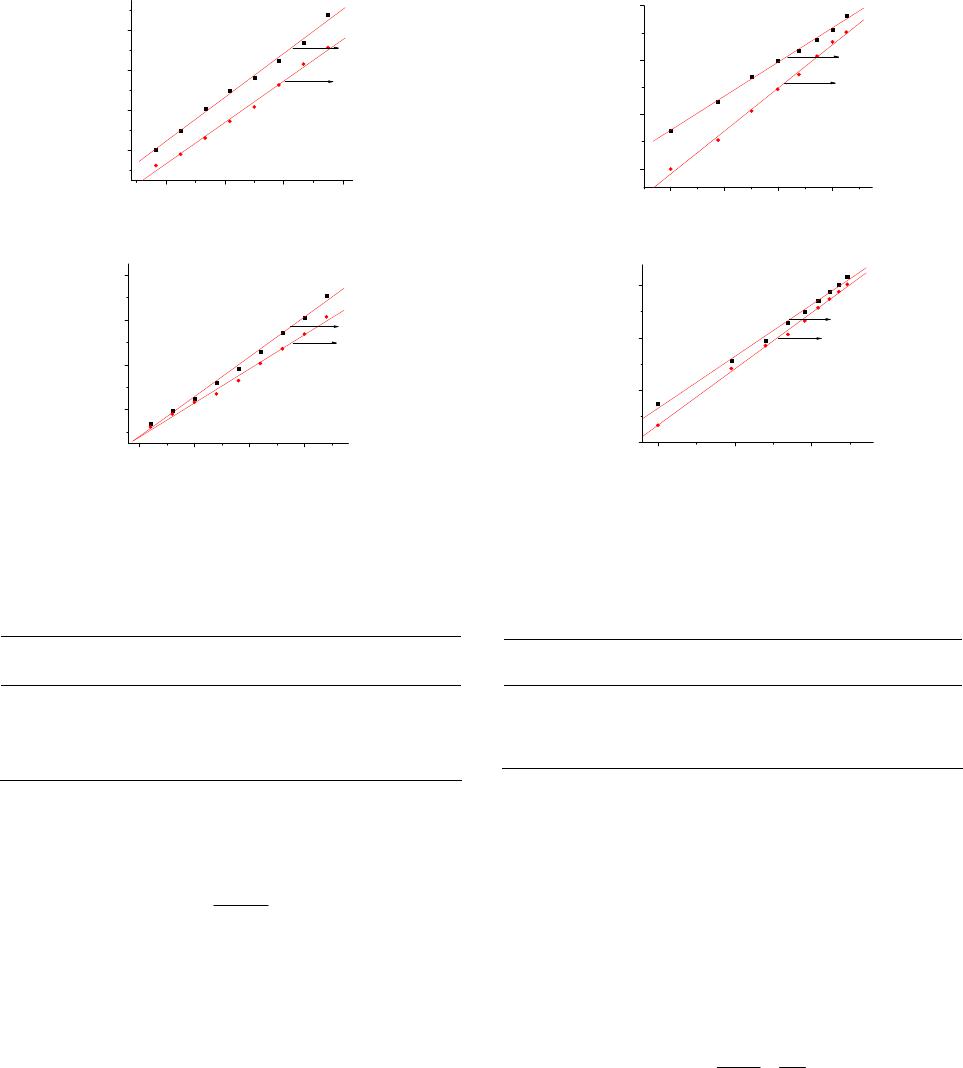 Y. GAO ET AL. 773 1.2 2.4 3.6 4.8 1.1 1.2 1.3 1.4 FO/F [Q]( 10-5 M) 300K VB1 309K (a) 0.0 0.5 1.0 1.5 1.2 1.6 2.0 2.4 FO/F [Q]( 10-5 M) 300K 309K VB9 (b) Figure. 2. The Stern-Volmer plots of the trypsin-VB1 and trypsin-VB9 systems at different temperatures. Table 1. Stern-Volmer quenching constants for the VB1- trypsin and VB9-trypsin systems at pH = 7.9. Drug T K KSV 104 L/mol R Kq 1012L/(mol·s) VB1 300 ± 1 309 ± 1 0.9159 0.8621 0.9977 0.9977 0.9159 0.8621 VB9 300 ± 1 309 ± 1 7.0920 6.0720 0.9973 0.9963 7.0920 6.0720 where b K is the binding constant and n is the number of binding sites. The values for b K and n at different tem- peratures can be derived in Figure 3 from the intercept and slope of plots of 0 log F F F versus log Q based on Equation (2), which are listedTabl e in 2. b K shows 3.3. Thermodynamic Parameters and Nature of The es contributing to drug-biomolecule that there are a strong interaction and a comp forma- tion between trypsin with VB1 and VB9. Furthermore, it can be inferred from the values of n that there is an inde- pendent class of binding sites on trypsin with VB1 and VB9. But it appears that the binding constants and the number of binding sites also increase with higher tem- perature [15,16]. So this may be because the capacity of VB1 and VB9 binding to trypsin is enhanced with in- creasing temperature. lex Binding Mode intermolecular forc interactions with drugs may include hydrogen bonds, -5.0 -4.8 -4.6 -4.4 -1.2 -0.9 -0.6 -0.3 lg[(FO-F)/F] lg[Q] 300K 309K VB1 (a) -6.0 -5.5 -5.0 -1.5 -1.0 -0.5 0.0 lg[(FO-F)/F] lg[Q ] 300K 309K VB9 (b) Figure 3. lg(F0-F)/F against lg[Q] at two temperatures of Table 2. Binding constants an thermodynamic parameters Drug 105 oln R Kl K l ΔS J/( two systems. d of VB1 and VB9 with trypsin at two temperatures. T K ΔG ΔH KL/m J/mo J/mo mol·K) VB1 0. 0.300 309 0.4948 4.8340 9359 1.1820 9982 0.9981 −21.22 −21.71 195.2 195.2 721.3 721.3 VB9 300 309 5.9310 13.040 0.9908 1.0750 0.9971 0.9986 −27.41 −30.26 67.46 67.46 316.2 316.2 Van der Waals interactions, electrostatic interactions and hydrophobic force, etc. The thermodynamic parameters were analyzed by temperature in order to provide strong evidence for the presence of binding forces. The value of enthalpy change ( H ) and entropy change (S ) can be determined by the n’t Hoff Equation (3), if the en- thalpy change ( va H ) does not vary significantly with temperature. Thee of free energy change (G valu ) for a binding interaction at different temperatures cbe de- termined by the Equation (4). an ln b H S KRT R (3) ln b GRTK (4) where b K is the binding constant, R is the gas constant and T is the absolute temperature. The values of H , S and G are listed in Table 2. A negative valf ue o G reveals that the binding process is spontaneous. ophobic interactions play main roles in the binding between trypsin with VB1 and VB9 because the values of Hydr H and S are positive. Open Access AJAC 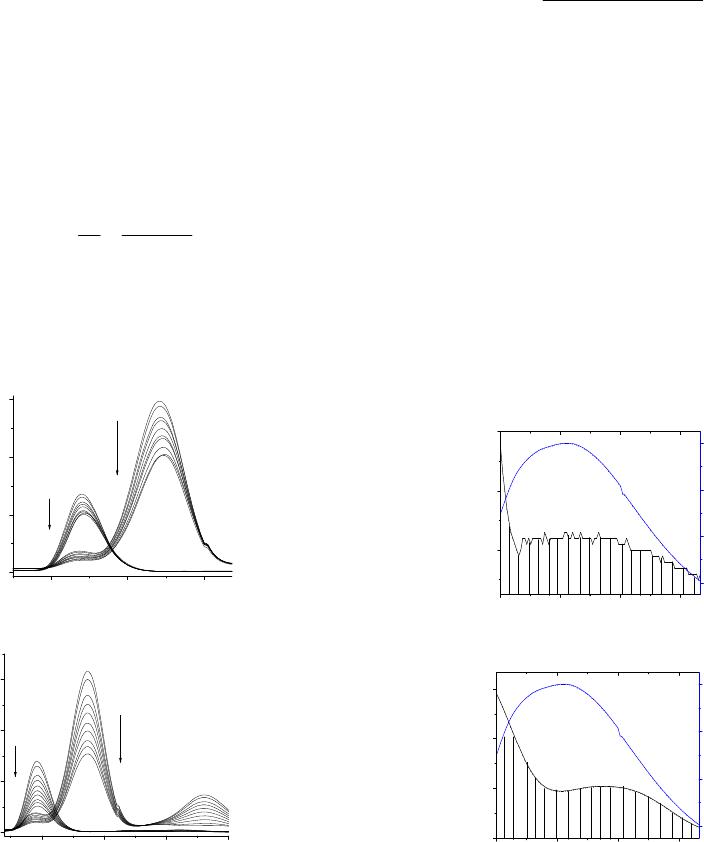 Y. GAO ET AL. 774 3.4. Synchronous Fluorescence Spectroscopy sed Synchronous fluorescence spectroscopy is usually u to investigate the microenvironment around the fluoro- phore functional groups. At = 60 nm, the synchro- nous fluorescence spectra arttributed to tryptophan, while e a = 15 nm, the spectra are attributed to tyrosine. Synchrus fluorescence spectra of trypsin with addi- tion of VB1 are shown in Figure 4(a) and these with ad- dition of VB9 are shown in Figure 4(b). From Figure 4, the emission maxima have no shifts with regards to VB1 and VB9, which indicates that there was no change of the microenvironment of the tryptophan and tyrosine. ono 3.5. Energy Transfer and Binding Distance with The fluorescence quenching of trypsin after binding VB1 and VB9 indiactes that the tranfer of energy has oc- curred. According to Förster’s resonance energy transfer theory [17], the distance between two interacting mole- cules and the efficiency of energy transfer can be dis- cribed by the following equation: 6 0 6 00 1R 6 EFRR (5) where E is the energy transfer efficiency, F is the fluor- F scence intensity of the donor in the presence of equal amounts of accepter, F0 is the fluorscence intensity of the donor in the absence of equal amounts of accepter, R0 is 280 320 360 0 150 300 450 nm Flourenscence Indencity Wavelength(nm) 1 10 1 10 nm VB1 (a) 300 350 400 450 0 150 300 450 nm nm 1 10 10 Flourenscen c e Indencity Wavelength(nm) 1 VB9 (b) Figure 4. (a) Evolution of syronous fluorescence spectra absence and presence of VB9, T = 300 K. J nch of trypsin in the absence and presence of VB1; (b) Evolu- tion of synchronous fluorescence spectra of trypsin in the the critical distance, and R is the distance between ac- ceptor and donor. The quantity 6 R is 0calculated by the following equation: 6254 0 R 2 8.8 10KN (6) where K2 is the spatial orientation factor of the dipole, N is the refractive index of the medium, Φ is the fluores- cence quantum yield of the donor, J is the overlap inte- gral of the fluorescence emission spectrum of the donor and the absorption spectrum of the acceptor. J is calcu- lated using the equation: 4 F JF (7) where F(λ) is the fluorescence intensity of the fluores- cence donor when the wavelength is λ and ε(λ) is the molar absorbance coefficient of the acceptor when the wavelength is λ. It has been reported that K2 = 2/3, N = 1.336, and Φ = 0.118. Figure 5 shows that the spectral overlap between the fluorescence emission spectrum of trypsin and UV/vis absorption spectrum of VB1 and VB9. From the above relationships, J = 3.79× 10⁻¹⁹ cm3·l·mol−1, R0 = 0.45 nm, E = 0.79 and R = 0.55 nm for trypsin and VB1. Similarly, J = 7.96 × 10⁻¹⁷ cm3·l·mol−1, R0 = 0.87 nm, E = 0.23 and R = 0.87 nm for trypsin and VB9. The distance R < 8 nm between donor and acceptor indicates that the energy transfer from trypsin to VB1 and VB9 occurred with high possibility. This obeyed the condi- tions of Förster energy transfer theory. 300 330 360 390 0.00 0.01 0.02 Wavelength( nm) Abosorbance VB1 B A1 100 200 300 400 Fluroscence Inensity (a) 300 330 360 390 0.0 0.3 0.6 0.9 Wavelength( nm) Abosorbance B A2 VB2 100 200 300 400 Fluroscence Inensity (b) Figure 5. Spectral overlap een fluorescence spectrum of trypsin (B) and absorbanpectrum of VB (A) and betw ce s1 1 VB9 (A2) at 300 K; [trypsin] = [VB1] = 5.0 × 10⁻⁵ mol/L, [trypsin] = [VB9] = 5.0 × 10⁻⁵ mol/L. Open Access AJAC  Y. GAO ET AL. Open Access AJAC 775 nteractions between two kinds of vita- 4. Conclusion In this paper, the i min B and trypsin have been investigated under simu- lated physiological conditions using spectrometries. The fluorescence of trypsin was quenched by two kinds of vitamin B mainly through static quenching. The enthalpy change ( H ) and entropy change (S) for the systems were calculated respectively. The positive H and S values indicated that hydrophobic interactions played main roles in the binding between trypsin and vitamin B. A binding distance R of 0.55 nm and 0.87 nm between donor and acceptor was obtained. According to the data, the two B vitamins have similar interactions with trypsin. The results obtained are of important biological signifi- cance in pharmacology and clinical medicine. 5. Acknowledgements This work was supported by the Natural Science Founda- REFERENCES [1] H. B. Xue, C. Q. Zhang Interaction of Albumin,” Chinese . L. Liu, “Spectroscopic Study on Binding of BSA and Nico- luorescence Spectroscopy,” Journal s on Interaction Between Bovine Serum Albumin y on Binding of . Z. Meng and S. Z. Fu, “The Interaction of Y. X. Dai, “Studies on the Interaction of DNA Folic Acid to Human Serum Albumin,” Chinese Journal of Spectroscopy Laboratory, Vol. 29, No. 7, 2009, pp. 1915-1919. [8] J. L. Wang, L. C. Fu, S. W. Zhou, Z. J. Chen, W. B. Lu, X. M. Ye, G Vitamin B6 with the Human Serum Albumin,” Spectro- scopy and Spectral Anaiysis, Vol. 25, No. 6, 2005, pp. 912-915. [9] N. Zhang, C. X. Xu, Q. Wei, B. Du, R. Li, T. G. Zhang, D. Wu and with Vitamin B12 Based on the Immobilization of dsDNA on Nano-Scale Hydroxyapatitle Coating,” Advanced Ma- terials Letters, Vol. 1, No. 1, 2010, pp. 34-39. http://dx.doi.org/10.5185/amlett.2010.3104 [10] Z. Q. Jing, Y. H. Chi, J. Zhuang, X. Y. Bi and “Mechanism Studies on the Combination L. Zhou, Reaction be- ticoagulant Rodennticide tween Bovine Serum Albumin and Zincon by Fluore- scence Spectra,” Spectroscopy and Spectral Analysis, Vol. 27, No. 5, 2007, pp. 986-990. [11] J. H. Tang, S. D. Qi and X. G. Chen, “Spectroscopic Studies of the Interaction of An tion of Anhui Province Ministry of Education (No. KJ2012B169). Diphacinone with Human Serum Albumin,” Journal of Molecular Structure, Vol. 779, No. 1-3, 2005, pp. 87-95. http://dx.doi.org/10.1016/j.molstruc.2005.07.023 [12] J. R. Lakowicz and G. Weber, “Quenching of Fluore- scence by Oxygen, Probe for Structural Fluctuations in Macromolecules,” Biochemistry , Vol. 12, No. 21, 1973, pp. 4161-4170. http://dx.doi.org/10.1021/bi00745a020 [13] X. Z. Feng, Z. Lin, L. J. Yang, C. Wang and C. L. Bai, “Investigation of the Interaction between Acridine Oran . Y. Li, L. C. Gao and G VB and Bovine Serum , “The 1 Journal of Analysis Laboratory, Vol. 30, No. 4, 2011, pp. 111-114. [2] H. J. Liu, P. Li, Y. D. Zhang, C. Guo, J. Y. Deng, J. W. Cai and B ge and Bovine Serum Albumin,” Talanta, Vol. 47, No. 5, 1998, pp. 1223-1229. http://dx.doi.org/10.1016/S0039-9140(98)00198-2 [14] M. Jiang, M. X. Xie, Y. Liu, X. Y. Li and X. “Spectroscopic Studies on the Interaction of Cin Folic Acid to Human Serum Albumin,” Spectroscopy and Spectral Analysis, Vol. 29, No. 7, 2009, pp. 1915-1919. [3] Y. H. Shang, H. Li, J. J. Sun and M. Y. Zhang, “Study on the Interaction of Bovine Serum Albumin with Riboflavin Chen, namic Acid and Its Hydroxyl Derivatives with Human Serum Albumin,” Journal of Molecular Structure, Vol. 692, No. 1-3, 2004, pp. 71-80. http://dx.doi.org/10.1016/j.molstruc.2004.01.003 [15] T. Förster, “Modern Quantum Chemistry,” In: O. Sinao- glu, Ed., Vol. 3, Academic Press, New York, 1965 by Fluorescence Spectroscopy,” Journal of Anal Ytical Science, Vol. 26, No. 1, 2010, pp. 67-70. [4] L. Q. Sheng, X. Y. Yan, H. J. Xu, H. W. Tong and S. M. Liu, “Study on the Interaction between . uler’ tine,” Spectroscopy and Spectral Analysis, Vol. 27, No. 2, 2007, pp. 306-308. [5] A. M. Zhang, “Study on the Interaction Between VB2 and Serum Albumin by F [16] G. Cristobal, R. Dos and D. M. Pierre, “Fluorescence Re- sonance Energy Transfer Spectroscopy Is a Reliable ‘R for Measuring Structural Changes in Proteins: Dispelling the Problem of the Unknown Orientation Factor,” Journal of Structural Biology, Vol. 115, No. 2, 1995, pp. 175-185. http://dx.doi.org/10.1006/jsbi.1995.1042 [17] D. C. Saha, K. Ray and T. N. Misra, “Energy Transfer in Triton-X 100 Micelles: A Fluorescence S of Nanchang University, Vol. 30, Suppl., 2006, pp. 1087- 1088. [6] Y. H. Fan, F. Feng, Z. Z. Chen and S. M. Shuang, “Studie tudy,” Spectro- and Vitamin B12 by Fluorescence Spectrometry,” Chinese Journal of Spectroscopy Laboratory, Vol. 28, No. 3, 2011, pp. 1331-1335. [7] H. J. Liu, P. Li, Y. D. Zhang, C. Guo, J. Y. Deng, J. W. Cai and B. L. Liu, “Spectroscopic Stud chimica Acta Part A, Vol. 56, No. 4, 2000, pp. 797-801. http://dx.doi.org/10.1016/S1386-1425(99)00169-9 |