

Paper Menu >>
Journal Menu >>
 iBusiness, 2013, 5, 173-183 Published Online December 2013 (http://www.scirp.org/journal/ib) http://dx.doi.org/10.4236/ib.2013.54022 Open Access IB 173 An Early Warning Model with Technical Indicators: The Case of Ise (Istanbul Stock Exchange) Kutluk Kagan Sumer Department of Econometrics, Faculty of Economics, Istanbul University, Istanbul, Turkey. Email: [email protected] Received June 14th, 2011; revised July 12th, 2013; revised August 10th, 2013 Copyright © 2013 Kutluk Kagan Sumer. This is an open access article distributed under the Creative Commons Attribution License, which permits unrestricted use, distribution, and reproduction in any medium, provided the original work is properly cited. ABSTRACT In this study, the technical indicators are used in forecasting whether stock prices will rise, fall or will be constant at the following day. The indicators are generated by taking into account the daily stock returns. If the daily stock returns are positive, the indicator is coded as “+1”; if the daily stock returns are constant, the indicator is coded as “0” and at least if the daily stock returns are negative, the indicator is coded as “−1”. These indicator values express the dependent vari- able of ordered choice models which independent variables are technical indicators. The ordered choice models are ap- plied to all of the stocks of ISE (Istanbul Stock Exchange). Keywords: Stock Exchange; ISE; Technical Analysis; Technical Indicators; Early Warning; Ordered Choice 1. Introduction The computation and interpretation of the technical indi- cators take place according to the methods described in the methodology. With the computation of the daily in- dicator value “NSI”, which represents a conclusion value as the dependent variable, the individual parameters of the respective technical indicators of a share of the tech- nical indicators of the one day lagged are determined. With a rising NSI (New Stock Indicator), the indicator value (+1) was assigned to the shares, which were con- sulted in the model category three for the computation of the new indicator value “NSI”, the shares of a constant “NSI” with the indicator value (0) and the shares of a falling “NSI” with the indicator value (−1). During the dissolution, this model was used for the dependent vari- ables and their categorization, the Ordered Choice model, whereby lining the variable (−1), (0) and (+1) with the use of this model put up close. The Ordered Choice methodology is used among other things with the determination by economic cycles: How did the prices develop in the past period Pt? What for a price history is expected in the coming pe- riod Pt * [1]? King, Nerlove, Ottenwaelter and Oudiz have in their work: Pt * as conditionally distributed regarded and with that adaptive expactations model for Pt−q * and Pt compared Pt * as conditionally distributed regarded and with the extrapolative models for Pt−q *, Pt compared. A general error correction mechanism is used derived by using Pt *. E(Pt) represents thereby the variable for Pt * for changes of expectation, is “trichotomous” and takes the following values (Table 1): The computation of the Ordered Logit and Ordered Probit models is based on the Maximum Likelihood me- thod. Like already with the technical analysis on the basis of the conclusion values of the past periods, the future de- velopment of the conclusion values is mentioned and estimated. With this kind of the estimation, the conclu- sion values of shares show dependence and it becomes repetitive share price history. The following acceptance of the model is on the basis of technical models: The share prices are determined by supply and de- mand. Supply and demand occur by external factors i.e. in- flation, interest rates, exchange rates etc. Easy share price fluctuations are neglected; do recog- nize trends with the share prices. The changes are at trends due to changes in supply and demand. The changes in supply and demand are responsible for  An Early Warning Model with Technical Indicators: The Case of Ise (Istanbul Stock Exchange) 174 Table 1. Values of Pt*\Pt+1. P t*\Pt+1* Rising = + + Constant − = + Falling − − = the fact that it comes to the changes of trends pursued by the share prices. The technical analysts call the applica- tion of the technical analysis instead of fundamental analysis according to following reasons: The fundamental analysis is time-consuming and de- pendent to its user’s economic basic knowledge. In contrast to it, the simple basic knowledge is sufficient for the application of the technical analysis. For this reason by small investors, the technical analysis is preferred. The confrontation of the investors with similar formations and indicators leads to the fact that you display homogeneous actions and because of these actions, supply and demand are affected. The fundamental analysis helps to become attentive on shares with low prices and to make plans possible into this security. The success of such a plan depends on the fact that the remaining investors become atten- tive to these shares and their offers thus increase, so that it comes by it to share price increases. Users of the technical analysis are not on those bal- ances and success estimations, which are however not set up after according to tax law principles the actual costing and yield structure to again-reflect, instructed. The results of the fundamental analysis illustrate the central to long-term price change. With the technical analysis, it is possible to use short term data in in- vestment decisions. Speculative price history is not illustrated with the fundamental analysis. The technical analysis is proved with speculative shares as particularly sensitive to the analysis method. Speculations lead to the revaluation of shares, whereby the financial indicators at force of expression lose. 2. Methodology: Ordered Choice Models The many of the Multinomial Choice variables are auto- matically arranged. In the literature the following exam- ples are called: [2] Security evaluations [3]; Results of sample tests; Public opinion polls; Dispatching from military personnel to place qualifi- cations after qualification level; Election results with certain programs. In requirement taken insurance level by consumers: no partial, full demand Occupation: Full employment, part- time work, unemployment. At all these cases, although the result is discrete, the Multinomial Logit and Probit models would fail to the dependent variable with ordinal nature. Usually regres- sion analyses are into the opposite direction. If one re- gards for example the result of sample tests or a public opinion poll, then arises: if the effect with 0, 1, 2, 3 or 4 is coded, the linear involution represents the difference between 4 and 3, equal the difference between 3 and 2. The Ordered Probit and Logit of models finds a strong use as an analysis stand (Zavoina and McElvey, 1975) [4]. The Ordered Probit model is set up, like the Bino- mial Probit model, for a latent involution. The initial equation reads: yx Usually y* the non-observed variable represents. It represents a form of the censorship. One observes: 1 12 0if 0 1if0 2if y yy y Those are unknown parameters, also become esti- mated. During the view of a public opinion poll we can see that all asked persons have their own feeling intensity, those from the measurable factors x and did not deter- mine not observed factors depend. They can answer to the questions with their own y*, if this is permitted. With five possible answers for example given, they select that one, which corresponds to its feelings during the given question at most [5]. Assumed is normal distributed with constant vari- ance. From the same reasons as in the binomial probit model (special case J = 1), becomes the average value and the variance of to 0 and 1 normalizes. The model can be distributed also with a logistically distributed dis- turbance. This trivial modification of the formula does not seem to make a real difference in practice. The following probabilities result in the case of normal distribution: 1 21 Prob 0 Prob 1 Prob 2 yx yx yx x x For all positive probabilities is the result 12 01 J Figure 1 shows the effects of the structure. It is a gen- eralized case of the probit of model represented above. The log Likelihood function and its derivative can be Open Access IB 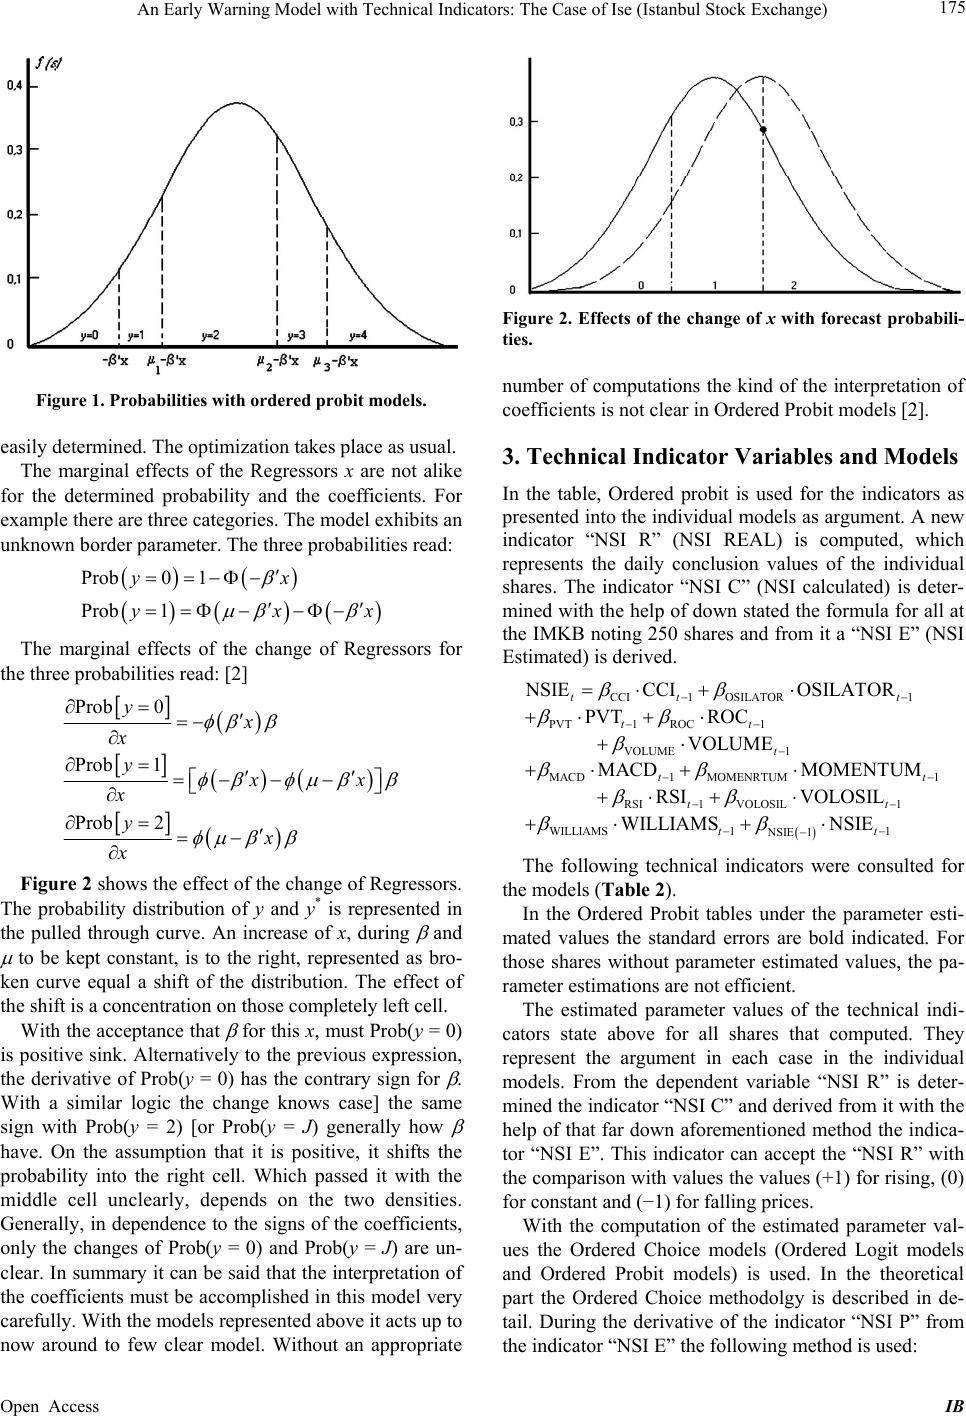 An Early Warning Model with Technical Indicators: The Case of Ise (Istanbul Stock Exchange) 175 Figure 1. Probabilities with ordered probit models. easily determined. The optimization takes place as usual. The marginal effects of the Regressors x are not alike for the determined probability and the coefficients. For example there are three categories. The model exhibits an unknown border parameter. The three probabilities read: Prob0 1 Prob 1 yx yx x The marginal effects of the change of Regressors for the three probabilities read: [2] Prob 0 Prob 1 Prob 2 yx x yxx x yx x Figure 2 shows the effect of the change of Regressors. The probability distribution of y and y* is represented in the pulled through curve. An increase of x, during and to be kept constant, is to the right, represented as bro- ken curve equal a shift of the distribution. The effect of the shift is a concentration on those completely left cell. With the acceptance that for this x, must Prob(y = 0) is positive sink. Alternatively to the previous expression, the derivative of Prob(y = 0) has the contrary sign for . With a similar logic the change knows case] the same sign with Prob(y = 2) [or Prob(y = J) generally how have. On the assumption that it is positive, it shifts the probability into the right cell. Which passed it with the middle cell unclearly, depends on the two densities. Generally, in dependence to the signs of the coefficients, only the changes of Prob(y = 0) and Prob(y = J) are un- clear. In summary it can be said that the interpretation of the coefficients must be accomplished in this model very carefully. With the models represented above it acts up to now around to few clear model. Without an appropriate Figure 2. Effects of the change of x with forecast probabili- ties. number of computations the kind of the interpretation of coefficients is not clear in Ordered Probit models [2]. 3. Technical Indicator Variables and Models In the table, Ordered probit is used for the indicators as presented into the individual models as argument. A new indicator “NSI R” (NSI REAL) is computed, which represents the daily conclusion values of the individual shares. The indicator “NSI C” (NSI calculated) is deter- mined with the help of down stated the formula for all at the IMKB noting 250 shares and from it a “NSI E” (NSI Estimated) is derived. CCI1 OSILATOR1 PVT1 ROC1 VOLUME 1 MACD1 MOMENRTUM1 RSI1 VOLOSIL1 WILLIAMS 11 NSIE 1 NSIE CCIOSILATOR PVT ROC VOLUME MACD MOMENTUM RSI VOLOSIL WILLIAMS NSIE tt t tt t tt tt tt The following technical indicators were consulted for the models (Table 2). In the Ordered Probit tables under the parameter esti- mated values the standard errors are bold indicated. For those shares without parameter estimated values, the pa- rameter estimations are not efficient. The estimated parameter values of the technical indi- cators state above for all shares that computed. They represent the argument in each case in the individual models. From the dependent variable “NSI R” is deter- mined the indicator “NSI C” and derived from it with the help of that far down aforementioned method the indica- tor “NSI E”. This indicator can accept the “NSI R” with the comparison with values the values (+1) for rising, (0) for constant and (−1) for falling prices. With the computation of the estimated parameter val- ues the Ordered Choice models (Ordered Logit models and Ordered Probit models) is used. In the theoretical part the Ordered Choice methodolgy is described in de- tail. During the derivative of the indicator “NSI P” from the indicator “NSI E” the following method is used: Open Access IB 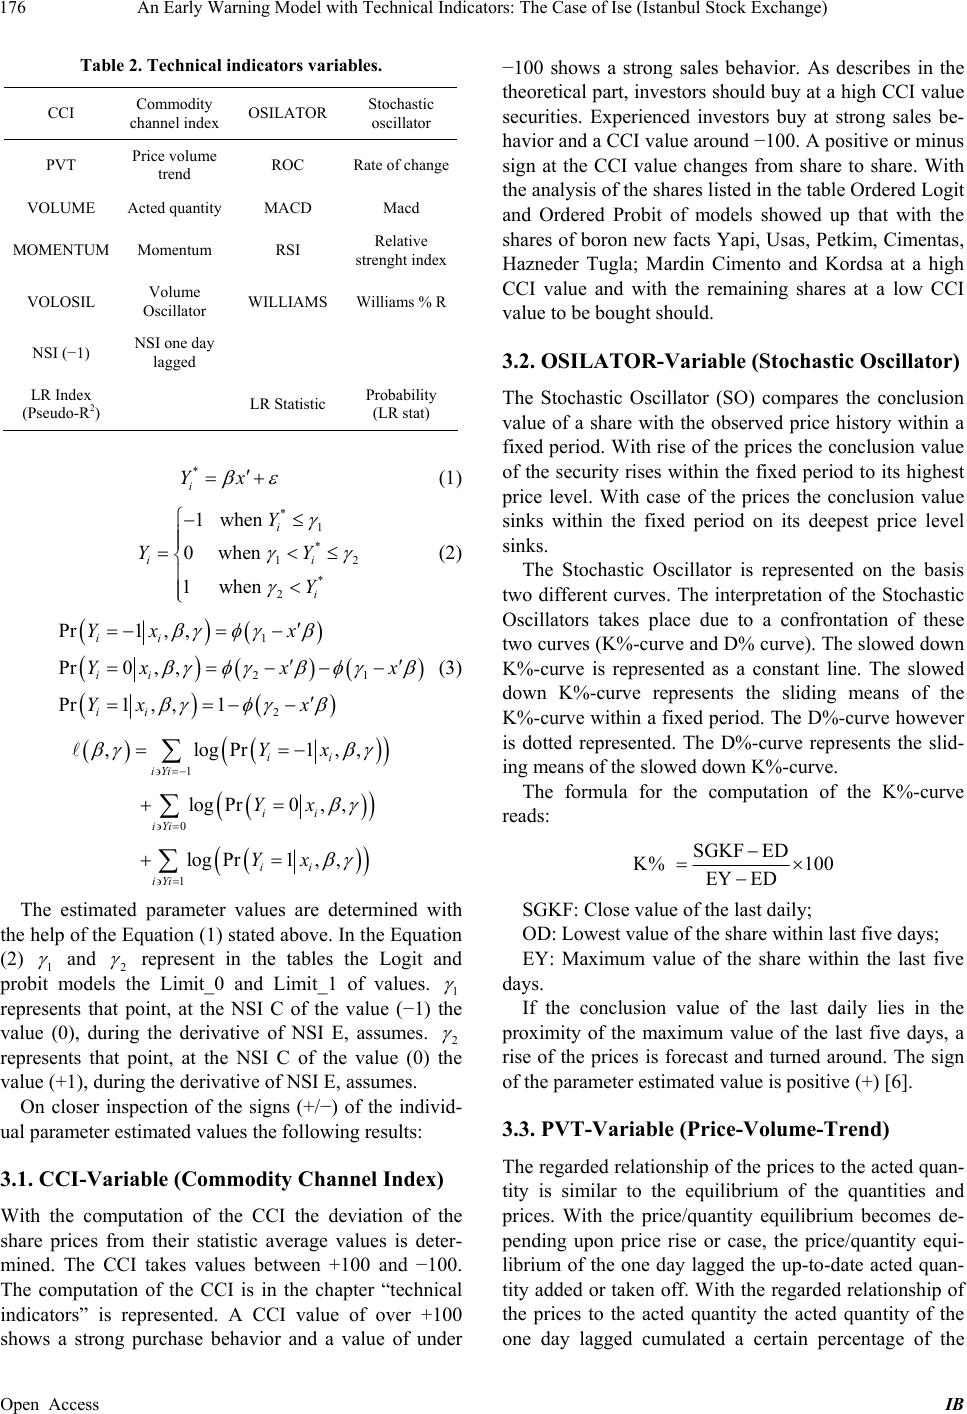 An Early Warning Model with Technical Indicators: The Case of Ise (Istanbul Stock Exchange) 176 Table 2. Technical indicators variables. CCI Commodity channel index OSILATOR Stochastic oscillator PVT Price volume trend ROC Rate of change VOLUME Acted quantity MACD Macd MOMENTUM Momentum RSI Relative strenght index VOLOSIL Volume Oscillator WILLIAMS Williams % R NSI (−1) NSI one day lagged LR Index (Pseudo-R2) LR Statistic Probability (LR stat) * i Yx (1) * 1 * 12 * 2 1when 0when 1when i i i Y Y Y i Y (2) 1 21 2 Pr1, , Pr0, , Pr1, ,1 ii ii ii Yx x Yxx x Yx x (3) 1 0 1 ,logPr1, log Pr0,, log Pr1,, ii iYi ii iYi ii iYi Yx Yx Yx , The estimated parameter values are determined with the help of the Equation (1) stated above. In the Equation (2) 1 and 2 represent in the tables the Logit and probit models the Limit_0 and Limit_1 of values. 1 represents that point, at the NSI C of the value (−1) the value (0), during the derivative of NSI E, assumes. 2 represents that point, at the NSI C of the value (0) the value (+1), during the derivative of NSI E, assumes. On closer inspection of the signs (+/−) of the individ- ual parameter estimated values the following results: 3.1. CCI-Variable (Commodity Channel Index) With the computation of the CCI the deviation of the share prices from their statistic average values is deter- mined. The CCI takes values between +100 and −100. The computation of the CCI is in the chapter “technical indicators” is represented. A CCI value of over +100 shows a strong purchase behavior and a value of under −100 shows a strong sales behavior. As describes in the theoretical part, investors should buy at a high CCI value securities. Experienced investors buy at strong sales be- havior and a CCI value around −100. A positive or minus sign at the CCI value changes from share to share. With the analysis of the shares listed in the table Ordered Logit and Ordered Probit of models showed up that with the shares of boron new facts Yapi, Usas, Petkim, Cimentas, Hazneder Tugla; Mardin Cimento and Kordsa at a high CCI value and with the remaining shares at a low CCI value to be bought should. 3.2. OSILATOR-Variable (Stochastic Oscillator) The Stochastic Oscillator (SO) compares the conclusion value of a share with the observed price history within a fixed period. With rise of the prices the conclusion value of the security rises within the fixed period to its highest price level. With case of the prices the conclusion value sinks within the fixed period on its deepest price level sinks. The Stochastic Oscillator is represented on the basis two different curves. The interpretation of the Stochastic Oscillators takes place due to a confrontation of these two curves (K%-curve and D% curve). The slowed down K%-curve is represented as a constant line. The slowed down K%-curve represents the sliding means of the K%-curve within a fixed period. The D%-curve however is dotted represented. The D%-curve represents the slid- ing means of the slowed down K%-curve. The formula for the computation of the K%-curve reads: SGKF ED K% 100 EY ED SGKF: Close value of the last daily; OD: Lowest value of the share within last five days; EY: Maximum value of the share within the last five days. If the conclusion value of the last daily lies in the proximity of the maximum value of the last five days, a rise of the prices is forecast and turned around. The sign of the parameter estimated value is positive (+) [6]. 3.3. PVT-Variable (Price-Volume-Trend) The regarded relationship of the prices to the acted quan- tity is similar to the equilibrium of the quantities and prices. With the price/quantity equilibrium becomes de- pending upon price rise or case, the price/quantity equi- librium of the one day lagged the up-to-date acted quan- tity added or taken off. With the regarded relationship of the prices to the acted quantity the acted quantity of the one day lagged cumulated a certain percentage of the Open Access IB  An Early Warning Model with Technical Indicators: The Case of Ise (Istanbul Stock Exchange) 177 up-to-date acted quantity is added or taken off. The per- centage is calculated as a function of the price rise or case. If the acted quantity rises with sinking prices, the PVT value sinks. In this situation the PVT variable shows a strong purchase behavior with low prices. Sinking prices and a sinking quantity are characteristics for one PVT value any longer not falling. From the negative connec- tion between acted quantity and rising prices can a minus sign of the parameter estimated value (−) be derived. 3.4. ROC (Price Rate of Change) The price adjustment rate (ROC) shows the percent change of the price of the current daily in the comparison to the price of the previous daily. The following formula shows the computation of the price adjustment rate: curentcloseclose fordays Price ROC100 close fordays If the prices reach a point, also the ROC value reaches a point. The sign of the parameter estimated value is negative (−). 3.5. VOLUME (Acted Quantity) The acted quantity represents the quantity of the bought and sold shares. The development of the acted quantity and the prices gives important notes to future events. With sinking prices are more buyers. By the rise of the inquired quantity, the prices rise. The sign of the pa- rameter estimated value is positive (+). The parameter estimated values of the VOLUME of indicator for the regarded shares are very small. The rea- son for it lies to the extent of the acted quantity. 3.6. MACD (Moving Average Convergence Divergence) With the help of the MACD trends can be illustrated. The MACD shows the relationship between two sliding av- erages, on whose basis purchase and sales decisions can be met. With the computation of the MACD first a long-term and a short term exponentially sliding means are calcu- lated. Subsequently, from the short term exponentially sliding means the long-term sliding means is taken off, in order to determine the MACD. If the short term expo- nentially sliding means is larger than the long-term ex- ponentially sliding means, the result is positive and the MACD lies over the zero-line. This indicates a rise of the prices. If however the result is negative, the MACD is under the zero-line. With the computation among other things the signal line is determined. This signal line results due to the val- ues of the exponentially sliding means of the last nine days. If the MACD cuts the signal line from down up, then a purchase decision is met. If however the MACD from above cuts down the signal line, then a sales deci- sion is met. A rising MACD value is characteristic for a rising price level. One can interpret a rising MACD value as sales signal. The sign is negative the parameter esti- mated value (−). 3.7. Momentum The Momentum indicates the percent change of the pric- es within a fixed period. With the help of the Momentum the profit or loss, which a share obtains within a certain period, can be represented. The price adjustment rate (ROC) shows a similar event as the Momentum, the dif- ference lies in the representational form. The datum line is with the Momentum with 100 and with the ROC with 0 and on the ordinate the percent change is represented. The Momentum is computed according to the formula stated down: Close value of the last daily Momentum 100 Close value beforedays Summarized the Momentum shows the yield of a share in the comparison to the price before “x” days is obtained. If the Momentum a maximum value moves reached and then downward, sales decisions are met. The sign of the parameter estimated value is negative (−). 3.8. RSI (Relative Strength Index) With the computation of this characteristic number be- comes with the help of the “sliding means of the price movements upward” (MAU Moving AVERAGE UP) and the “sliding means of the price movements down- ward” (WAD Moving AVERAGE down) the develop- ment of the prices determines. The relative Strength in- dex (RSI) curve takes a value between “0” and “100”. Following the determination of the MAU and WAD with the help of a formula of the RSI index is determined. A rising RSI value means a sinking price history in reverse and. The sign of the parameter estimated value is nega- tive (−) [6]. 3.9. VOLOSIL (Volume Oscillator) The volume Oscillator (VOLOSIL) is similar to the Sto- chastic Oscillator. It becomes instead of for the price, for which acted quantity computes. The VOLOSIL shows the difference between the means sliding at short notice and the means of a security quantity sliding on a long- Open Access IB  An Early Warning Model with Technical Indicators: The Case of Ise (Istanbul Stock Exchange) 178 term basis. Influence parameters on the VOLOSIL rep- resent the method of the computation of the sliding means, the Fristigkeit and the presentation method. The sign of the parameter estimated value is positive (+). 3.10. WILLIAMS (Williams’ % R) Williams % R represents a Momentum indicator, by which levels are represented with multi-purchases and increased sale. Williams % R is interpreted similarly as the Stochastic Oscillator. In contrast to the Stochastic Oscillator has Williams % R a turned sign. If Williams lies % R between 80% and 100%, then surplus sales find with the regarded security, at a value between 0% and 20% take place surplus purchases. The purchase and sales decision should be met only if the security price moves in the reverse direction. The MACD helps with the announcement of Share-pries change. A rising Wil- liams % R marks rising prices. The sign of the parameter estimated value is positive (+) [7]. 3.11. NSI (−1) “NSI (−1)” represents the material share price adjustment of the one day lagged. If it takes the value −1, it means that the value sank and the prices of the current daily can rise. If the “NSI (−1) is” value of the one day lagged 0 or +1, then it knows a sinking of the prices meant. The sign of the parameter estimated value is negative (−). In the Ordered Logit and Ordered Probit models be- came instead of the certainty measure of R2 of the LR index (pseudo R2) and instead of the f-Statistic the LR Statistic used. Details in addition are in the theoretical part of this work. The pseudo R2 took very low values. This is due to the calculation method of the pseudo R2. A comparison with classical R2-values would not be correct [8]. In the classical involution model the R2-value between 0 and 1 can move, whereby a value means close 1 a strong correlation. Dummy Dependent variable model does not supply value close 1. On the assumption that in a given interval the correct probabilities of an event are evenly distributed, it is to be set it possible for R2 an up- per border of. For this reason a low R2 is not unusual with the estimation of a linear probability model [9]. 4. Emprical Results Following the four ISE (Istanbul Stock Exchange) indi- ces are aforementioned the main sector indices (industry, service, financial and technology sector) and the perti- nent sub sectors. The main sector and sub sector indices cover securities, which are not acted at the stock exchange to note and at the national market. CODE INDICES XU100 ISE NATIONAL-100 XU050 ISE NATIONAL-50 XU030 ISE NATIONAL-30 XKURY ISE CORPORATE GOVERNMENT XUTUM ISE NATIONAL-ALL SHARES XUSIN ISE NATIONAL-INDUSTRIALS XGIDA FOOD, BEVERAGE XTEKS TEXTILE, LEATHER XKAGT WOOD, PAPER, PRINTING XKMYA CHEMICAL, PETROLEUM, PLASTIC XTAST NON-METAL MINERAL PRODUCTS XMANA BASIC METAL XMESY METAL PRODUCTS, MACHINERY XUHIZ ISE NATIONAL-SERVICES XELKT ELECTRICITY XULAS TRANSPORTATION XTRZM TOURISM XTCRT WHOLESALE AND RETAIL TRADE XILTM TELECOMMUNICATIONS XSPOR SPORTS XUMAL ISE NATIONAL - FINANCIALS XBANK BANKS XSGRT INSURANCE XFINK LEASING, FACTORING XHOLD HOLDING AND INVESTMENT XGMYO REAL ESTATE INVEST.TRUSTS XUTEK ISE NATIONAL TECHNOLOGY XBLSM INFORMATION TECHNOLOGY XSVNM DEFENSE XYORT ISE INVESTMENT TRUSTS XIKIU ISE SECOND NATIONAL XYEKO ISE NEW ECONOMY Following tables contain some of the significant pa- rameters of variables in ordered probit models (Tables 3 and 4) [10]. 4.1. Stability of the Parameter Estimated Values The stability of the estimated parameter values, in order Open Access IB  An Early Warning Model with Technical Indicators: The Case of Ise (Istanbul Stock Exchange) Open Access IB 179 Table 3. Some of the ordered probit outputs. ABANA ELEKTRO AK ENERJİ AKTAŞ ELEKTRİK AYEN ENERJİ SAMPLE REGRESSION OUTPUTS Std.Dev Prob. Std.DevProb. Std. DevProb. Std. DevProb. N 2116 88 1585 90 CCI (−1) OSILATOR (−1) 0.01 0.00 0.00 0.04 0.02 0.01 PVT (−1) ROC (−1) −9.34 0.48 0.00 −10.23 2.47 0.00−4.29 0.42 0.00 −21.53 4.50 0.00 VOLUME (−1) 0.00 0.00 0.04 0.00 0.00 0.00 MACD (−1) 0.00 0.00 0.00 MOMENTUM (−1) −0.27 0.15 0.08 RSI (−1) 0.54 0.25 0.03 VOLOSIL (−1) WILLIAMS (−1) 0.01 0.00 0.00 0.01 0.00 0.010.01 0.00 0.00 0.01 0.00 0.01 ISARET (−1) −0.07 0.03 0.04 −0.30 0.17 0.08−0.07 0.04 0.06 −0.48 0.20 0.02 LIMIT_0 −0.38 0.04 0.00 −0.29 0.17 0.09−0.73 0.18 0.00 80.38 36.72 0.03 LIMIT_1 0.01 0.04 0.74 0.29 0.17 0.09−0.33 0.18 0.06 81.04 36.74 0.03 LR index (Pseudo−R2) 0.27 0.24 0.20 0.47 LR statistic 1134.48 42.00 648.45 79.33 Probability (LR stat) 0.00 0.00 0.00 0.00 HAUPT SEKTOR XUHIZ XUHIZ XUHIZ XUHIZ UNTER SEKTOR XELKT XELKT XELKT XELKT Table 4. Summary of models. Number of Efficient Estimations % of Total CCI (−1) 33 13.2 OSILATOR (−1) 108 43.2 PVT (−1) 58 23.2 ROC (−1) 250 100 VOLUME (−1) 214 85.6 MACD (−1) 75 30 MOMENTUM (−1) 27 10.8 RSI (−1) 16 6.4 VOLOSIL (−1) 49 19.6 WILLIAMS (−1) 247 98.8 ISARET (−1) 247 98.8 N (Mean) 1642 LR index (Pseudo-R2) (Average) 0.24 to be able to make prognoses over the share price change, tested in the context of this work. For this from 250 shares altogether 32 shares were selected. To the criteria for choice the number of collections and the affiliation to at least a sub sector belonged. Shares with the highest collections from each sub sector each are selected. The accomplished stability test results are in the following: With the examination of the stability of the parameter values of the selected shares at the beginning of a third of the oldest collections of the parameter computation one takes out. In a second passage finally only more half of the collections was located—which recent collections— for the order, with which a further parameter computa- tion is accomplished. After Chow a third of the collec- tions and afterwards half of the collections are taken out last of the center of the entire elevations. Those only with the oldest and recent collections the parameter values are computed. The estimated parameter values with the full collection number are compared after that far method with the estimated parameter values, represented down, with smaller collections and their stability is tested.  An Early Warning Model with Technical Indicators: The Case of Ise (Istanbul Stock Exchange) 180 00 10 ˆ ˆ H H A t-test was accomplished: 0 stat ˆ ˆ tS By the fulfillment of the condition tstat < ttable the H0 hypothesis is not rejected and the stability of the esti- mated parameter values of the regarded 32 shares was confirmed. The estimated parameter values and stability test de- termined for the selected 32 shares are in the appendix. The results displays that the change of the number of collections do not cause statistic change of the estimated parameter values. 5. Conclusions In summary, we can say that during the derivative of NSI E: NSI C takes the value (−1) assumes that it is smaller as it is; NSI C takes the value (0) if it lies between; NSI C takes the value (+1) if it is larger as it is. For all technical indicators with the computation of the variables one day lagged, values are used. The conclu- sion values of 250 shares are raised for the calculations of the technical indicators. The technical indicators as the argument were used for the determination of the parame- ter values, and thereby altogether 250 models are set up. It participated interesting that the estimated parameter values of the 250 shares were close. The CCI variable for 33 models, the OSILATOR variable for 108 models, the PVT variable for 58 models, the ROC variable for all models, the volume variable for 214 models, the MACD variable for 75 models, the moment around variable for 27 models, the RSI variable for 16 models, the volume OS IL variable for 49 models, the WILLIAMS variable for 247 models and the NSI (−1) variable for 247 models are efficient. With those models, in which the technical indicators represent the arguments, Turkcell, Anadolu Efes and Ayen Enerji had extreme parameter values. Since the number of collections is very small with these shares, one can meet the acceptance that iterated parameter val- ues are not reached. 5.1. Model Prognoses With above the 32 shares select for the stability test of the estimated parameter values, prognoses become for one period of three months (10 October to 24 January 2007) accomplished. With these prognoses, the “NSI R” (NSI calculated) of values is determined and derived from these the “NSI E” (NSI estimated). The derived “NSI E” of values is compared afterwards with the “NSI R” (NSI real) values. Point prognoses and interval prognoses are accom- plished. In the context of the point prognosis, the values of “NSI C” were determined with the Limit_0 and Limit_1 being compared and “NSI E” derives from it. “NSI C” was under Limit_0 to “NSI P” on (−1) and was then specified. With the “NSI C” between Limit_0 and Limit_1, “NSI E” is specified on (0) with a “NSI C” over Limit_1 on (+1). After derivative of “NSI E”, it is com- pared with “NSI R” and prognosis accuracy is deter- mined. In the case of the point, prognoses resulted is prognosis accuracy between 54 to 72 percent. For the execution of the interval prognoses, addition- ally the “NSI still becomes CU” value (NSI calculated lower one limit) and “the NSI CO” value (NSI calculated upper one border) is determined. With the help of these two limit values, during the derivative of the “NSI E”, the “NSI of EU” values (NSI prognosticated lower ones limit) and “NSI of EO” values (NSI prognosticated upper one border) are derived. It was checked whether the “NSI R”-value is within these two values (between “NSI EU” and “NSI PO”). With the regarded 32 models (ever a model per share), “NSI R” is observed within these in- terval values with a frequency from 70 to 96 percent. The intervals (“NSI EU” and “NSI EO”) failed some- times very closely and again very broadly. With very close intervals (ex.: “NSI EU” = +1 and “NSI EO” = +1). “NSI E” can speak with the interval borders of safe prog- noses with the agreement of the point prognosis. On the other side the interval borders far apart (“NSI EU” = −1 and “NSI EO” = +1) cannot be made safe statements about the point prognosis “NSI E”. The reason for the far interval borders lies in the high standard deviation and the Limit_0 and Limit_1 values, for which again as in- fluence of external factors is lying far apart, speculation behavior is responsible. With the regarded 32 shares, one could observe the in- terval width of “NSI EU” within the observed period of 3 months = −1 to “NSI EO” = +1 between 9 percent and 83 percent, an average value of 57.4 percent for 32 shares results. “NSI EU” = +1 to “NSI EO” = +1 was observed with the 32 shares within the period by 3 months with a frequency from 5.5 to 62.5 percent, and resulted in an average value of 20.1 percent. When agreeing the “NSI E”, “NSI EU” and “NSI EO” value an agreement with “NSI R” which is determined between 61 and 100 per- cent, i.e. with an average value of 89 percent. In principle, one can say that with all securities with 18 (= 0.201 * 0.89) percent of probability safe prognoses can be accomplished. In summary, we can say that one with 63 percent of correct point prognoses altogether with approx. 57 percent of all prognoses about no safe pro- gnoses to talk can lie apart, and there the interval borders far and with approx. 18 percent about safe prognoses to tal can lie apart. 25 percent of the remaining can be k Open Access IB  An Early Warning Model with Technical Indicators: The Case of Ise (Istanbul Stock Exchange) Open Access IB 181 Table 5. Point and interval prognoses. Stock NSI E Correct Interval Estimation Correct NSI E = NSI EU = NSI EO NSI E = NSI EU = NSI EO Correct NSI PU = −1 NSI PO = +1 NSI P Betwixt İŞ BANKASI (C) Amount43 67 13 11 43 in % 60.56 94.37 18.31 84.62 60.56 YAPI VE KREDİ BANK. Amount46 67 17 15 35 in % 64.79 94.37 23.94 88.24 49.30 İKTİSAT FİN. KİR. Amount42 66 16 14 37 in % 59.15 92.96 22.54 87.50 52.11 VAKIF GMYO Amount39 64 8 6 48 in % 57.35 94.12 11.76 75.00 70.59 ALARKO HOLDİNG Amount43 66 18 16 37 in % 60.56 92.96 25.35 88.89 52.11 ENKA HOLDİNG Amount56 76 12 11 53 in % 72.73 98.70 15.58 91.67 68.83 KOÇ HOLDİNG Amount41 69 17 14 38 in % 56.94 95.83 23.61 82.35 52.78 ANADOLU SİGORTA Amount39 51 45 37 7 in % 54.17 70.83 62.50 82.22 9.72 ANADOLU GIDA Amount45 67 13 8 39 in % 65.22 97.10 18.84 61.54 56.52 MARET Amount47 71 17 16 34 in % 65.28 98.61 23.61 94.12 47.22 PINAR SU Amount50 71 5 4 60 in % 69.44 98.61 6.94 80.00 83.33 AYGAZ Amount45 70 11 10 38 in % 62.50 97.22 15.28 90.91 52.78 BRİSA Amount44 66 22 18 36 in % 62.86 94.29 31.43 81.82 51.43 ECZACIBAŞI İLAÇ Amount49 71 15 15 56 in % 69.01 100.00 21.13 100.00 78.87 PETKİM Amount44 70 14 14 43 in % 61.11 97.22 19.44 100.00 59.72 ÇELİK HALAT Amount46 72 8 8 49 in % 63.89 100.00 11.11 100.00 68.06 EREĞLİ DEMİR CELİK Amount52 70 13 12 42 in % 72.22 97.22 18.06 92.31 58.33 SARKUYSAN Amount51 68 12 12 37 in % 70.83 94.44 16.67 100.00 51.39 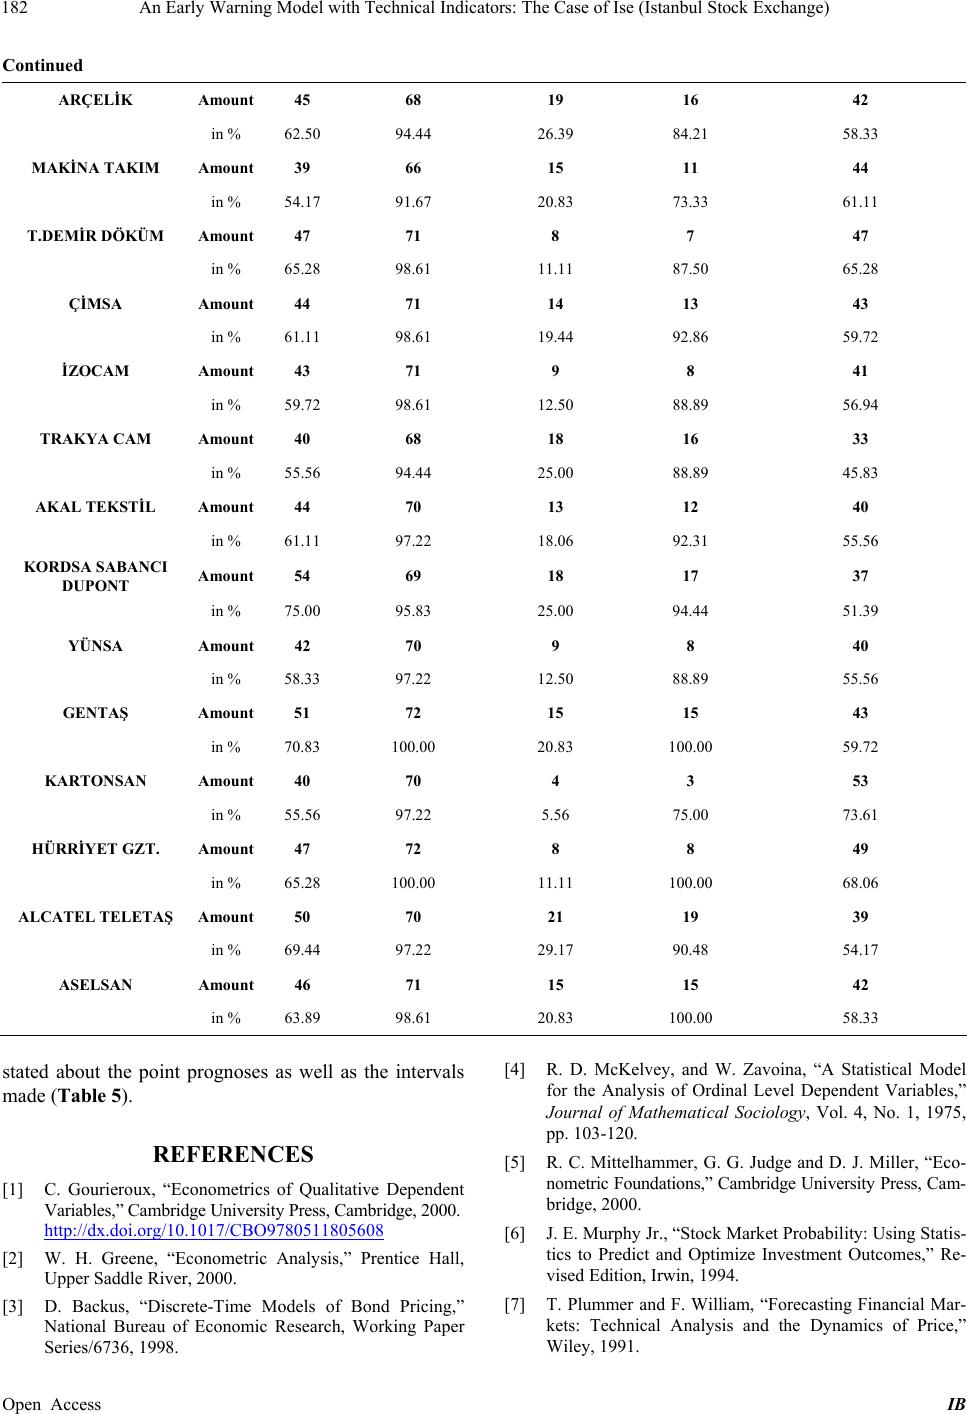 An Early Warning Model with Technical Indicators: The Case of Ise (Istanbul Stock Exchange) 182 Continued ARÇELİK Amount45 68 19 16 42 in % 62.50 94.44 26.39 84.21 58.33 MAKİNA TAKIM Amount39 66 15 11 44 in % 54.17 91.67 20.83 73.33 61.11 T.DEMİR DÖKÜM Amount47 71 8 7 47 in % 65.28 98.61 11.11 87.50 65.28 ÇİMSA Amount44 71 14 13 43 in % 61.11 98.61 19.44 92.86 59.72 İZOCAM Amount43 71 9 8 41 in % 59.72 98.61 12.50 88.89 56.94 TRAKYA CAM Amount40 68 18 16 33 in % 55.56 94.44 25.00 88.89 45.83 AKAL TEKSTİL Amount44 70 13 12 40 in % 61.11 97.22 18.06 92.31 55.56 KORDSA SABANCI DUPONT Amount54 69 18 17 37 in % 75.00 95.83 25.00 94.44 51.39 YÜNSA Amount42 70 9 8 40 in % 58.33 97.22 12.50 88.89 55.56 GENTAŞ Amount51 72 15 15 43 in % 70.83 100.00 20.83 100.00 59.72 KARTONSAN Amount40 70 4 3 53 in % 55.56 97.22 5.56 75.00 73.61 HÜRRİYET GZT. Amount47 72 8 8 49 in % 65.28 100.00 11.11 100.00 68.06 ALCATEL TELETAŞ Amount50 70 21 19 39 in % 69.44 97.22 29.17 90.48 54.17 ASELSAN Amount46 71 15 15 42 in % 63.89 98.61 20.83 100.00 58.33 stated about the point prognoses as well as the intervals made (Table 5). REFERENCES [1] C. Gourieroux, “Econometrics of Qualitative Dependent Variables,” Cambridge University Press, Cambridge, 2000. http://dx.doi.org/10.1017/CBO9780511805608 [2] W. H. Greene, “Econometric Analysis,” Prentice Hall, Upper Saddle River, 2000. [3] D. Backus, “Discrete-Time Models of Bond Pricing,” National Bureau of Economic Research, Working Paper Series/6736, 1998. [4] R. D. McKelvey, and W. Zavoina, “A Statistical Model for the Analysis of Ordinal Level Dependent Variables,” Journal of Mathematical Sociology, Vol. 4, No. 1, 1975, pp. 103-120. [5] R. C. Mittelhammer, G. G. Judge and D. J. Miller, “Eco- nometric Foundations,” Cambridge University Press, Cam- bridge, 2000. [6] J. E. Murphy Jr., “Stock Market Probability: Using Statis- tics to Predict and Optimize Investment Outcomes,” Re- vised Edition, Irwin, 1994. [7] T. Plummer and F. William, “Forecasting Financial Mar- kets: Technical Analysis and the Dynamics of Price,” Wiley, 1991. Open Access IB  An Early Warning Model with Technical Indicators: The Case of Ise (Istanbul Stock Exchange) 183 [8] T. Laitila, “A Pseudo-R2 Measure for Limited and Quali- tative Dependent Variable Models,” Journal of Econo- metrics, Vol. 56, No. 3, 1993, pp. 341-345. [9] R. S. Pindyck and D. L. Rubinfeld, “Econometric Models and Economic Forecasts,” McGraw-Hill, 1998. [10] IMKB, 2001. http://www.imkb.gov.tr/endeksler.htm Open Access IB |