

Paper Menu >>
Journal Menu >>
 American Journal of Plant Sciences, 2013, 4, 122-130 Published Online December 2013 (http://www.scirp.org/journal/ajps) http://dx.doi.org/10.4236/ajps.2013.4.12A3015 Open Access AJPS Yield and Yield Components of Bread Wheat as Influenced by Water Stress, Sowing Date and Cultivar in Sokoto, Sudan Savannah, Nigeria Mohammed Bello Sokoto1*, Agit Singh2 1Department of Crop Science, Faculty of Agriculture, Usmanu Danfodiyo University, Sokoto, Nigeria; 2School of Biosciences, Fac- ulty of Science, The University of Nottingham, Malaysia Campus, Jalan Broga, Semenyih, Selangor, Malaysia. Email: *[email protected] Received October 7th, 2013; revised November 26th, 2013; accepted December 16th, 2013 Copyright © 2013 Mohammed Bello Sokoto, Agit Singh. This is an open access article distributed under the Creative Commons Attribu- tion License, which permits unrestricted use, distribution, and reproduction in any medium, provided the original work is properly cited. ABSTRACT Field experiments were conducted during 2009/10 and 2010/2011 dry seasons at the Fadama Teaching and Research Farm of the Usmanu Danfodiyo University, Sokoto, in the Sudan Savanna ecological zone of Nigeria (latitude 13˚01'N; longitude 5˚15'E, altitude of 350 m above sea level) to study the effect of water stress, sowing date and cultivar on yield and yield components of wheat (Triticum aestivum L.). The treatments consisted of factorial combination of water stress at three critical growth stages which was imposed by withholding water at tillering, flowering, grain filling and control (no stress), four sowing dates (21st November, 5th December, 19th December and 2nd January) and two bread wheat cul- tivar (Star 11 TR 77173/SLM and Kuaz/Weaver), laid out in a split-plot design with three replications. Water stress and date of sowing were assigned to the main-plot, while variety was assigned to the sub-plots. Result revealed that water stress at tillering significantly reduced spike length and grains per spike. Whereas, water stress at flowering and grain filling significantly reduced 1000-grain weight, grain yield and harvest index. Results also indicated significant (P < 0.05) effect of sowing date on length of spike, spikelets per spike, grains per spike and grain yield. Early sown wheat significantly differed from the late sown wheat in all parameters measured. Yield and yield components decreased with delay in sowing date and it was highest at 21st November and 5th December and lowest at 19th December and 2nd Janu- ary, therefore wheat should be sown in November or at least first week of December in this area and other area with similar climate. Variety had significant effect on spike per m−2, grain yield and harvest index. Water stress at flowering and grain filling should be avoided as they are the most critical growth stages in yield determination in wheat, because plants cannot recover, while delay in sowing resulted in reduction in yield and yield components. Star II TR 77173/SLM is therefore recommended for the area. Keywords: Yield; Yield Components; Bread Wheat; Water Stress; Sowing Date Cultivar; Sudan Savanna 1. Introduction Wheat (Triticum aestivum L.) belongs to the tribe Triti- ceae which is one of the largest and most important tribes in the Poaceae family [1]. It is grown on 200 million hectares with an average total production of 600 million metric tons. Global average yield is around 2.7 t·ha−1 with high variability among countries and regions. The highest average yields are obtained in Western Europe, with more than 8 t·ha−1, in contrast to less than 1 t·ha−1 in countries in Central/West Asia and North Africa [2]. Ni- gerian production currently stands at 100,000 tonnes from 95,000 hectares with an average yield of 1.05 t·ha−1 [3]; this is far below that of Germany (7.9 tons·ha−1), France (6.6 tons·ha−1) and Egypt (6.4 tons·ha−1) [4]. Wheat contributes about 60% of daily protein require- ment and more calories to world diet than any other food crop [5]. Nigeria is currently the second largest export destina- tion for USA wheat [3,6] reported that food security in the world is challenged by increasing food demand and threatened by declining water availability. Wheat pro- duction has been shown to be limited by a number of factors such as moisture stress [7,8], variety and weed [9]; soil fertility and date of sowing [8,10] observed that con- *Corresponding author.  Yield and Yield Components of Bread Wheat as Influenced by Water Stress, Sowing Date and Cultivar in Sokoto, Sudan Savannah, Nigeria 123 tinual heat stress affects approximately 7 million hectares of wheat in developing countries, whereas terminal heat stress is a problem in 40% of the temperate environments that encompass 36 million hectares. Wheat is an important cereal crop and serves as a sta- ple food in many countries of the world [7]. With human population expected to reach 8.3 billion by 2025, coupled with continuous deterioration and losses of agricultural lands, it has become imperative to have crop varieties of higher yielding and good quality and this ought to be achieved to feed the billions of human population. [8,11] observed that supply of irrigation water at different stag- es of plant growth plays a vital roles in boosting yield per unit area; the authors further observed that optimum sowing date plays an important role on yield of wheat. Currently, some newly developed wheat varieties have been introduced into the country from CIMMYT, Mex- ico. These varieties need to be evaluated for their re- sponse to local conditions, particularly heat tolerance [12]. This is important in the Sudan savanna where high temperatures at the end of the dry season which coincides with grain filling stage of wheat are common features and impediment to good wheat crop performance. [13] observed that higher productivity of wheat in USA was due to more favorable environmental condition which includes temperature and moisture. The objectives of the study are to determine the effect of water stress at critical growth stages on the productiv- ity of two wheat varieties, so that farmers could save irrigation (which is expensive) with the knowledge of critical growth stages, determine the effect of sowing date on yield and yield components of two wheat culti- vars to enable the farmers to know the optimum sowing date for the newly introduced cultivars and determine the most suitable wheat cultivar for farmers in Sokoto and other areas with similar conditions. 2. Materials and Methods The trials were conducted during the 2009/2010 and 2010/2011 dry seasons at the Fadama Teaching and Re- search Farm, Usmanu Danfodiyo University, Sokoto, (Latitude 13˚01'N. longitude 15˚13'E) at Kwalkwalawa village in Sokoto. The farm is located within the Sudan Savanna Zone of Nigeria [14]. The area has a long dry season that is characterized by cool dry air during har- mattan from November to February and hot dry air dur- ing hot season from March to May [15]. The soil is hy- dromorphic that is seasonally flooded during rainy sea- son. The area was previously used for the cultivation of vegetables and cereals crops. Prior to sowing, soil sam- ples were collected from nine randomly selected points within the experimental site at 0 - 30 cm depth using soil auger. The samples were bulked to form a composite sample and sub-samples about 200 g were collected us- ing coning and quatering method. The samples were air- dried, grounded, sieved and analyzed for physical and chemical properties. The treatments consisted of factorial combinations of water stress at three critical growth stages which was imposed by withholding water at tillering, flowering, grain filling and control (no stress), four sowing dates (21st November, 5th December, 19th December and 2nd January) and two heat tolerant wheat varieties (Star 11 TR 77173/SLM and Kuaz/Weaver), laid out in a split plot design with three replications. Water stress and date of sowing were assigned to the main-plot, while variety was assigned to sub-plots. The land was cleared, ploughed, harrowed, leveled, which was followed by construction of basins and water channels. Gross plot size was 3 m × 3 m (9 m2) while the net plot was (4.5 m2). One meter (1 m) lee-way was left between blocks and 0.5 m between plots. The seeds were treated with Apron star 42 WS (20% w/w thiamethoxam, 20% w/w metalaxyl-M and 2% w/w difenoconazole) at the rate of 10 g per 4 kg of seed before sowing. The seeds were sown by hand drilling at 20 cm intra-row spacing at 2 - 3 cm depth and at the rate of 120 kg·ha−1. The date of sowing was as prescribed by the treatments. The method of irrigation used was check basin irrigation; water was applied to soil saturation at 5 days interval. Weeds were controlled manually with hoe at 3 and 6 WAS to ensure weed free plots. Fertilizer was broadcasted at the rec- ommended rate of 120, 60 and 60 kg N, P2O5 and K2O per ha−1, respectively. Half of nitrogen and full dose of phosphorous and potassium was worked in to the soil during seedbed preparation using NPK 15:15:15: while, the second dose of 60 kg N ha−1 was applied prior to til- lering using urea (46% N) as source of nitrogen. Birds were controlled by scaring while rodents were controlled by using baits and traps. No disease out break was recorded. The crop was manually harvested from the net plot at physiological maturity using sickles when 50% of the peduncles had turned brown. The plants were cut at ground level and sun dried for a period of 4 days. The spikes were beaten out with sticks to expose the grain, which was winnowed in open air with the help of wind current. Data was collected on length of spike, number of spikelets per spike, number of grains per spike and grain yield. The data collected were subjected to analysis of vari- ance (ANOVA) using SAS [16] computer package. Duncan’s New Multiple Range Test (DNMRT) was used for means separation. 3. Results and Discussion 3.1. Physical and Chemical Properties of the Experimental Site The soil of the experimental area was sandy loam using Open Access AJPS 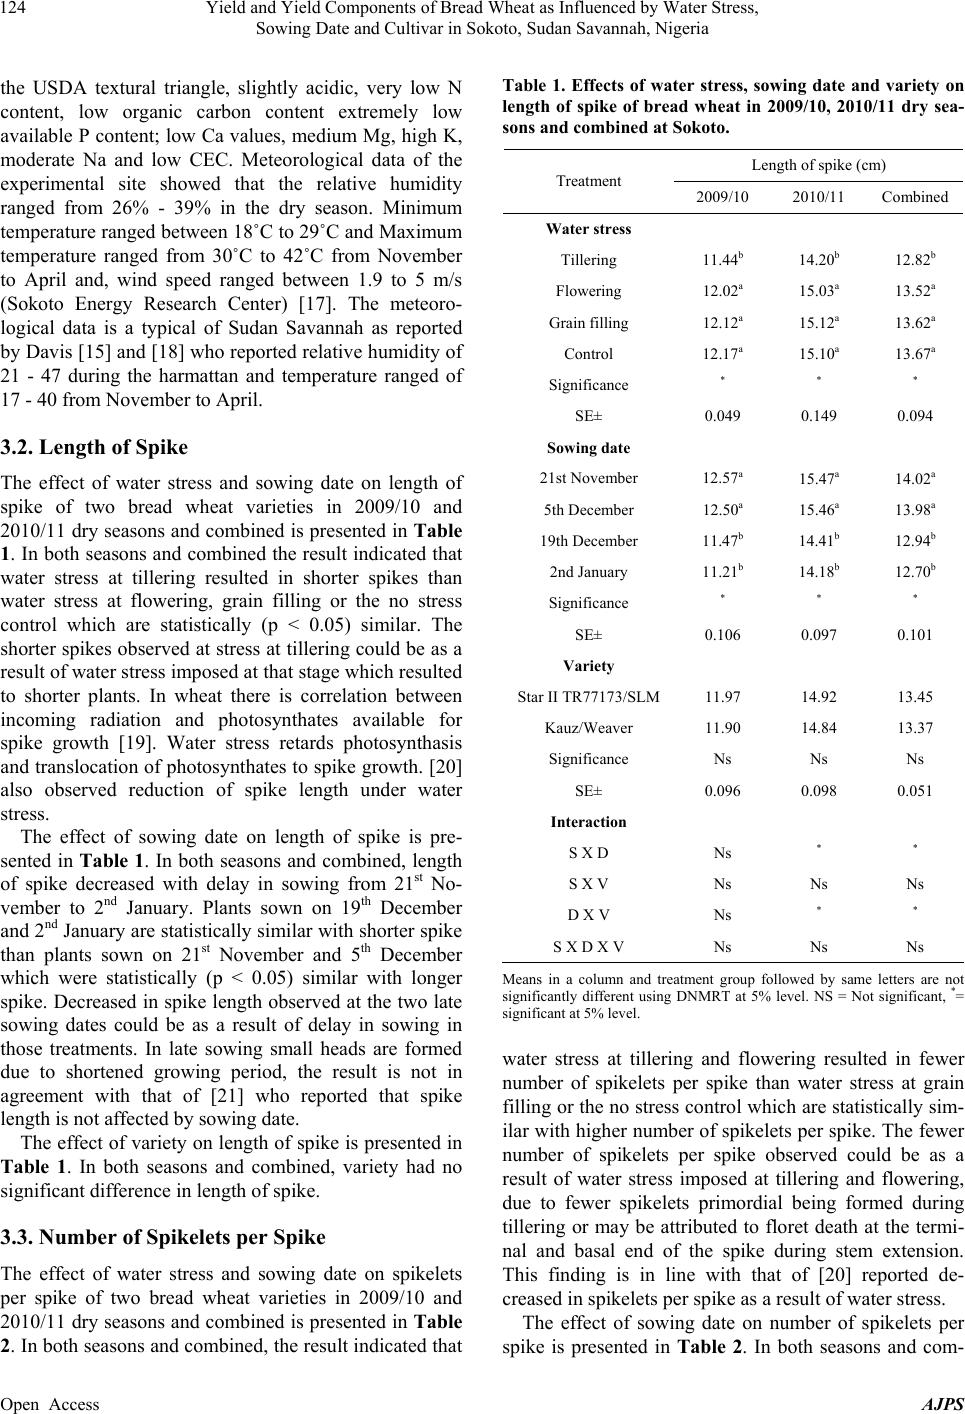 Yield and Yield Components of Bread Wheat as Influenced by Water Stress, Sowing Date and Cultivar in Sokoto, Sudan Savannah, Nigeria 124 the USDA textural triangle, slightly acidic, very low N content, low organic carbon content extremely low available P content; low Ca values, medium Mg, high K, moderate Na and low CEC. Meteorological data of the experimental site showed that the relative humidity ranged from 26% - 39% in the dry season. Minimum temperature ranged between 18˚C to 29˚C and Maximum temperature ranged from 30˚C to 42˚C from November to April and, wind speed ranged between 1.9 to 5 m/s (Sokoto Energy Research Center) [17]. The meteoro- logical data is a typical of Sudan Savannah as reported by Davis [15] and [18] who reported relative humidity of 21 - 47 during the harmattan and temperature ranged of 17 - 40 from November to April. 3.2. Length of Spike The effect of water stress and sowing date on length of spike of two bread wheat varieties in 2009/10 and 2010/11 dry seasons and combined is presented in Tab le 1. In both seasons and combined the result indicated that water stress at tillering resulted in shorter spikes than water stress at flowering, grain filling or the no stress control which are statistically (p < 0.05) similar. The shorter spikes observed at stress at tillering could be as a result of water stress imposed at that stage which resulted to shorter plants. In wheat there is correlation between incoming radiation and photosynthates available for spike growth [19]. Water stress retards photosynthasis and translocation of photosynthates to spike growth. [20] also observed reduction of spike length under water stress. The effect of sowing date on length of spike is pre- sented in Table 1. In both seasons and combined, length of spike decreased with delay in sowing from 21st No- vember to 2nd January. Plants sown on 19th December and 2nd January are statistically similar with shorter spike than plants sown on 21st November and 5th December which were statistically (p < 0.05) similar with longer spike. Decreased in spike length observed at the two late sowing dates could be as a result of delay in sowing in those treatments. In late sowing small heads are formed due to shortened growing period, the result is not in agreement with that of [21] who reported that spike length is not affected by sowing date. The effect of variety on length of spike is presented in Table 1. In both seasons and combined, variety had no significant difference in length of spike. 3.3. Number of Spikelets per Spike The effect of water stress and sowing date on spikelets per spike of two bread wheat varieties in 2009/10 and 2010/11 dry seasons and combined is presented in Tab le 2. In both seasons and combined, the result indicated that Table 1. Effects of water stress, sowing date and variety on length of spike of bread wheat in 2009/10, 2010/11 dry sea- sons and combined at Sokoto. Length of spike (cm) Treatment 2009/10 2010/11 Combined Water stress Tillering 11.44b 14.20b 12.82b Flowering 12.02a 15.03a 13.52a Grain filling 12.12a 15.12a 13.62a Control 12.17a 15.10a 13.67a Significance * * * SE± 0.049 0.149 0.094 Sowing date 21st November 12.57a 15.47a 14.02a 5th December 12.50a 15.46a 13.98a 19th December 11.47b 14.41b 12.94b 2nd January 11.21b 14.18b 12.70b Significance * * * SE± 0.106 0.097 0.101 Variety Star II TR77173/SLM11.97 14.92 13.45 Kauz/Weaver 11.90 14.84 13.37 Significance Ns Ns Ns SE± 0.096 0.098 0.051 Interaction S X D Ns * * S X V Ns Ns Ns D X V Ns * * S X D X V Ns Ns Ns Means in a column and treatment group followed by same letters are not significantly different using DNMRT at 5% level. NS = Not significant, *= significant at 5% level. water stress at tillering and flowering resulted in fewer number of spikelets per spike than water stress at grain filling or the no stress control which are statistically sim- ilar with higher number of spikelets per spike. The fewer number of spikelets per spike observed could be as a result of water stress imposed at tillering and flowering, due to fewer spikelets primordial being formed during tillering or may be attributed to floret death at the termi- nal and basal end of the spike during stem extension. This finding is in line with that of [20] reported de- creased in spikelets per spike as a result of water stress. The effect of sowing date on number of spikelets per spike is presented in Tab le 2. In both seasons and com- Open Access AJPS 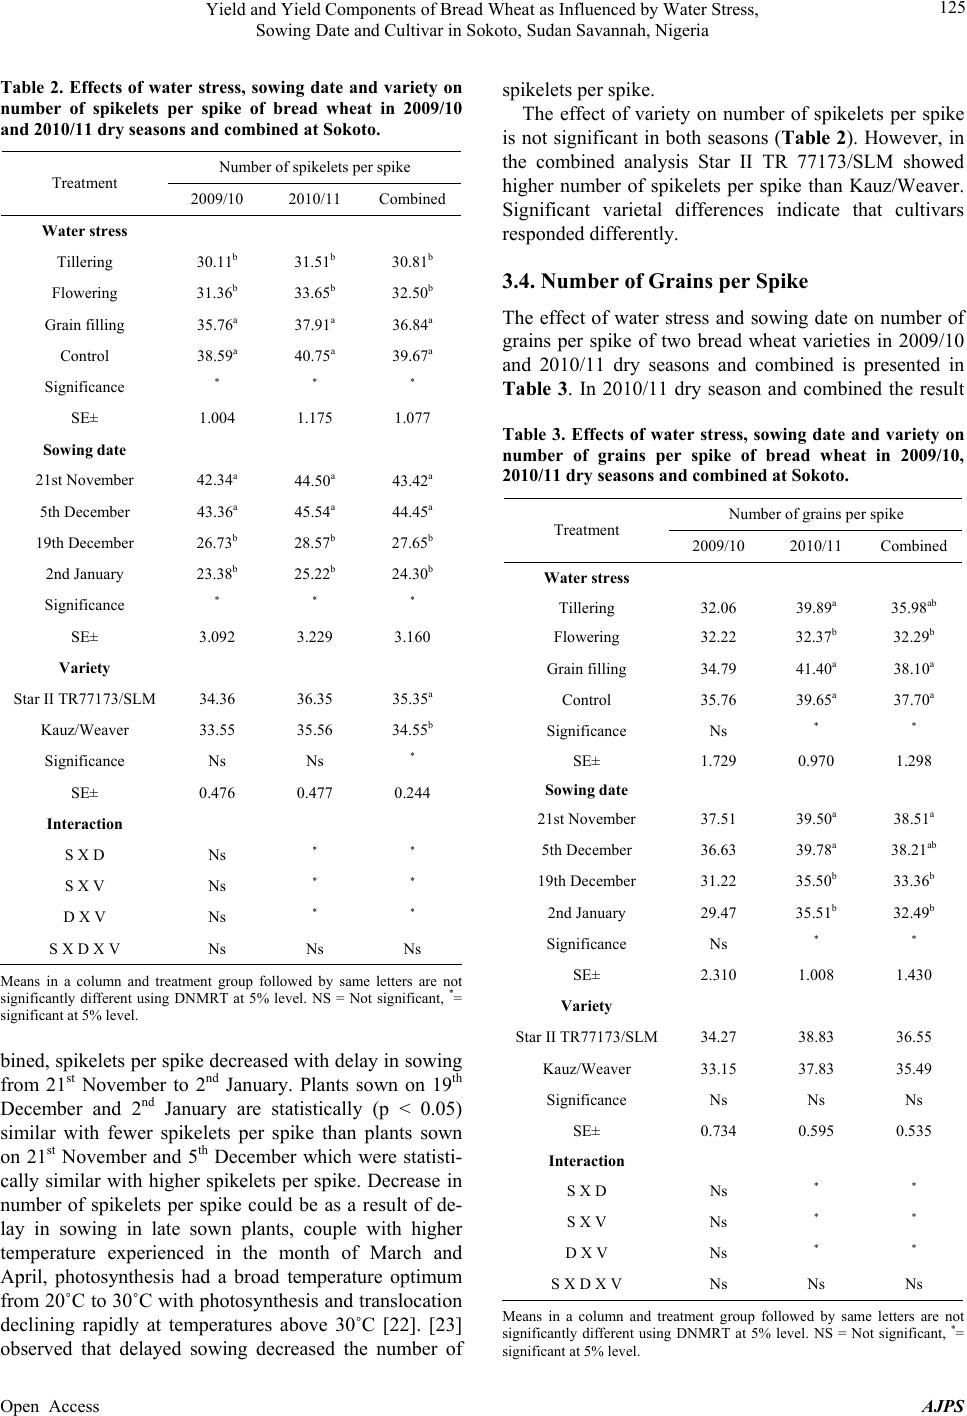 Yield and Yield Components of Bread Wheat as Influenced by Water Stress, Sowing Date and Cultivar in Sokoto, Sudan Savannah, Nigeria 125 Table 2. Effects of water stress, sowing date and variety on number of spikelets per spike of bread wheat in 2009/10 and 2010/11 dry seasons and combined at Sokoto. Number of spikelets per spike Treatment 2009/10 2010/11 Combined Water stress Tillering 30.11b 31.51b 30.81b Flowering 31.36b 33.65b 32.50b Grain filling 35.76a 37.91a 36.84a Control 38.59a 40.75a 39.67a Significance * * * SE± 1.004 1.175 1.077 Sowing date 21st November 42.34a 44.50a 43.42a 5th December 43.36a 45.54a 44.45a 19th December 26.73b 28.57b 27.65b 2nd January 23.38b 25.22b 24.30b Significance * * * SE± 3.092 3.229 3.160 Variety Star II TR77173/SLM 34.36 36.35 35.35a Kauz/Weaver 33.55 35.56 34.55b Significance Ns Ns * SE± 0.476 0.477 0.244 Interaction S X D Ns * * S X V Ns * * D X V Ns * * S X D X V Ns Ns Ns Means in a column and treatment group followed by same letters are not significantly different using DNMRT at 5% level. NS = Not significant, *= significant at 5% level. bined, spikelets per spike decreased with delay in sowing from 21st November to 2nd January. Plants sown on 19th December and 2nd January are statistically (p < 0.05) similar with fewer spikelets per spike than plants sown on 21st November and 5th December which were statisti- cally similar with higher spikelets per spike. Decrease in number of spikelets per spike could be as a result of de- lay in sowing in late sown plants, couple with higher temperature experienced in the month of March and April, photosynthesis had a broad temperature optimum from 20˚C to 30˚C with photosynthesis and translocation declining rapidly at temperatures above 30˚C [22]. [23] observed that delayed sowing decreased the number of spikelets per spike. The effect of variety on number of spikelets per spike is not significant in both seasons (Table 2). However, in the combined analysis Star II TR 77173/SLM showed higher number of spikelets per spike than Kauz/Weaver. Significant varietal differences indicate that cultivars responded differently. 3.4. Number of Grains per Spike The effect of water stress and sowing date on number of grains per spike of two bread wheat varieties in 2009/10 and 2010/11 dry seasons and combined is presented in Table 3. In 2010/11 dry season and combined the result Table 3. Effects of water stress, sowing date and variety on number of grains per spike of bread wheat in 2009/10, 2010/11 dry seasons and combined at Sokoto. Number of grains per spike Treatment 2009/10 2010/11 Combined Water stress Tillering 32.06 39.89a 35.98ab Flowering 32.22 32.37b 32.29b Grain filling 34.79 41.40a 38.10a Control 35.76 39.65a 37.70a Significance Ns * * SE± 1.729 0.970 1.298 Sowing date 21st November 37.51 39.50a 38.51a 5th December 36.63 39.78a 38.21ab 19th December 31.22 35.50b 33.36b 2nd January 29.47 35.51b 32.49b Significance Ns * * SE± 2.310 1.008 1.430 Variety Star II TR77173/SLM34.27 38.83 36.55 Kauz/Weaver 33.15 37.83 35.49 Significance Ns Ns Ns SE± 0.734 0.595 0.535 Interaction S X D Ns * * S X V Ns * * D X V Ns * * S X D X V Ns Ns Ns Means in a column and treatment group followed by same letters are not significantly different using DNMRT at 5% level. NS = Not significant, *= significant at 5% level. Open Access AJPS 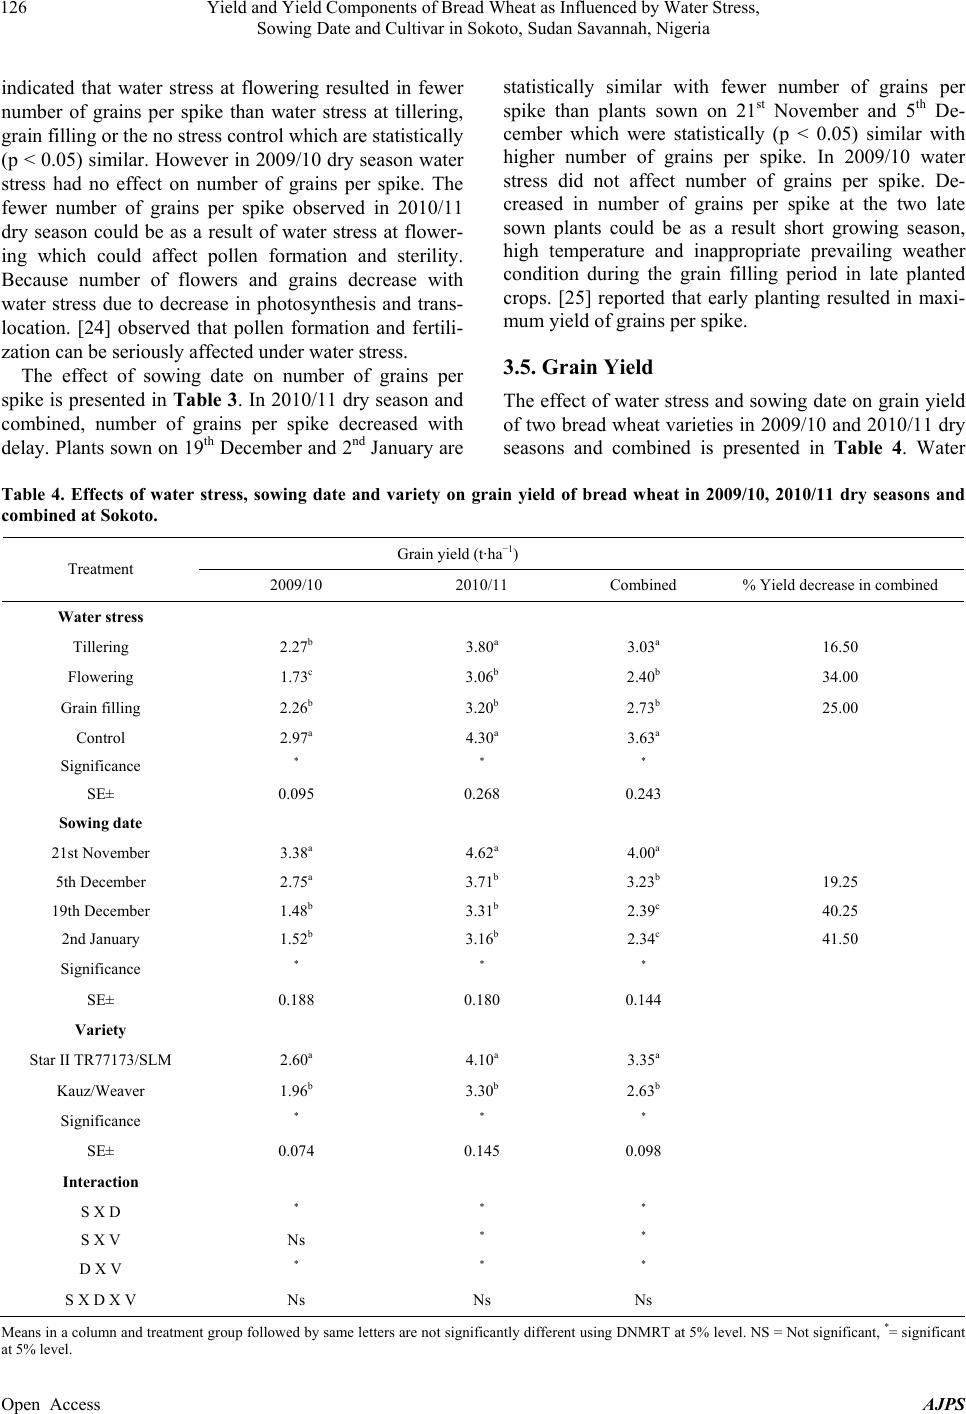 Yield and Yield Components of Bread Wheat as Influenced by Water Stress, Sowing Date and Cultivar in Sokoto, Sudan Savannah, Nigeria Open Access AJPS 126 indicated that water stress at flowering resulted in fewer number of grains per spike than water stress at tillering, grain filling or the no stress control which are statistically (p < 0.05) similar. However in 2009/10 dry season water stress had no effect on number of grains per spike. The fewer number of grains per spike observed in 2010/11 dry season could be as a result of water stress at flower- ing which could affect pollen formation and sterility. Because number of flowers and grains decrease with water stress due to decrease in photosynthesis and trans- location. [24] observed that pollen formation and fertili- zation can be seriously affected under water stress. The effect of sowing date on number of grains per spike is presented in Tab le 3. In 2010/11 dry season and combined, number of grains per spike decreased with delay. Plants sown on 19th December and 2nd January are statistically similar with fewer number of grains per spike than plants sown on 21st November and 5th De- cember which were statistically (p < 0.05) similar with higher number of grains per spike. In 2009/10 water stress did not affect number of grains per spike. De- creased in number of grains per spike at the two late sown plants could be as a result short growing season, high temperature and inappropriate prevailing weather condition during the grain filling period in late planted crops. [25] reported that early planting resulted in maxi- mum yield of grains per spike. 3.5. Grain Yield The effect of water stress and sowing date on grain yield of two bread wheat varieties in 2009/10 and 2010/11 dry seasons and combined is presented in Table 4. Water Table 4. Effects of water stress, sowing date and variety on grain yield of bread wheat in 2009/10, 2010/11 dry seasons and combined at Sokoto. Grain yield (t·ha−1) Treatment 2009/10 2010/11 Combined % Yield decrease in combined Water stress Tillering 2.27b 3.80a 3.03a 16.50 Flowering 1.73c 3.06b 2.40b 34.00 Grain filling 2.26b 3.20b 2.73b 25.00 Control 2.97a 4.30a 3.63a Significance * * * SE± 0.095 0.268 0.243 Sowing date 21st November 3.38a 4.62a 4.00a 5th December 2.75a 3.71b 3.23b 19.25 19th December 1.48b 3.31b 2.39c 40.25 2nd January 1.52b 3.16b 2.34c 41.50 Significance * * * SE± 0.188 0.180 0.144 Variety Star II TR77173/SLM 2.60a 4.10a 3.35a Kauz/Weaver 1.96b 3.30b 2.63b Significance * * * SE± 0.074 0.145 0.098 Interaction S X D * * * S X V Ns * * D X V * * * S X D X V Ns Ns Ns Means in a column and treatment group followed by same letters are not significantly different using DNMRT at 5% level. NS = Not significant, *= significant at 5% level. 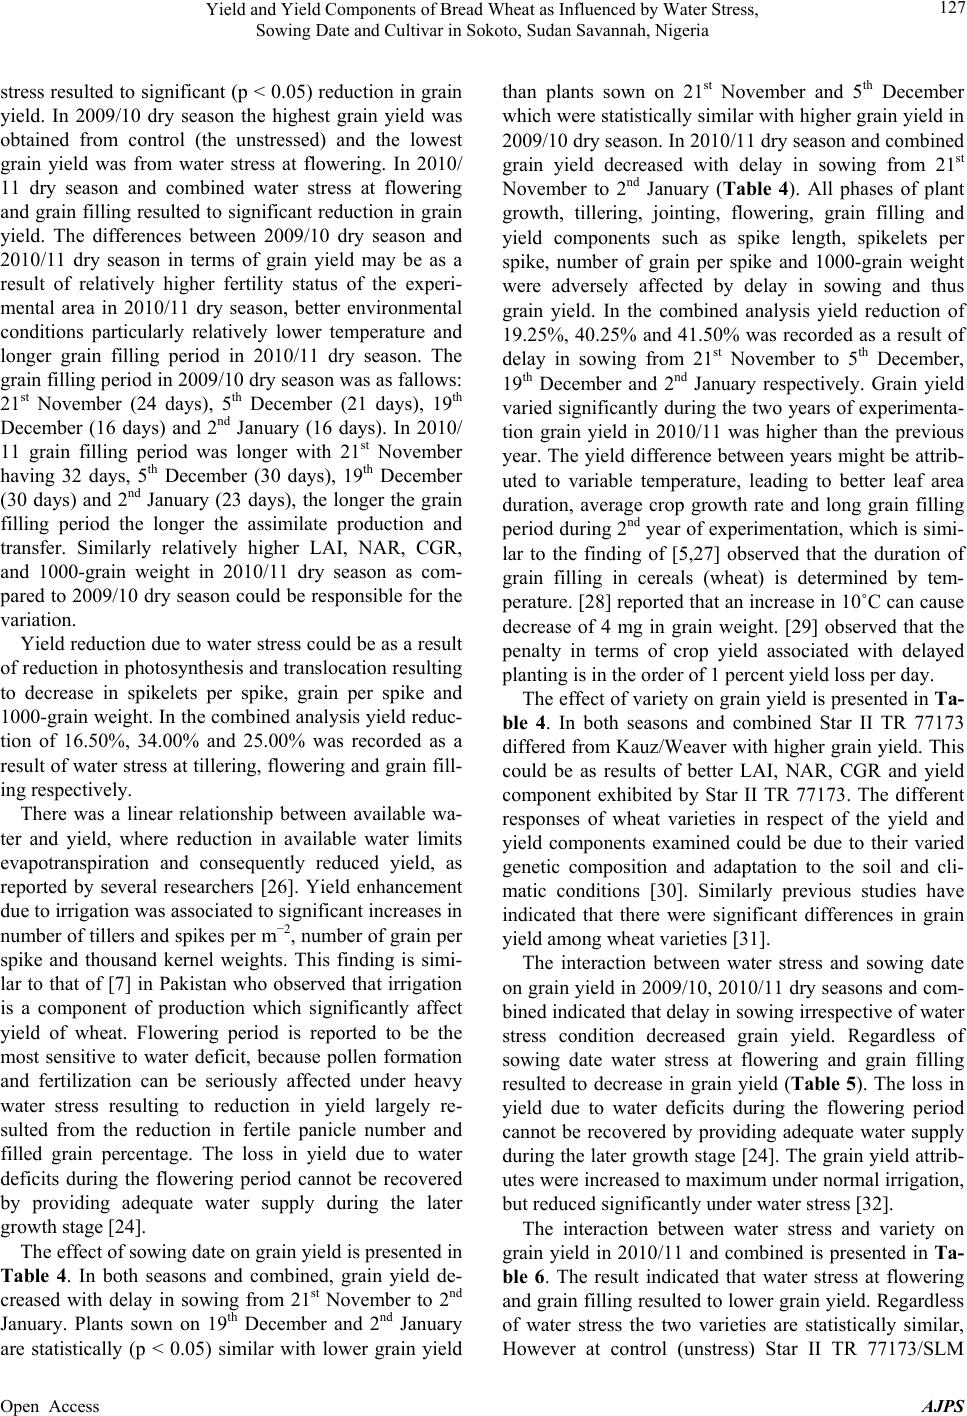 Yield and Yield Components of Bread Wheat as Influenced by Water Stress, Sowing Date and Cultivar in Sokoto, Sudan Savannah, Nigeria 127 stress resulted to significant (p < 0.05) reduction in grain yield. In 2009/10 dry season the highest grain yield was obtained from control (the unstressed) and the lowest grain yield was from water stress at flowering. In 2010/ 11 dry season and combined water stress at flowering and grain filling resulted to significant reduction in grain yield. The differences between 2009/10 dry season and 2010/11 dry season in terms of grain yield may be as a result of relatively higher fertility status of the experi- mental area in 2010/11 dry season, better environmental conditions particularly relatively lower temperature and longer grain filling period in 2010/11 dry season. The grain filling period in 2009/10 dry season was as fallows: 21st November (24 days), 5th December (21 days), 19th December (16 days) and 2nd January (16 days). In 2010/ 11 grain filling period was longer with 21st November having 32 days, 5th December (30 days), 19th December (30 days) and 2nd January (23 days), the longer the grain filling period the longer the assimilate production and transfer. Similarly relatively higher LAI, NAR, CGR, and 1000-grain weight in 2010/11 dry season as com- pared to 2009/10 dry season could be responsible for the variation. Yield reduction due to water stress could be as a result of reduction in photosynthesis and translocation resulting to decrease in spikelets per spike, grain per spike and 1000-grain weight. In the combined analysis yield reduc- tion of 16.50%, 34.00% and 25.00% was recorded as a result of water stress at tillering, flowering and grain fill- ing respectively. There was a linear relationship between available wa- ter and yield, where reduction in available water limits evapotranspiration and consequently reduced yield, as reported by several researchers [26]. Yield enhancement due to irrigation was associated to significant increases in number of tillers and spikes per m−2, number of grain per spike and thousand kernel weights. This finding is simi- lar to that of [7] in Pakistan who observed that irrigation is a component of production which significantly affect yield of wheat. Flowering period is reported to be the most sensitive to water deficit, because pollen formation and fertilization can be seriously affected under heavy water stress resulting to reduction in yield largely re- sulted from the reduction in fertile panicle number and filled grain percentage. The loss in yield due to water deficits during the flowering period cannot be recovered by providing adequate water supply during the later growth stage [24]. The effect of sowing date on grain yield is presented in Table 4. In both seasons and combined, grain yield de- creased with delay in sowing from 21st November to 2nd January. Plants sown on 19th December and 2nd January are statistically (p < 0.05) similar with lower grain yield than plants sown on 21st November and 5th December which were statistically similar with higher grain yield in 2009/10 dry season. In 2010/11 dry season and combined grain yield decreased with delay in sowing from 21st November to 2nd January (Tabl e 4). All phases of plant growth, tillering, jointing, flowering, grain filling and yield components such as spike length, spikelets per spike, number of grain per spike and 1000-grain weight were adversely affected by delay in sowing and thus grain yield. In the combined analysis yield reduction of 19.25%, 40.25% and 41.50% was recorded as a result of delay in sowing from 21st November to 5th December, 19th December and 2nd January respectively. Grain yield varied significantly during the two years of experimenta- tion grain yield in 2010/11 was higher than the previous year. The yield difference between years might be attrib- uted to variable temperature, leading to better leaf area duration, average crop growth rate and long grain filling period during 2nd year of experimentation, which is simi- lar to the finding of [5,27] observed that the duration of grain filling in cereals (wheat) is determined by tem- perature. [28] reported that an increase in 10˚C can cause decrease of 4 mg in grain weight. [29] observed that the penalty in terms of crop yield associated with delayed planting is in the order of 1 percent yield loss per day. The effect of variety on grain yield is presented in Ta- ble 4. In both seasons and combined Star II TR 77173 differed from Kauz/Weaver with higher grain yield. This could be as results of better LAI, NAR, CGR and yield component exhibited by Star II TR 77173. The different responses of wheat varieties in respect of the yield and yield components examined could be due to their varied genetic composition and adaptation to the soil and cli- matic conditions [30]. Similarly previous studies have indicated that there were significant differences in grain yield among wheat varieties [31]. The interaction between water stress and sowing date on grain yield in 2009/10, 2010/11 dry seasons and com- bined indicated that delay in sowing irrespective of water stress condition decreased grain yield. Regardless of sowing date water stress at flowering and grain filling resulted to decrease in grain yield (Table 5). The loss in yield due to water deficits during the flowering period cannot be recovered by providing adequate water supply during the later growth stage [24]. The grain yield attrib- utes were increased to maximum under normal irrigation, but reduced significantly under water stress [32]. The interaction between water stress and variety on grain yield in 2010/11 and combined is presented in Ta- ble 6. The result indicated that water stress at flowering and grain filling resulted to lower grain yield. Regardless of water stress the two varieties are statistically similar, However at control (unstress) Star II TR 77173/SLM Open Access AJPS 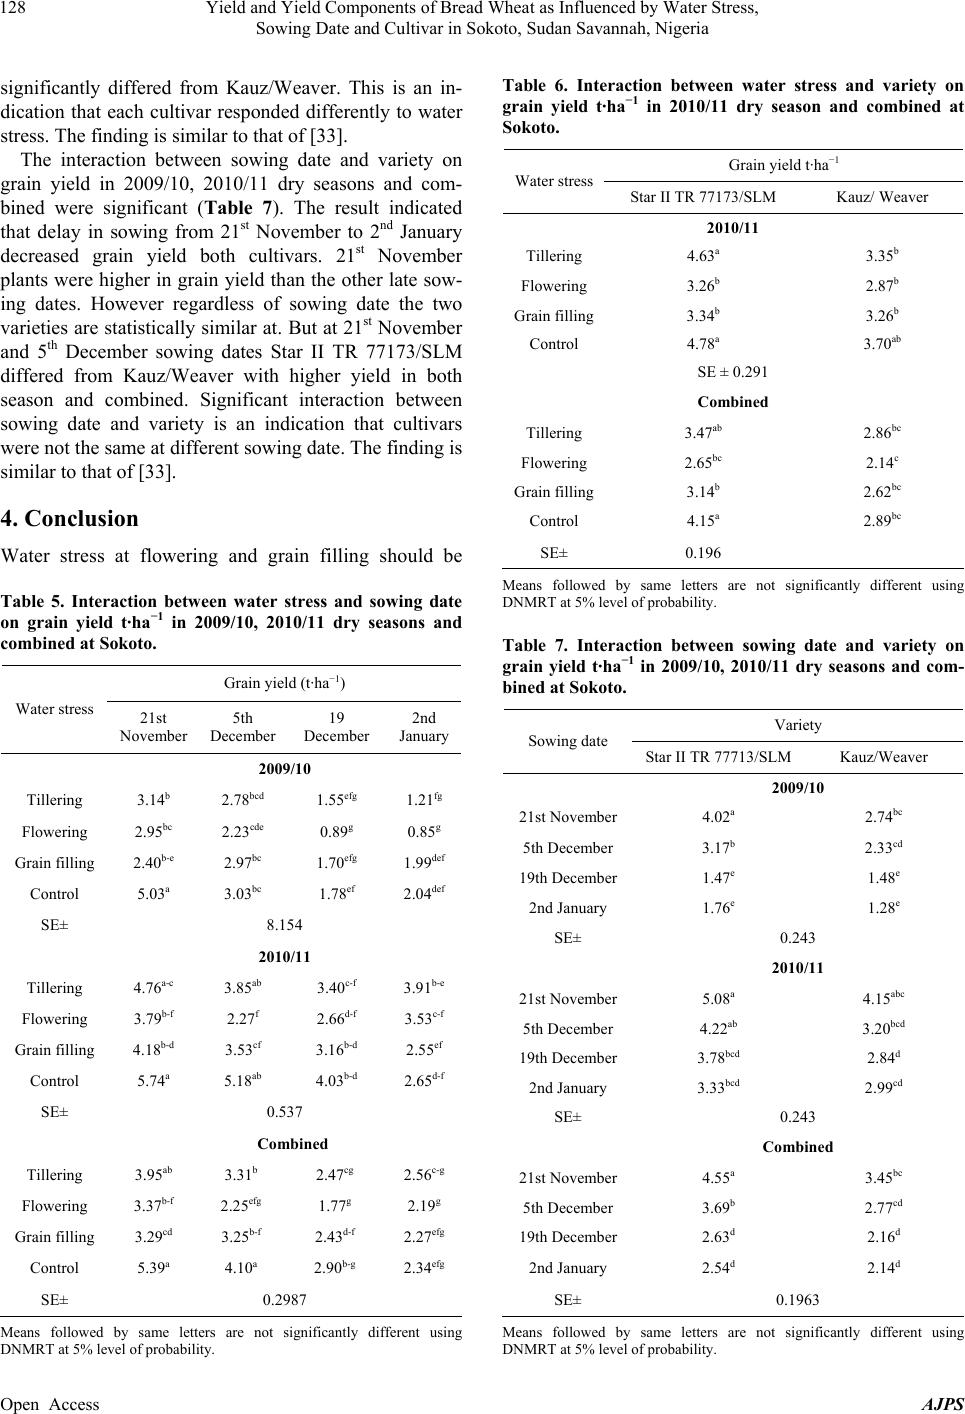 Yield and Yield Components of Bread Wheat as Influenced by Water Stress, Sowing Date and Cultivar in Sokoto, Sudan Savannah, Nigeria 128 significantly differed from Kauz/Weaver. This is an in- dication that each cultivar responded differently to water stress. The finding is similar to that of [33]. The interaction between sowing date and variety on grain yield in 2009/10, 2010/11 dry seasons and com- bined were significant (Table 7). The result indicated that delay in sowing from 21st November to 2nd January decreased grain yield both cultivars. 21st November plants were higher in grain yield than the other late sow- ing dates. However regardless of sowing date the two varieties are statistically similar at. But at 21st November and 5th December sowing dates Star II TR 77173/SLM differed from Kauz/Weaver with higher yield in both season and combined. Significant interaction between sowing date and variety is an indication that cultivars were not the same at different sowing date. The finding is similar to that of [33]. 4. Conclusion Water stress at flowering and grain filling should be Table 5. Interaction between water stress and sowing date on grain yield t·ha−1 in 2009/10, 2010/11 dry seasons and combined at Sokoto. Grain yield (t·ha−1) Water stress 21st November 5th December 19 December 2nd January 2009/10 Tillering 3.14b 2.78bcd 1.55efg 1.21fg Flowering 2.95bc 2.23cde 0.89g 0.85g Grain filling 2.40b-e 2.97bc 1.70efg 1.99def Control 5.03a 3.03bc 1.78ef 2.04def SE± 8.154 2010/11 Tillering 4.76a-c 3.85ab 3.40c-f 3.91b-e Flowering 3.79b-f 2.27f 2.66d-f 3.53c-f Grain filling 4.18b-d 3.53cf 3.16b-d 2.55ef Control 5.74a 5.18ab 4.03b-d 2.65d-f SE± 0.537 Combined Tillering 3.95ab 3.31b 2.47cg 2.56c-g Flowering 3.37b-f 2.25efg 1.77g 2.19g Grain filling 3.29cd 3.25b-f 2.43d-f 2.27efg Control 5.39a 4.10a 2.90b-g 2.34efg SE± 0.2987 Means followed by same letters are not significantly different using DNMRT at 5% level of probability. Table 6. Interaction between water stress and variety on grain yield t·ha−1 in 2010/11 dry season and combined at Sokoto. Grain yield t·ha−1 Water stress Star II TR 77173/SLM Kauz/ Weaver 2010/11 Tillering 4.63a 3.35b Flowering 3.26b 2.87b Grain filling3.34b 3.26b Control 4.78a 3.70ab SE ± 0.291 Combined Tillering 3.47ab 2.86bc Flowering 2.65bc 2.14c Grain filling3.14b 2.62bc Control 4.15a 2.89bc SE± 0.196 Means followed by same letters are not significantly different using DNMRT at 5% level of probability. Table 7. Interaction between sowing date and variety on grain yield t·ha−1 in 2009/10, 2010/11 dry seasons and com- bined at Sokoto. Variety Sowing date Star II TR 77713/SLM Kauz/Weaver 2009/10 21st November 4.02a 2.74bc 5th December 3.17b 2.33cd 19th December 1.47e 1.48e 2nd January 1.76e 1.28e SE± 0.243 2010/11 21st November 5.08a 4.15abc 5th December 4.22ab 3.20bcd 19th December 3.78bcd 2.84d 2nd January 3.33bcd 2.99cd SE± 0.243 Combined 21st November 4.55a 3.45bc 5th December 3.69b 2.77cd 19th December 2.63d 2.16d 2nd January 2.54d 2.14d SE± 0.1963 Means followed by same letters are not significantly different using DNMRT at 5% level of probability. Open Access AJPS 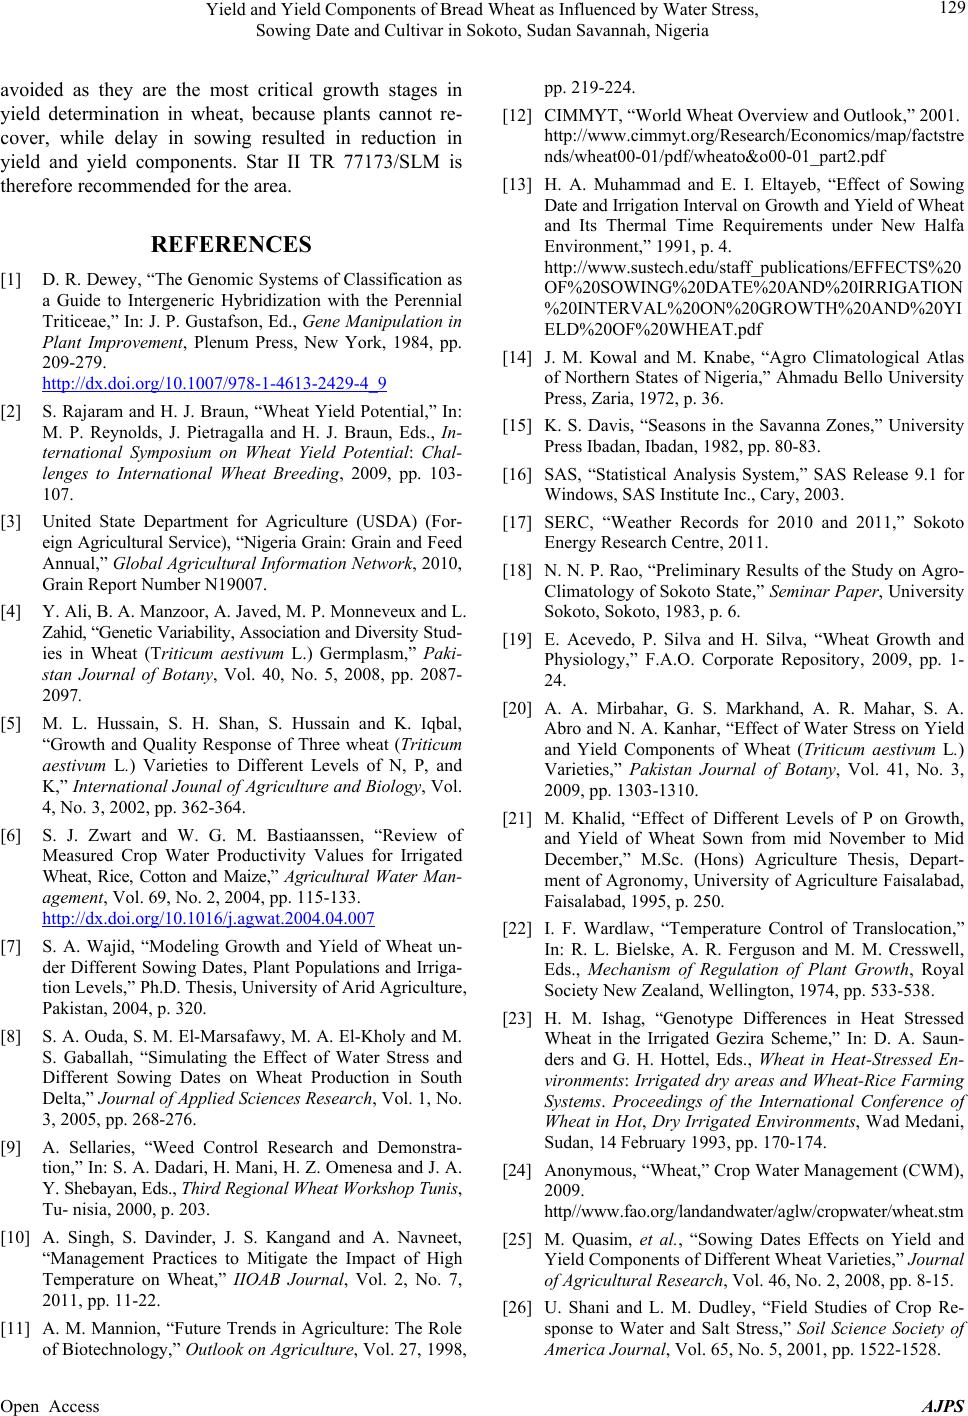 Yield and Yield Components of Bread Wheat as Influenced by Water Stress, Sowing Date and Cultivar in Sokoto, Sudan Savannah, Nigeria 129 avoided as they are the most critical growth stages in yield determination in wheat, because plants cannot re- cover, while delay in sowing resulted in reduction in yield and yield components. Star II TR 77173/SLM is therefore recommended for the area. REFERENCES [1] D. R. Dewey, “The Genomic Systems of Classification as a Guide to Intergeneric Hybridization with the Perennial Triticeae,” In: J. P. Gustafson, Ed., Gene Manipulation in Plant Improvement, Plenum Press, New York, 1984, pp. 209-279. http://dx.doi.org/10.1007/978-1-4613-2429-4_9 [2] S. Rajaram and H. J. Braun, “Wheat Yield Potential,” In: M. P. Reynolds, J. Pietragalla and H. J. Braun, Eds., In- ternational Symposium on Wheat Yield Potential: Chal- lenges to International Wheat Breeding, 2009, pp. 103- 107. [3] United State Department for Agriculture (USDA) (For- eign Agricultural Service), “Nigeria Grain: Grain and Feed Annual,” Global Agricultural Information Network, 2010, Grain Report Number N19007. [4] Y. Ali, B. A. Manzoor, A. Javed, M. P. Monneveux and L. Zahid, “Genetic Variability, Association and Diversity Stud- ies in Wheat (Triticum aestivum L.) Germplasm,” Paki- stan Journal of Botany, Vol. 40, No. 5, 2008, pp. 2087- 2097. [5] M. L. Hussain, S. H. Shan, S. Hussain and K. Iqbal, “Growth and Quality Response of Three wheat (Triticum aestivum L.) Varieties to Different Levels of N, P, and K,” International Jounal of Agriculture and Biology, Vol. 4, No. 3, 2002, pp. 362-364. [6] S. J. Zwart and W. G. M. Bastiaanssen, “Review of Measured Crop Water Productivity Values for Irrigated Wheat, Rice, Cotton and Maize,” Agricultural Water Man- agement, Vol. 69, No. 2, 2004, pp. 115-133. http://dx.doi.org/10.1016/j.agwat.2004.04.007 [7] S. A. Wajid, “Modeling Growth and Yield of Wheat un- der Different Sowing Dates, Plant Populations and Irriga- tion Levels,” Ph.D. Thesis, University of Arid Agriculture, Pakistan, 2004, p. 320. [8] S. A. Ouda, S. M. El-Marsafawy, M. A. El-Kholy and M. S. Gaballah, “Simulating the Effect of Water Stress and Different Sowing Dates on Wheat Production in South Delta,” Journal of Applied Sciences Research, Vol. 1, No. 3, 2005, pp. 268-276. [9] A. Sellaries, “Weed Control Research and Demonstra- tion,” In: S. A. Dadari, H. Mani, H. Z. Omenesa and J. A. Y. Shebayan, Eds., Third Regional Wheat Workshop Tunis, Tu- nisia, 2000, p. 203. [10] A. Singh, S. Davinder, J. S. Kangand and A. Navneet, “Management Practices to Mitigate the Impact of High Temperature on Wheat,” IIOAB Journal, Vol. 2, No. 7, 2011, pp. 11-22. [11] A. M. Mannion, “Future Trends in Agriculture: The Role of Biotechnology,” Outlook on Agriculture, Vol. 27, 1998, pp. 219-224. [12] CIMMYT, “World Wheat Overview and Outlook,” 2001. http://www.cimmyt.org/Research/Economics/map/factstre nds/wheat00-01/pdf/wheato&o00-01_part2.pdf [13] H. A. Muhammad and E. I. Eltayeb, “Effect of Sowing Date and Irrigation Interval on Growth and Yield of Wheat and Its Thermal Time Requirements under New Halfa Environment,” 1991, p. 4. http://www.sustech.edu/staff_publications/EFFECTS%20 OF%20SOWING%20DATE%20AND%20IRRIGATION %20INTERVAL%20ON%20GROWTH%20AND%20YI ELD%20OF%20WHEAT.pdf [14] J. M. Kowal and M. Knabe, “Agro Climatological Atlas of Northern States of Nigeria,” Ahmadu Bello University Press, Zaria, 1972, p. 36. [15] K. S. Davis, “Seasons in the Savanna Zones,” University Press Ibadan, Ibadan, 1982, pp. 80-83. [16] SAS, “Statistical Analysis System,” SAS Release 9.1 for Windows, SAS Institute Inc., Cary, 2003. [17] SERC, “Weather Records for 2010 and 2011,” Sokoto Energy Research Centre, 2011. [18] N. N. P. Rao, “Preliminary Results of the Study on Agro- Climatology of Sokoto State,” Seminar Paper, University Sokoto, Sokoto, 1983, p. 6. [19] E. Acevedo, P. Silva and H. Silva, “Wheat Growth and Physiology,” F.A.O. Corporate Repository, 2009, pp. 1- 24. [20] A. A. Mirbahar, G. S. Markhand, A. R. Mahar, S. A. Abro and N. A. Kanhar, “Effect of Water Stress on Yield and Yield Components of Wheat (Triticum aestivum L.) Varieties,” Pakistan Journal of Botany, Vol. 41, No. 3, 2009, pp. 1303-1310. [21] M. Khalid, “Effect of Different Levels of P on Growth, and Yield of Wheat Sown from mid November to Mid December,” M.Sc. (Hons) Agriculture Thesis, Depart- ment of Agronomy, University of Agriculture Faisalabad, Faisalabad, 1995, p. 250. [22] I. F. Wardlaw, “Temperature Control of Translocation,” In: R. L. Bielske, A. R. Ferguson and M. M. Cresswell, Eds., Mechanism of Regulation of Plant Growth, Royal Society New Zealand, Wellington, 1974, pp. 533-538. [23] H. M. Ishag, “Genotype Differences in Heat Stressed Wheat in the Irrigated Gezira Scheme,” In: D. A. Saun- ders and G. H. Hottel, Eds., Wheat in Heat-Stressed En- vironments: Irrigated dry areas and Wheat-Rice Farming Systems. Proceedings of the International Conference of Wheat in Hot, Dry Irrigated Environments, Wad Medani, Sudan, 14 February 1993, pp. 170-174. [24] Anonymous, “Wheat,” Crop Water Management (CWM), 2009. http//www.fao.org/landandwater/aglw/cropwater/wheat.stm [25] M. Quasim, et al., “Sowing Dates Effects on Yield and Yield Components of Different Wheat Varieties,” Journal of Agricultural Research, Vol. 46, No. 2, 2008, pp. 8-15. [26] U. Shani and L. M. Dudley, “Field Studies of Crop Re- sponse to Water and Salt Stress,” Soil Science Society of America Journal, Vol. 65, No. 5, 2001, pp. 1522-1528. Open Access AJPS  Yield and Yield Components of Bread Wheat as Influenced by Water Stress, Sowing Date and Cultivar in Sokoto, Sudan Savannah, Nigeria Open Access AJPS 130 http://dx.doi.org/10.2136/sssaj2001.6551522x [27] T. R. Wheeler, T. D. Hong, R. H. Ellis, G. R. Batts, J. I. L. Morison and P. Hadley, “The Duration and Rate of Grain Growth and Harvest Index of Wheat (Triticum aestivum L.) in Response to Temperature and CO2,” Journal of Experimental Botany, Vol. 47, No. 5, 1996, pp. 623- 630. http://dx.doi.org/10.1093/jxb/47.5.623 [28] H. M. Ishag and B. A. Mohamed, “Phasic Development of Spring Wheat and Stability of Yield and Its Compo- nents in Hot Environments,” Field Crops Research, Vol. 46, No. 1, 1996, pp. 169-176. http://dx.doi.org/10.1016/0378-4290(95)00100-X [29] E. Acevedo, P. Silva, R. Pargas and A. Mujeeb-Kazi, “Trigos Harineros, Trigos Duros y Trigos Sintéticos Hexaploides en Suelos Salinos y no Salinos,” IDESIA (Chile), Vol. 21, No. 2, 2003, pp. 75-88. [30] V. Kumar, J. J. Owonubi and A. M. Falaki, “Agronomy of Irrigated Wheat in the Nigerian Savanna,” First Na- tional Conference on Wheat Production, Processing and Utilization in Nigeria, State Government Secretariats, In- ternational Conference Centre, Maiduguri, 29 January-2 February, 1990, p. 17. [31] M. R. Siddique, B. A. Hamid and M. S. Islam, “Drought Stress Effects on Water Relations of Wheat,” Botanical Bulletin of Academia Sinica, Vol. 41, No. 1, 2000, pp. 35- 39. [32] K. D. Sharma, R. K. Pannu, P. K. Tyagi, B. D. Chaudhary and D. P. Singh, “Effect of Moisture Stress on Plant Wa- ter Relations and Yield of Different Wheat Genotypes,” Indian Journal of Plant Physiology, Vol. 8, No. 1, 2003, pp. 99-102. [33] M. I. Ismail, “Study of Drought Tolerance in Several Durum Wheat Genotypes Subjected to Water Stress at Various Growth Stages,” MsC Thesis, University of Jor- dan, Amman, 1996, p. 300. |