

Paper Menu >>
Journal Menu >>
 Journal of Cancer Therapy, 2013, 4, 1513-1519 Published Online December 2013 (http://www.scirp.org/journal/jct) http://dx.doi.org/10.4236/jct.2013.410183 Open Access JCT 1513 Population Pharmacokinetics of UCN-01 Charlene A. Baksh1, Martin J. Edelman2, Edward A. Sausville2, William D. Figg3, Hao Zhu4, Kenneth S. Bauer1 1Department of Pharmacy Practice and Science, University of Maryland Baltimore, School of Pharmacy, Baltimore, USA; 2University of Maryland Greenbaum Cancer Center, Baltimore, USA; 3Clinical Pharmacology Research Core, National Cancer Institute, National Institutes of Health, Bethesda, USA; 4Office of Clinical Pharmacology, Food and Drug Administration, Silver Spring, USA. Email: [email protected] Received October 9th, 2013; revised November 8th, 2013; accepted November 16th, 2013 Copyright © 2013 Charlene A. Baksh et al. This is an open access article distributed under the Creative Commons Attribution Li- cense, which permits unrestricted use, distribution, and reproduction in any medium, provided the original work is properly cited. In accordance of the Creative Commons Attribution License all Copyrights © 2013 are reserved for SCIRP and the owner of the intel- lectual property Charlene A. Baksh et al. All Copyright © 2013 are guarded by law and by SCIRP as a guardian. ABSTRACT UCN-01 (7-Hydroxystaurosporine) is an investigational anticancer agent that is currently being evaluated as targeted therapy in phase II clinical studies. The aims of this work were to describe the population pharmacokinetics of UCN-01 in patients with advanced solid tumors, and to identify covariates in patients with advanced solid tumors that affected the pharmacokinetic parameters of UCN-01. The utility of performing this research is to provide optimization of treat- ment and individualized dose therapy for minimization of toxicity. So, in addition to elucidating the population phar- macokinetic parameter estimates from a Phase I trial where UCN-01 was given in combination with carboplatin in pa- tients with advanced solid tumors, and a trial where the drug was given alone as a 72-hour infusion in the same type of population, a covariate analysis was performed in order to identify pharmacokinetic determinants of UCN-01. Using NONMEM to perform nonlinear mixed-effects modeling, a linear two-compartment model was found to provide the best fit for UCN-01 data. A meta-analysis was performed, which included pooled 3-hour and 72-hour infusion data, and provided population pharmacokinetic estimates for CL (0.0157 L/hr [6.1%RSE]), V1 (2.51 L [10.0% RSE]), Q (4.05 L/hr [14.3% RSE]), and V2 (8.39 L [6.6% RSE]). Inter-individual variability was found for each of the main pharma- cokinetic parameters to be ETACL (44.9% [20.8% RSE]), ETAV1 (43.9% [39.8% RSE]), ETAQ (6.09% [62.5% RSE]), and ETAV2 (4.17% [30.0% RSE]). Body surface area was found to be a statistically-significant variable from one of the individual study analyses (3-hour infusion). Population PK modeling has contributed to a better understanding of the clinical pharmacology of UCN-01. Dose individualization may improve treatment with UCN-01. Further clinical de- velopment may be supported by optimization of combination chemotherapy. Keywords: Pharmacokinetics; UCN-01; 7-Hydroxystaurosporine; Pharmacometrics; Population Modeling; Phase I; Clinical Pharmacology 1. Introduction 7-Hydroxystaurosporine (UCN-01) is a protein kinase inhibitor, which has cellular targets of chk1 and chk2 DNA damage-dependent checkpoint kinases, phosphati- dylinositol-dependent kinase I (PDK1), and pathways leading to cyclin-dependent kinase activation [1]. The resultant effects are cell-cycle arrest and the induction of apoptosis. UCN-01 also promotes the sensitization of DNA-damaging agents such as carboplatin. UCN-01 has an extremely high affinity for α1-Acid Glycoprotein (AAG) [2]. AAG is an acute phase reactant protein, whereby the plasma concentration of AAG may change under various physiological and pathological conditions, including cancer, resulting in an alteration of the binding of various drugs. UCN-01 is currently being investigated for use in pa- tients with advanced solid tumors. During the process of therapeutic development, there are many aspects of drug disposition which are reviewed in order to ensure patients’ safety, as well as therapeutic efficacy. This work focuses on the hypothesis that the pharmacokinetic parameters of UCN-01 in patients with advanced solid tumors are in- fluenced by measureable covariates. This hypothesis was posed in order to answer the research question of what  Population Pharmacokinetics of UCN-01 1514 covariates affect the population pharmacokinetic para- meters of UCN-01 in patients with advanced solid tu- mors. Two main study objectives met by conducting this research—first, to describe the population pharmacoki- netics of UCN-01 in patients with advanced solid tumors, and secondly, to identify covariates in patients with ad- vanced solid tumors that affect the pharmacokinetic pa- rameters of UCN-01. The effort to answer the proposed research question is worthwhile in order to provide treatment optimization, and perhaps individualized dose therapy, for minimization of toxicity. 2. Methods 2.1. Pharmacokinetic Analysis Model development was performed using nonlinear mixed-effect modeling within the program NONMEM (version VI, level 1.0, Globomax; Hanover, Maryland) using the WINGS for NONMEM interface (version 614, University of Auckland, Auckland, New Zealand). Either the first order (FO) or the first-order conditional estima- tion (FOCE) method was used for parameter estimation. The NONMEM data file was prepared using Microsoft Excel 2007 (Microsoft Corporation, Redmond, Wash- ington), and NONMEM outputs (i.e. diagnostic graphics) were processed using S-PLUS version 8.0 (Insightful Corporation, Seattle, Washington). The hardware plat- form included 2.0GHz AMD Turion 64X2 TL-60 pro- cessors with 2.93GB RAM running Microsoft Windows XP. A two-compartment model was found to fit the UCN-01 concentration-time profile in preliminary analyses. The fundamental pharmacokinetic parameters used to char- acterize the two-compartment population model were clearance (CL), volume of distribution in compartment 1 (V1), intercompartmental clearance (Q), and volume of distribution in compartment 2 (V2). Unexplained inter- individual variability (IIV) in pharmacokinetic model parameters was estimated using the following model with the random effect ηj: expPj TVPj (1) where TVP is the typical value of the pharmacokinetic parameter in the population, Pj is the individual value for P in the jth individual, and ηj is a random variable with the mean of zero and variance of ωp2. This model as- sumes a log-normal distribution for the Pj values. Esti- mates of IIV in P are presented as the square root of ωp2, which is an approximation of the coefficient of variation of P for a log-normally distributed quantity. The TVP may be further modeled as a function of covariates as follows: 12 expTVP PPCG (2) 1medianexpTVPPCT CTP where θPj (j = 1, 2,…) represents elements of a vector for population fixed-effect parameters, CT is the con- tinuous covariate value of the patient, CT median is the median covariate value along the studied patient popula- tion, and CG is the categorical covariate coded as 0 or 1 in the data set. Random residual variability of the predictions was modeled according to a combined proportional and addi- tive error model: 11 2CijC ijijij (4) where Cij is the amount of the ith plasma concentration measured in the jth individual; C * ij is the respective model-predicted concentration; and εij is the symmetri- cally-distributed random variable with expectation zero and variance σ2. Assay error or incorrect dose and/or sample records were considered potential sources of re- sidual error [3]. 2.2. Statistical Analysis First, analysis was performed in order to find population estimates of each of the pharmacokinetic parameters CL, V1, Q, and V2 for UCN-01. Second, a stepwise proce- dure was executed in order to reveal any statistically- significant covariates. Figure 1 shows the process of forward selection/backward elimination for covariate selection. Effects selected during the first analysis (nominal p value of 0.05, log-likelihood ratio test) were sequentially included in the model, taking the pair (cate- gorical covariate, continuous covariate/pharmacokinetic parameter) with the largest drop in NONMEM objective function value first, until no further pair with an associ- ated nominal p value of 0.05 could be included. A se- quential elimination step followed, deleting the pair with smallest increase in NONMEM objective function first, until no further pair with an associated nominal p value of 0.01 could be excluded. The final pharmacokinetic population model was based on FOCE. 2.3. 3-hr Infusio n Data from a total of 20 subjects, who received various dosages of intravenous UCN-01 in either single- or re- peated 3-hr infusion regimens, and for whom full pharma- 2 (3) Figure 1. Stepwise procedure depicting model development. Open Access JCT 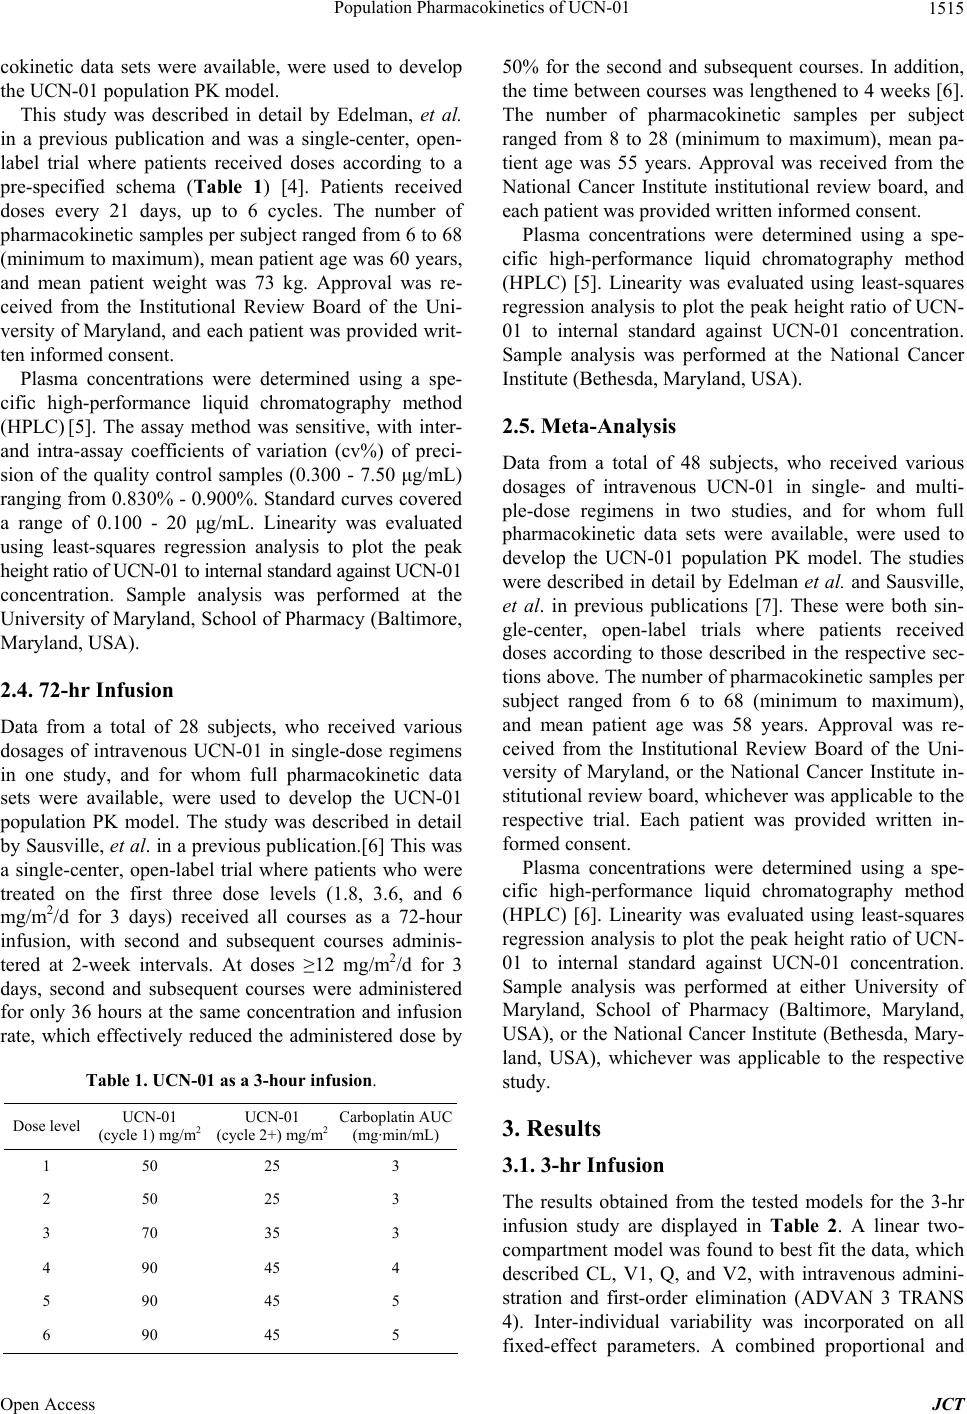 Population Pharmacokinetics of UCN-01 1515 cokinetic data sets were available, were used to develop the UCN-01 population PK model. This study was described in detail by Edelman, et al. in a previous publication and was a single-center, open- label trial where patients received doses according to a pre-specified schema (Table 1) [4]. Patients received doses every 21 days, up to 6 cycles. The number of pharmacokinetic samples per subject ranged from 6 to 68 (minimum to maximum), mean patient age was 60 years, and mean patient weight was 73 kg. Approval was re- ceived from the Institutional Review Board of the Uni- versity of Maryland, and each patient was provided writ- ten informed consent. Plasma concentrations were determined using a spe- cific high-performance liquid chromatography method (HPLC) [5]. The assay method was sensitive, with inter- and intra-assay coefficients of variation (cv%) of preci- sion of the quality control samples (0.300 - 7.50 μg/mL) ranging from 0.830% - 0.900%. Standard curves covered a range of 0.100 - 20 μg/mL. Linearity was evaluated using least-squares regression analysis to plot the peak height ratio of UCN-01 to internal standard against UCN-01 concentration. Sample analysis was performed at the University of Maryland, School of Pharmacy (Baltimore, Maryland, USA). 2.4. 72-hr Infusio n Data from a total of 28 subjects, who received various dosages of intravenous UCN-01 in single-dose regimens in one study, and for whom full pharmacokinetic data sets were available, were used to develop the UCN-01 population PK model. The study was described in detail by Sausville, et al. in a previous publication.[6] This was a single-center, open-label trial where patients who were treated on the first three dose levels (1.8, 3.6, and 6 mg/ m2/d for 3 days) received all courses as a 72-hour infusion, with second and subsequent courses adminis- tered at 2-week intervals. At doses ≥12 mg/m2/d for 3 days, second and subsequent courses were administered for only 36 hours at the same concentration and infusion rate, which effectively reduced the administered dose by Table 1. UCN-01 as a 3-hour infusion. Dose level UCN-01 (cycle 1) mg/m2 UCN-01 (cycle 2+) mg/m2 Carboplatin AUC (mg·min/mL) 1 50 25 3 2 50 25 3 3 70 35 3 4 90 45 4 5 90 45 5 6 90 45 5 50% for the second and subsequent courses. In addition, the time between courses was lengthened to 4 weeks [6]. The number of pharmacokinetic samples per subject ranged from 8 to 28 (minimum to maximum), mean pa- tient age was 55 years. Approval was received from the National Cancer Institute institutional review board, and each patient was provided written informed consent. Plasma concentrations were determined using a spe- cific high-performance liquid chromatography method (HPLC) [5]. Linearity was evaluated using least-squares regression analysis to plot the peak height ratio of UCN- 01 to internal standard against UCN-01 concentration. Sample analysis was performed at the National Cancer Institute (Bethesda, Maryland, USA). 2.5. Meta-Analysis Data from a total of 48 subjects, who received various dosages of intravenous UCN-01 in single- and multi- ple-dose regimens in two studies, and for whom full pharmacokinetic data sets were available, were used to develop the UCN-01 population PK model. The studies were described in detail by Edelman et al. and Sausville, et al. in previous publications [7]. These were both sin- gle-center, open-label trials where patients received doses according to those described in the respective sec- tions above. The number of pharmacokinetic samples per subject ranged from 6 to 68 (minimum to maximum), and mean patient age was 58 years. Approval was re- ceived from the Institutional Review Board of the Uni- versity of Maryland, or the National Cancer Institute in- stitutional review board, whichever was applicable to the respective trial. Each patient was provided written in- formed consent. Plasma concentrations were determined using a spe- cific high-performance liquid chromatography method (HPLC) [6]. Linearity was evaluated using least-squares regression analysis to plot the peak height ratio of UCN- 01 to internal standard against UCN-01 concentration. Sample analysis was performed at either University of Maryland, School of Pharmacy (Baltimore, Maryland, USA), or the National Cancer Institute (Bethesda, Mary- land, USA), whichever was applicable to the respective study. 3. Results 3.1. 3-hr Infusio n The results obtained from the tested models for the 3-hr infusion study are displayed in Table 2. A linear two- compartment model was found to best fit the data, which described CL, V1, Q, and V2, with intravenous admini- stration and first-order elimination (ADVAN 3 TRANS 4). Inter-individual variability was incorporated on all fixed-effect parameters. A combined proportional and Open Access JCT  Population Pharmacokinetics of UCN-01 1516 Table 2. Results from 3-hr infusion study. Model Pharmacokinetic model OFV −ΔOFV 291 One-compartment model first-order elimination 2014.675- 294 Two-compartment model first-order elimination (base model) 1632.389- 314 Model 294 + BSA on V1 1623.1300.259* 342 Model 314 + Albumin on Q 1618.6380.492* 395 Model 342 + BSA on V2 1613.7920.486* additive error model best described the residual variabil- ity (IAV). Inter-occasion variability (IOV) was not needed to be accounted for on any fixed-effect parameter (Figure 2). All covariates were tested separately for their effect on the pharmacokinetic parameters before being included in the model. Combinations of covariates were evaluated. The results following the backward elimination step showed that only BSA significantly influenced UCN-01 V1, whereas all other covariates tested on all fixed-effect parameters did not (i.e. AAG, albumin, bilirubin, Scr, age, height, weight, race, and sex; not shown in Table 2). Figure 3 depicts the graphical relationship between BSA and IIV on V1. By including BSA on V1, there was a reduction of 46% in unexplained IIV for V1. The esti- mated pharmacokinetic parameters are shown in Table 3 . A comparison between the base model and final model for the UCN-01 population PK is shown in Figure 4. 3.2. 72-hr Infusio n The results obtained from the tested models for the 72-hr infusion study are displayed in Table 4. A linear two- compartment model was found to best fit the data, which described CL, V1, Q, and V2, with intravenous admini- stration and first-order elimination (ADVAN 3 TRANS 4). IIV was incorporated on all fixed-effect parameters. A combined proportional and additive error model best described the IAV. All covariates were tested separately for their effect on the pharmacokinetic parameters before being included in the model, and combinations of covariates were evalu- ated. The results following the backward elimination step showed that no covariates tested on any fixed-effect pa- rameters had a statistically-significant effect (i.e. AAG, albumin, bilirubin, BSA, Scr, age, and sex). Therefore, the base model was chosen to best represent this data. The estimated pharmacokinetic parameters are shown in Table 5. Figure 5 is a graphical depiction of the final population PK model for UCN-01 72-hr infusion. Figure 2. Graphical evaluation of inter-occasion variability (IOV). Figure 3. Relationship between BSA and IIV on V1. Figure 4. Comparison of the base model (left) and final population PK (right) model for UCN-01 3-hr infusion. 3.3. Meta-Analysis The results obtained from the various models tested for the meta-analysis are displayed in Table 6. A linear two- compartment model was found to best fit the data, which described CL, V1, Q, and V2, with intravenous admini- stration and first-order elimination (ADVAN 3 TRANS 4). IIV was incorporated on all fixed-effect parameters. A combined proportional and additive error model best Open Access JCT 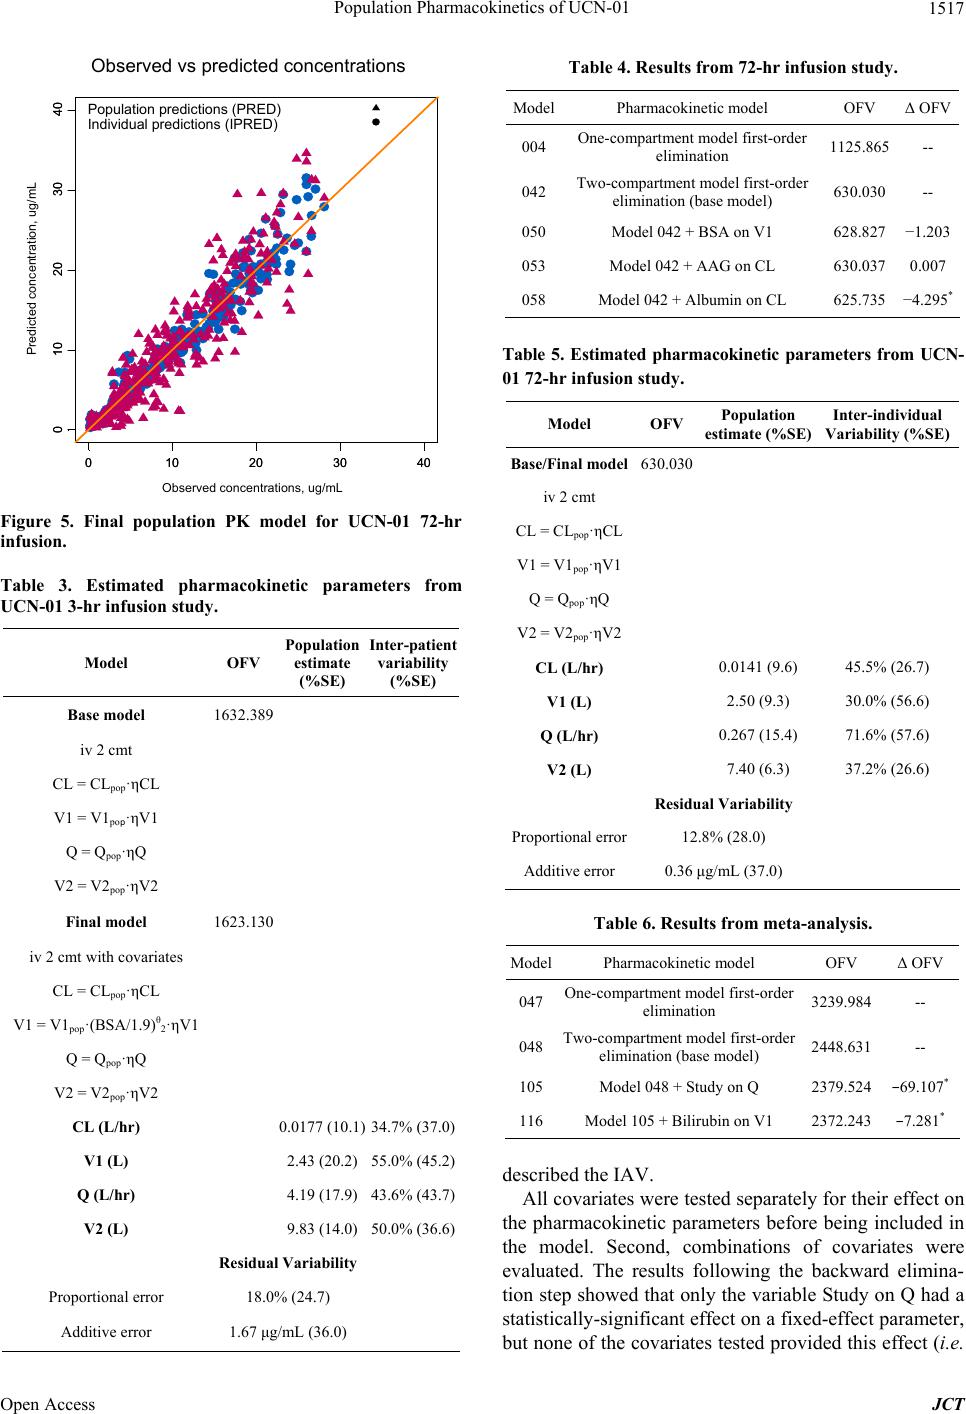 Population Pharmacokinetics of UCN-01 1517 0 10203040 0 10203040 0 10203040 0 10203040 Observed vs predicted concentrations Observed concentrations, ug/mL Predicted concentration, ug/mL Population predictions (PRED) Individual predictions (IPRED) Figure 5. Final population PK model for UCN-01 72-hr infusion. Table 3. Estimated pharmacokinetic parameters from UCN-01 3-hr infusion study. Model OFV Population estimate (%SE) Inter-patient variability (%SE) Base model 1632.389 iv 2 cmt CL = CLpop·ηCL V1 = V1pop·ηV1 Q = Qpop·ηQ V2 = V2pop·ηV2 Final model 1623.130 iv 2 cmt with covariates CL = CLpop·ηCL V1 = V1pop·(BSA/1.9)θ2·ηV1 Q = Qpop·ηQ V2 = V2pop·ηV2 CL (L/hr) 0.0177 (10.1) 34.7% (37.0) V1 (L) 2.43 (20.2) 55.0% (45.2) Q (L/hr) 4.19 (17.9) 43.6% (43.7) V2 (L) 9.83 (14.0) 50.0% (36.6) Residual Variability Proportional error 18.0% (24.7) Additive error 1.67 μg/mL (36.0) Table 4. Results from 72-hr infusion study. ModelPharmacokinetic model OFV Δ OFV 004 One-compartment model first-order elimination 1125.865-- 042 Two-compartment model first-order elimination (base model) 630.030-- 050Model 042 + BSA on V1 628.827−1.203 053Model 042 + AAG on CL 630.0370.007 058Model 042 + Albumin on CL 625.735−4.295* Table 5. Estimated pharmacokinetic parameters from UCN- 01 72-hr infusion study. Model OFV Population estimate (%SE) Inter-individual Variability (%SE) Base/Final model630.030 iv 2 cmt CL = CLpop·ηCL V1 = V1pop·ηV1 Q = Qpop·ηQ V2 = V2pop·ηV2 CL (L/hr) 0.0141 (9.6) 45.5% (26.7) V1 (L) 2.50 (9.3) 30.0% (56.6) Q (L/hr) 0.267 (15.4) 71.6% (57.6) V2 (L) 7.40 (6.3) 37.2% (26.6) Residual Variability Proportional error12.8% (28.0) Additive error 0.36 μg/mL (37.0) Table 6. Results from meta-analysis. ModelPharmacokinetic model OFV Δ OFV 047 One-compartment model first-order elimination 3239.984-- 048 Two-compartment model first-order elimination (base model) 2448.631-- 105Model 048 + Study on Q 2379.524−69.107* 116Model 105 + Bilirubin on V1 2372.243−7.281* described the IAV. All covariates were tested separately for their effect on the pharmacokinetic parameters before being included in the model. Second, combinations of covariates were evaluated. The results following the backward elimina- tion step showed that only the variable Study on Q had a statistically-significant effect on a fixed-effect parameter, but none of the covariates tested provided this effect (i.e. Open Access JCT 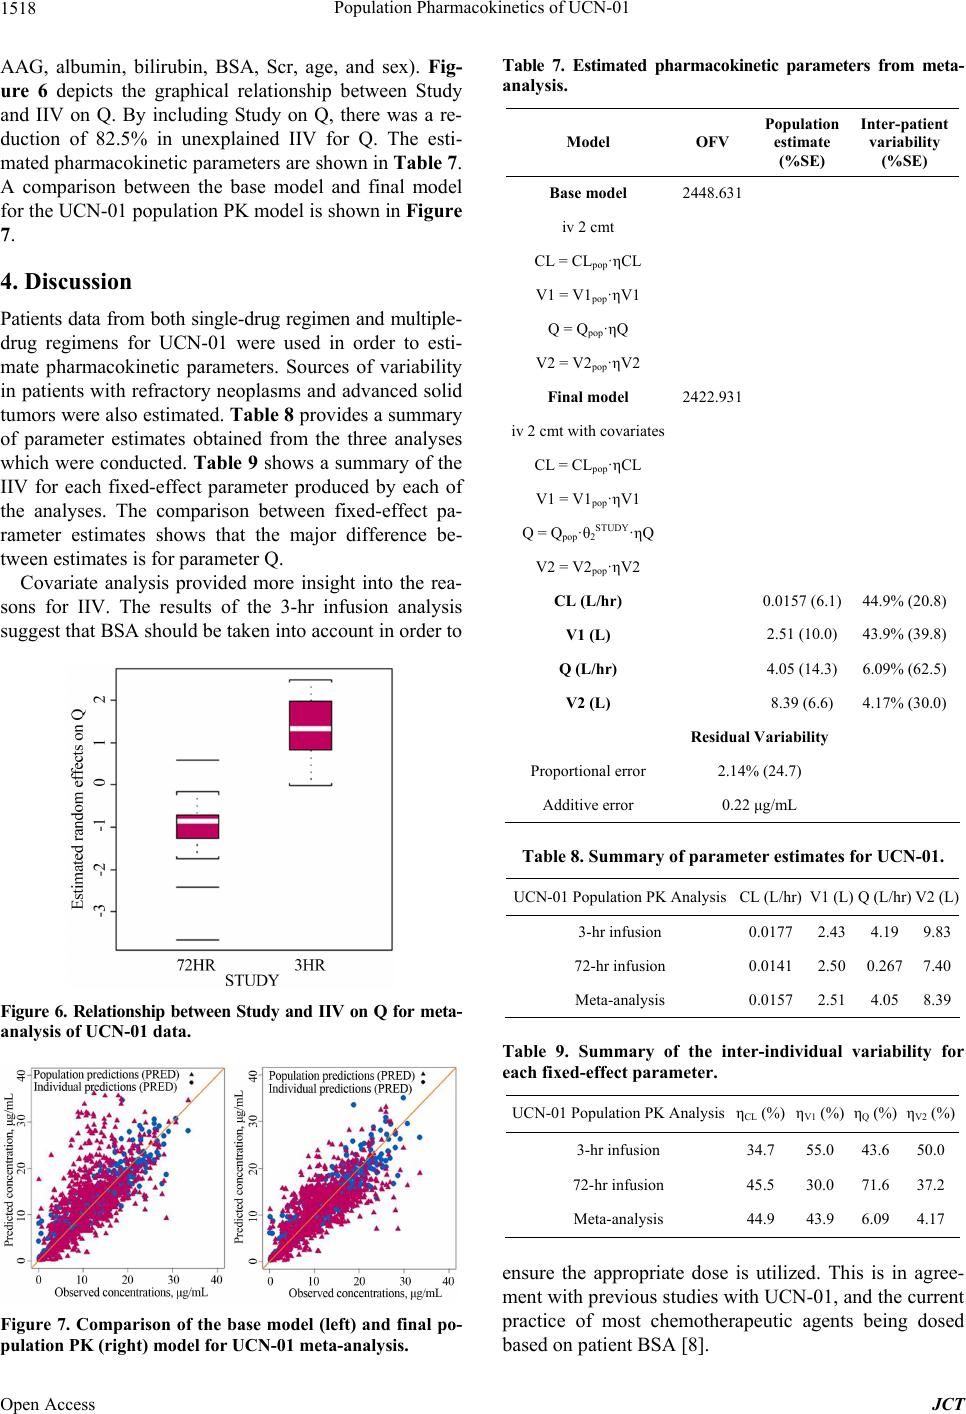 Population Pharmacokinetics of UCN-01 1518 AAG, albumin, bilirubin, BSA, Scr, age, and sex). Fig- ure 6 depicts the graphical relationship between Study and IIV on Q. By including Study on Q, there was a re- duction of 82.5% in unexplained IIV for Q. The esti- mated pharmacokinetic parameters are shown in Table 7 . A comparison between the base model and final model for the UCN-01 population PK model is shown in Figure 7. 4. Discussion Patients data from both single-drug regimen and multiple- drug regimens for UCN-01 were used in order to esti- mate pharmacokinetic parameters. Sources of variability in patients with refractory neoplasms and advanced solid tumors were also estimated. Table 8 provides a summary of parameter estimates obtained from the three analyses which were conducted. Table 9 shows a summary of the IIV for each fixed-effect parameter produced by each of the analyses. The comparison between fixed-effect pa- rameter estimates shows that the major difference be- tween estimates is for parameter Q. Covariate analysis provided more insight into the rea- sons for IIV. The results of the 3-hr infusion analysis suggest that BSA should be taken into account in order to Figure 6. Relationship between Study and IIV on Q for meta- analysis of UCN-01 data. Figure 7. Comparison of the base model (left) and final po- pulation PK (right) model for UCN-01 meta-analysis. Table 7. Estimated pharmacokinetic parameters from meta- analysis. Model OFV Population estimate (%SE) Inter-patient variability (%SE) Base model 2448.631 iv 2 cmt CL = CLpop·ηCL V1 = V1pop·ηV1 Q = Qpop·ηQ V2 = V2pop·ηV2 Final model 2422.931 iv 2 cmt with covariates CL = CLpop·ηCL V1 = V1pop·ηV1 Q = Qpop·θ2STUDY·ηQ V2 = V2pop·ηV2 CL (L/hr) 0.0157 (6.1) 44.9% (20.8) V1 (L) 2.51 (10.0) 43.9% (39.8) Q (L/hr) 4.05 (14.3) 6.09% (62.5) V2 (L) 8.39 (6.6) 4.17% (30.0) Residual Variability Proportional error 2.14% (24.7) Additive error 0.22 μg/mL Table 8. Summary of parameter estimates for UCN-01. UCN-01 Population PK AnalysisCL (L/hr) V1 (L) Q (L/hr)V2 (L) 3-hr infusion 0.0177 2.43 4.199.83 72-hr infusion 0.0141 2.50 0.2677.40 Meta-analysis 0.0157 2.51 4.058.39 Table 9. Summary of the inter-individual variability for each fixed-effect parameter. UCN-01 Population PK AnalysisηCL (%) ηV1 (%) ηQ (%)ηV2 (%) 3-hr infusion 34.7 55.0 43.650.0 72-hr infusion 45.5 30.0 71.637.2 Meta-analysis 44.9 43.9 6.094.17 ensure the appropriate dose is utilized. This is in agree- ment with previous studies with UCN-01, and the current practice of most chemotherapeutic agents being dosed based on patient BSA [8]. Open Access JCT 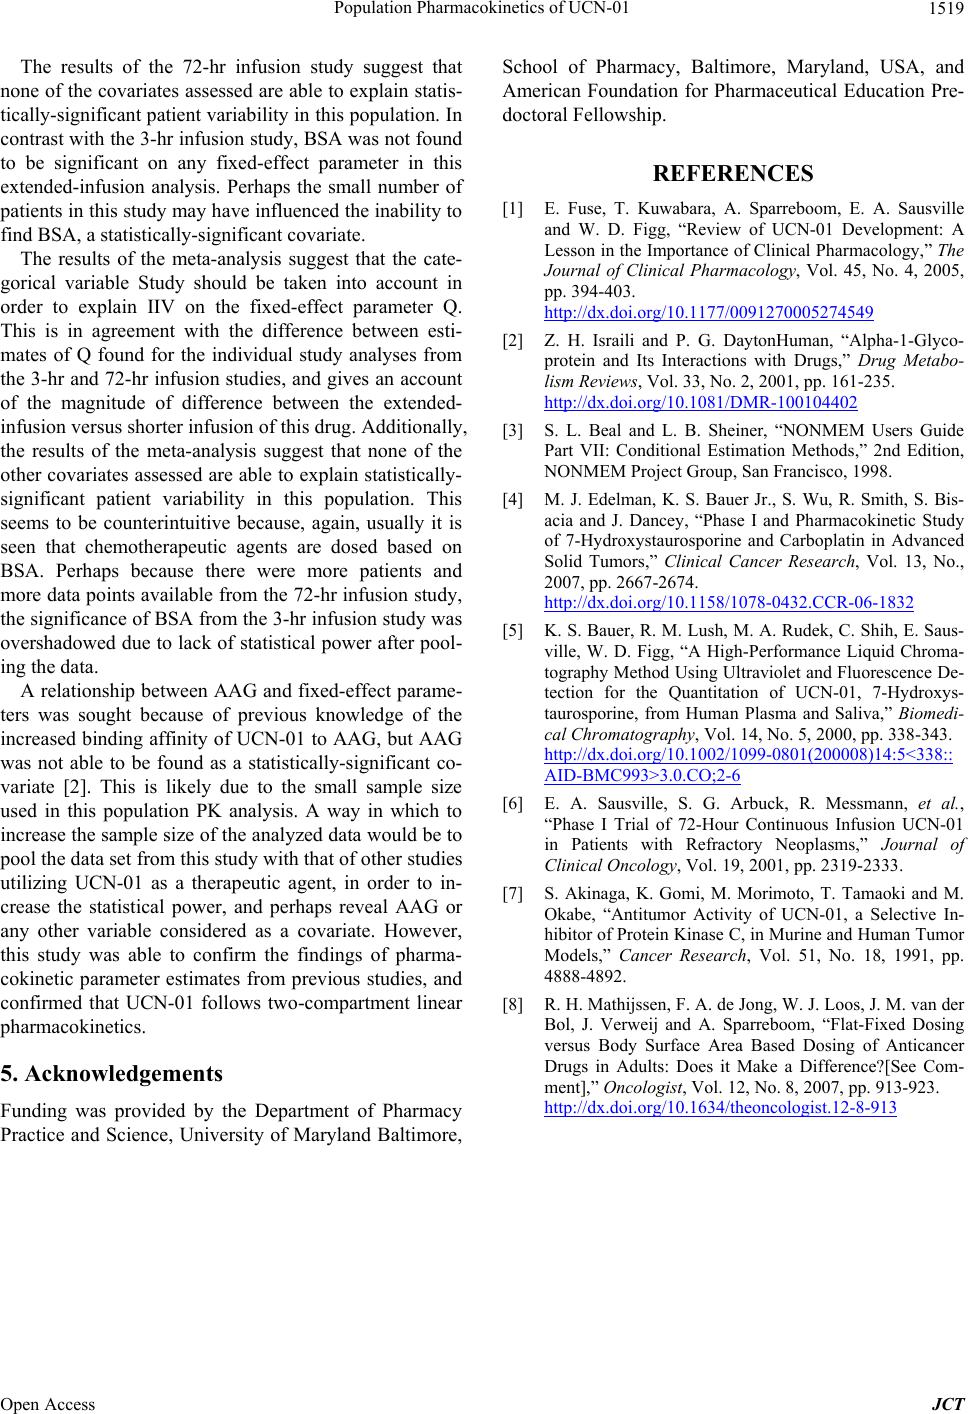 Population Pharmacokinetics of UCN-01 Open Access JCT 1519 The results of the 72-hr infusion study suggest that none of the covariates assessed are able to explain statis- tically-significant patient variability in this population. In contrast with the 3-hr infusion study, BSA was not found to be significant on any fixed-effect parameter in this extended-infusion analysis. Perhaps the small number of patients in this study may have influenced the inability to find BSA, a statistically-significant covariate. The results of the meta-analysis suggest that the cate- gorical variable Study should be taken into account in order to explain IIV on the fixed-effect parameter Q. This is in agreement with the difference between esti- mates of Q found for the individual study analyses from the 3-hr and 72-hr infusion studies, and gives an account of the magnitude of difference between the extended- infusion versus shorter infusion of this drug. Additionally, the results of the meta-analysis suggest that none of the other covariates assessed are able to explain statistically- significant patient variability in this population. This seems to be counterintuitive because, again, usually it is seen that chemotherapeutic agents are dosed based on BSA. Perhaps because there were more patients and more data points available from the 72-hr infusion study, the significance of BSA from the 3-hr infusion study was overshadowed due to lack of statistical power after pool- ing the data. A relationship between AAG and fixed-effect parame- ters was sought because of previous knowledge of the increased binding affinity of UCN-01 to AAG, but AAG was not able to be found as a statistically-significant co- variate [2]. This is likely due to the small sample size used in this population PK analysis. A way in which to increase the sample size of the analyzed data would be to pool the data set from this study with that of other studies utilizing UCN-01 as a therapeutic agent, in order to in- crease the statistical power, and perhaps reveal AAG or any other variable considered as a covariate. However, this study was able to confirm the findings of pharma- cokinetic parameter estimates from previous studies, and confirmed that UCN-01 follows two-compartment linear pharmacokinetics. 5. Acknowledgements Funding was provided by the Department of Pharmacy Practice and Science, University of Maryland Baltimore, School of Pharmacy, Baltimore, Maryland, USA, and American Foundation for Pharmaceutical Education Pre- doctoral Fellowship. REFERENCES [1] E. Fuse, T. Kuwabara, A. Sparreboom, E. A. Sausville and W. D. Figg, “Review of UCN-01 Development: A Lesson in the Importance of Clinical Pharmacology,” The Journal of Clinical Pharmacology, Vol. 45, No. 4, 2005, pp. 394-403. http://dx.doi.org/10.1177/0091270005274549 [2] Z. H. Israili and P. G. DaytonHuman, “Alpha-1-Glyco- protein and Its Interactions with Drugs,” Drug Metabo- lism Reviews, Vol. 33, No. 2, 2001, pp. 161-235. http://dx.doi.org/10.1081/DMR-100104402 [3] S. L. Beal and L. B. Sheiner, “NONMEM Users Guide Part VII: Conditional Estimation Methods,” 2nd Edition, NONMEM Project Group, San Francisco, 1998. [4] M. J. Edelman, K. S. Bauer Jr., S. Wu, R. Smith, S. Bis- acia and J. Dancey, “Phase I and Pharmacokinetic Study of 7-Hydroxystaurosporine and Carboplatin in Advanced Solid Tumors,” Clinical Cancer Research, Vol. 13, No., 2007, pp. 2667-2674. http://dx.doi.org/10.1158/1078-0432.CCR-06-1832 [5] K. S. Bauer, R. M. Lush, M. A. Rudek, C. Shih, E. Saus- ville, W. D. Figg, “A High-Performance Liquid Chroma- tography Method Using Ultraviolet and Fluorescence De- tection for the Quantitation of UCN-01, 7-Hydroxys- taurosporine, from Human Plasma and Saliva,” Biomedi- cal Chromatography, Vol. 14, No. 5, 2000, pp. 338-343. http://dx.doi.org/10.1002/1099-0801(200008)14:5<338:: AID-BMC993>3.0.CO;2-6 [6] E. A. Sausville, S. G. Arbuck, R. Messmann, et al., “Phase I Trial of 72-Hour Continuous Infusion UCN-01 in Patients with Refractory Neoplasms,” Journal of Clinical Oncology, Vol. 19, 2001, pp. 2319-2333. [7] S. Akinaga, K. Gomi, M. Morimoto, T. Tamaoki and M. Okabe, “Antitumor Activity of UCN-01, a Selective In- hibitor of Protein Kinase C, in Murine and Human Tumor Models,” Cancer Research, Vol. 51, No. 18, 1991, pp. 4888-4892. [8] R. H. Mathijssen, F. A. de Jong, W. J. Loos, J. M. van der Bol, J. Verweij and A. Sparreboom, “Flat-Fixed Dosing versus Body Surface Area Based Dosing of Anticancer Drugs in Adults: Does it Make a Difference?[See Com- ment],” Oncologist, Vol. 12, No. 8, 2007, pp. 913-923. http://dx.doi.org/10.1634/theoncologist.12-8-913 |