

Paper Menu >>
Journal Menu >>
 Journal of Water Resource and Protection, 2013, 5, 1262-1267 Published Online December 2013 (http://www.scirp.org/journal/jwarp) http://dx.doi.org/10.4236/jwarp.2013.512135 Open Access JWARP Improved Water Use Estimates for Drilling and Hydrualic Fracturing in Northeastern Colorado Stephen Goodwin1*, Ken Carlson1, Bing Bai1, Luke Rein1, Ken Knox2, Caleb Douglas2 1Department of Civil and Environmental Engineering, Colorado State University, Fort Collins, USA 2Noble Energy, Inc., Environmental Engineering: Denver Office, Denver, USA Email: *[email protected] Received September 21, 2013; revised October 25, 2013; accepted November 23, 2013 Copyright © 2013 Stephen Goodwin et al. This is an open access article distributed under the Creative Commons Attribution License, which permits unrestricted use, distribution, and reproduction in any medium, provided the original work is properly cited. ABSTRACT The development of unconventional resources in tight shales has stimulated considerable growth of oil and gas produc- tion in Northeastern Colorado, but has led to concerns about added demands on the region’s strained water resources. Northeastern Colorado’s semi-arid environment, population growth, competing water demands and uncertainty about drilling and hydraulic fracturing water requirements have resulted in scrutiny and conflict surrounding water use for tight shales. This study collects water use data from wells in Northeastern Colorado to improve water estimates and to better understand important contributing factors. Most water resource studies use estimates for the number of future wells to predict water demands. This study shows that the number of hydraulic fracturing stages is a better measure of the future water demands for horizontal wells. Vertical wells use significantly less water than horizontal wells and will be less prevalent in the future. Keywords: Hydraulic Fracturing; Shale; Wattenberg; Niobrara; Water; Energy 1. Introduction Water resources in Northeastern Colorado and the west- ern United States are constantly strained given the his- torical agricultural needs, burgeoning development, and the semi-arid environment. With continued population growth and the importance of agriculture, the pressure on water resources in the region is expected to intensify. The oil and gas industry has long been a part of Northeastern Colorado’s economy, but recent advances in technology have stimulated considerable growth in the region that has increased the industry’s demand for water resources. Several studies have assessed water resource demands in Northeastern Colorado [1-6]. All of these studies base the total water demands on the number of wells. Typi- cally the water required to drill and hydraulically fracture a well is estimated to be between one and five million gallons per well [7,8]. These general estimates of water use have led to increased uncertainty and conflict sur- rounding water development for the oil and gas industry in Northeastern Colorado. As competition over water resources between agricul- tural, recreational, municipal, and industrial demands, including oil and gas operations continues to escalate, it is important to understand more precisely the demands for the oil and gas industry will place on water resources. Se- veral organizations have voiced concerns about a lack of water use data to assess impacts on water resources. In October, 2011 the State Review of Oil and Natural Gas Environmental Regulations (STRONGER) organization issued a report on rules developed by the Colorado Oil and Gas Conservation Commission (COGCC) related to hydraulic fracturing. One of the five recommendations of the report included the following: The review team recommends that the COGCC and the DWR jointly evaluate available sources of water for use in hydraulic fracturing. Given the significant water sup- ply issues in this arid region, this project should also include an evaluation of whether or not availability of water for hydraulic fracturing is an issue and, in the event water supply is an issue, how best to maximize wa- ter reuse and recycling for oil and gas hydraulic fractur- ing. The Natural Gas Subcommittee of the Secretary of Energy’s Advisory Board (SEAB) made other recom- mendations regarding the management of water resourc- es associated with hydraulic fracturing in November *Corresponding author. 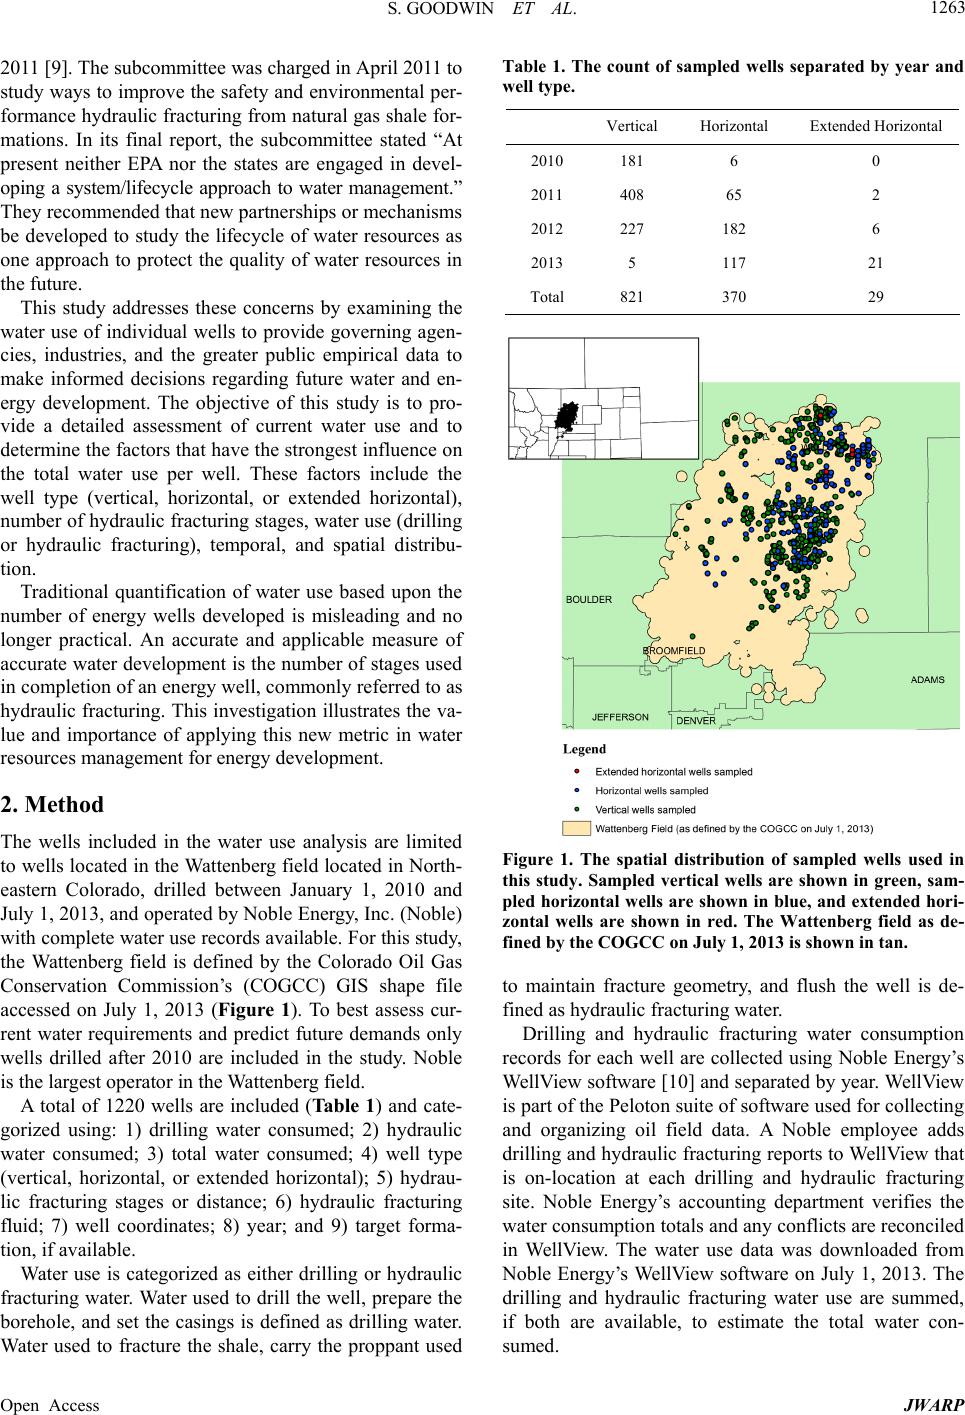 S. GOODWIN ET AL. 1263 2011 [9]. The subcommittee was charged in April 2011 to study ways to improve the safety and environmental per- formance hydraulic fracturing from natural gas shale for- mations. In its final report, the subcommittee stated “At present neither EPA nor the states are engaged in devel- oping a system/lifecycle approach to water management.” They recommended that new partnerships or mechanisms be developed to study the lifecycle of water resources as one approach to protect the quality of water resources in the future. This study addresses these concerns by examining the water use of individual wells to provide governing agen- cies, industries, and the greater public empirical data to make informed decisions regarding future water and en- ergy development. The objective of this study is to pro- vide a detailed assessment of current water use and to determine the factors that have the strongest influence on the total water use per well. These factors include the well type (vertical, horizontal, or extended horizontal), number of hydraulic fracturing stages, water use (drilling or hydraulic fracturing), temporal, and spatial distribu- tion. Traditional quantification of water use based upon the number of energy wells developed is misleading and no longer practical. An accurate and applicable measure of accurate water development is the number of stages used in completion of an energy well, commonly referred to as hydraulic fracturing. This investigation illustrates the va- lue and importance of applying this new metric in water resources management for energy development. 2. Method The wells included in the water use analysis are limited to wells located in the Wattenberg field located in North- eastern Colorado, drilled between January 1, 2010 and July 1, 2013, and operated by Noble Energy, Inc. (Noble) with complete water use records available. For this study, the Wattenberg field is defined by the Colorado Oil Gas Conservation Commission’s (COGCC) GIS shape file accessed on July 1, 2013 (Figure 1). To best assess cur- rent water requirements and predict future demands only wells drilled after 2010 are included in the study. Noble is the largest operator in the Wattenberg field. A total of 1220 wells are included (Tabl e 1) and cate- gorized using: 1) drilling water consumed; 2) hydraulic water consumed; 3) total water consumed; 4) well type (vertical, horizontal, or extended horizontal); 5) hydrau- lic fracturing stages or distance; 6) hydraulic fracturing fluid; 7) well coordinates; 8) year; and 9) target forma- tion, if available. Water use is categorized as either drilling or hydraulic fracturing water. Water used to drill the well, prepare the borehole, and set the casings is defined as drilling water. Water used to fracture the shale, carry the proppant used Table 1. The count of sampled wells separated by year and well type. Vertical Horizontal Extended Horizontal 2010 181 6 0 2011 408 65 2 2012 227 182 6 2013 5 117 21 Total 821 370 29 Figure 1. The spatial distribution of sampled wells used in this study. Sampled vertical wells are shown in green, sam- pled horizontal wells are shown in blue, and extended hori- zontal wells are shown in red. The Wattenberg field as de- fined by the COGCC on July 1, 2013 is shown in tan. to maintain fracture geometry, and flush the well is de- fined as hydraulic fracturing water. Drilling and hydraulic fracturing water consumption records for each well are collected using Noble Energy’s WellView software [10] and separated by year. WellView is part of the Peloton suite of software used for collecting and organizing oil field data. A Noble employee adds drilling and hydraulic fracturing reports to WellView that is on-location at each drilling and hydraulic fracturing site. Noble Energy’s accounting department verifies the water consumption totals and any conflicts are reconciled in WellView. The water use data was downloaded from Noble Energy’s WellView software on July 1, 2013. The drilling and hydraulic fracturing water use are summed, if both are available, to estimate the total water con- sumed. Open Access JWARP  S. GOODWIN ET AL. 1264 Wells are separated by type (vertical, horizontal, or extended horizontal) using Noble’s well naming system or the number of hydraulic fracturing stages, if available. Directional and deviated wells are categorized as vertical wells for this study because of similar water require- ments. Horizontal wells are separated from extended ho- rizontal wells by Noble’s well naming system or the number of hydraulic fracturing stages used when avail- able. A horizontal well will typically be hydraulically fractured in 20 stages. Recently, Noble has drilled and hydraulically fractured longer horizontal wells that can include over 40 stages to hydraulically fracture. Hori- zontal wells that require over 25 hydraulic fracturing stages are defined as extended horizontal wells in this study. The type of hydraulic fracturing fluid used and the number of hydraulic fracturing stages per well are col- lected from Noble Energy’s WellView software. The well coordinates, year, and target formation are all collected COGCC’s online facilities database. An Anderson-Darling test [11] is used to test the nor- mality of each subset of data. The difference between water use for each subset of data is tested using a non- parametric Kruskal-Wallis test. A Dunn-Šidák post-hoc comparison [12] is used to compare any differences be- tween samples that are found using the Kruskal-Wallis test. A 95% confidence interval is used throughout the analysis. The number of hydraulic fracturing stages is correlated using a simple linear regression. A coefficient of determination is used to measure how well the regres- sion correlates the hydraulic fracturing water use and the number of stages. Spatial autocorrelations are measured with ArcGIS Spatial Analyst tool [13] using Moran’s I with inverse distance weighting and a 95% confidence interval. 1220 wells have both drilling and hydraulic fracturing water and are included in the study. Wells that are drilled but not hydraulically fractured (260 sampled wells) are typically conventional wells recovering from an oil and gas trap. Wells that are hydraulically fractured but not drilled (25 sampled wells) are typically existing wells that are reworked or restimulated using hydraulic frac- turing. 3. Results A Kruskal-Wallis test reveals there is a significant dif- ference between the median total water use for vertical, horizontal, and extended horizontal wells (χ2(2) = 622, p < 0.05). Dunn-Šidák post-hoc comparisons of the total water for the three well groups indicates that vertical wells (Mdn = 360,000) use significantly less total water than either horizontal (Mdn = 2,871,000) or extended horizontal wells (Mdn = 5,620,000), as shown in Figure 2 and Table 2. Vertical wells also use significantly Table 2. Descriptive statistics for total water use separated by well type. Total (Million Gallons)Vertical Horizontal Extended Horizontal Q1 332,900 2,600,000 3,721,000 Q2 360,000 2,871,000 5,620,000 Q3 461,900 3,108,000 6,830,000 IQR 129,000 510,100 3,109,000 Skewness 9.1 4.6 −0.44 Kurtosis 99 54 −1.3 Figure 2. A histogram of the distribution of drilling and hy- draulic fracturing water use for vertical, horizontal, and extended horizontal wells. Vertical we lls are shown in green, horizontal wells are shown in blue, and extende d horizontal wells are show n in red. less water than horizontal wells. The total water use for each well type does not show significant temporal (Figure 3) or spatial variation (Fig- ure 4) within the Wattenberg field. Only vertical wells show any significant spatial autocorrelation (I = 0.66, p < 0.05). The significant clusters for vertical wells appear to be randomly distributed throughout the Wattenberg field and do not present an obvious trend in water use spatially. Horizontal (I = 0.53, p = 0.60) and extended horizontal (I = −0.082, p = 0.70) wells do not show any significant spatial autocorrelation. The type of hydraulic fracturing fluid used signifi- cantly influences vertical wells. The normalized hydrau- lic fracturing water use is significantly less for gelled fractures (Mdn = 544 gallons per foot) than slickwater fractures (Mdn = 1340 gallons per foot) for vertical wells (χ2(1) = 42.4, p < 0.05). Horizontal wells do not have enough slickwater data to compare gelled and slickwater hydraulic fracturing water use. The majority of the water used for each well is used for hydraulic fracturing. Vertical wells use a median of 81% (Q1 = 77%, Q3 = 85%) of the total water for hy- draulic fracturing. Horizontal and extended horizontal Open Access JWARP  S. GOODWIN ET AL. 1265 Figure 3. The water use for vertical wells and horizontal wells separated by year. The 25th and 75th percentiles are represented with a blue box, the 50th percentile is repre- sented with a red line, the 10th and 90th percentiles are represented with black lines, and the outliers are repre- sented with red plus signs. Figure 4. The total water use is separated into quartiles with the lightest shade representing the first quartile (least water use) of the total water use and the darkest shade rep- resenting the fourth quartile (most water use). Vertical wells are shown in blue, horizontal wells are shown in green, and extended horizontal wells are show n in red. wells use a median value of 96% (Q1 = 95%, Q3 = 97%) and 97% (Q1 = 97%, Q3 = 98%) for hydraulic fracturing, respectively, as shown in Table 3. There is a significant difference between the median drilling water use across the three well types (χ2(2) = 387.24, p < 0.05). Vertical wells use significantly less total water than either horizontal or extended horizontal wells and horizontal wells use significantly less water than extended horizontal wells (Figure 5). Vertical wells use the least water (Mdn = 74,760) followed by horizon- tal wells (Mdn = 116,300), and extended horizontal wells (Mdn = 180,800). There is also a significant difference between the me- dian hydraulic fracturing water use across the three well types (χ2(2) = 619.71, p < 0.05). Vertical wells use sig- nificantly less hydraulic fracturing water than either hori- zontal or extended horizontal wells and there is not a sig- nificant difference between the total water use between horizontal and extended horizontal wells. Vertical wells use the least water (Mdn = 278,900) followed by hori- zontal wells (Mdn = 2,792,000), and extended horizontal wells (Mdn = 6,517,000). The total water use for horizontal and extended hori- zontal wells correlates (r2 = 0.64) with the number of stages used to hydraulically fracture each well (Figure 6). Wells defined as horizontal wells (less than 25 stages) are shown in blue region and the wells defined as extended horizontal wells are shown in the red region. A linear regression using a least-square linear fit is also shown. When the total water use is normalized by the number of hydraulic fracturing stages, the water use for horizon- tal and extended horizontal is not statistically different (χ2(1) = 2.85, p < 0.05). The distribution is also similar for horizontal and extended horizontal wells (Figure 7). Vertical wells do not show any correlation between the total water use (r2 = 0.081) or hydraulic fracturing water use (r2 = 0.073). 4. Discussion The most important factors with estimating the total wa- ter use for a well are the well type and the number of hydraulic fracturing stages. Vertical wells use signifi- cantly less water than horizontal wells. The water total water use for vertical wells remains relatively constant. However, the total water use for horizontal wells can vary from a few hundred thousand gallons up to nearly eight million gallons per well. Accounting for the number of hydraulic fracturing stages used can reduce the vari- ability in the total water use for horizontal wells. The ma- jority of the total water use per well is used for hydraulic fracturing. When the number of hydraulic fracturing stag- es normalizes the total water use, the water use is similar for all of the horizontal wells. Open Access JWARP 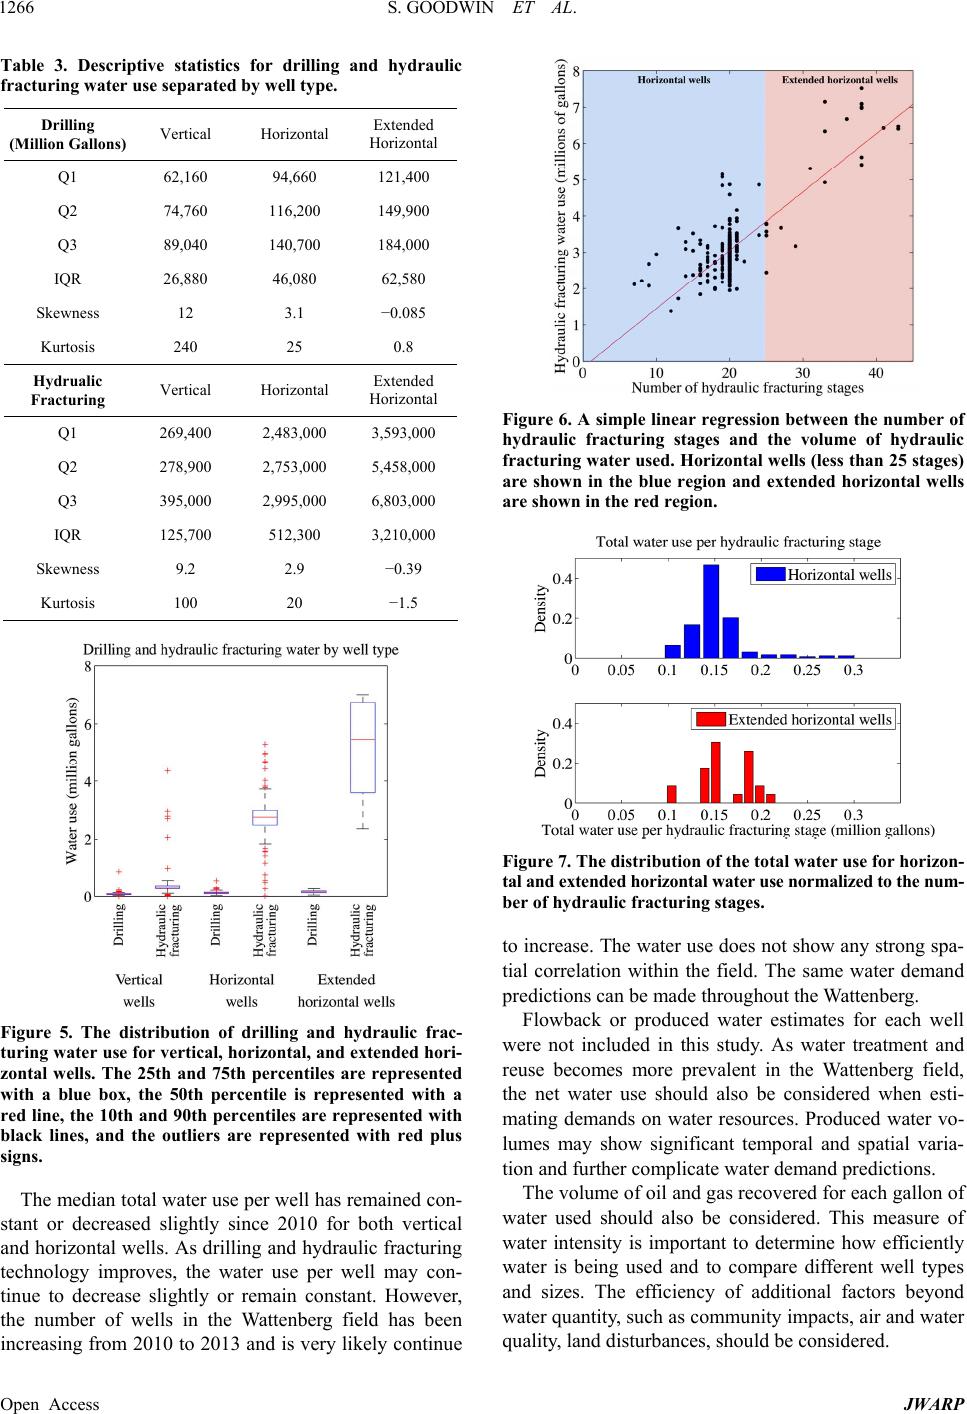 S. GOODWIN ET AL. 1266 Table 3. Descriptive statistics for drilling and hydraulic fracturing water use separated by well type. Drilling (Million Gallons) Vertical Horizontal Extended Horizontal Q1 62,160 94,660 121,400 Q2 74,760 116,200 149,900 Q3 89,040 140,700 184,000 IQR 26,880 46,080 62,580 Skewness 12 3.1 −0.085 Kurtosis 240 25 0.8 Hydrualic Fracturing Vertical Horizontal Extended Horizontal Q1 269,400 2,483,000 3,593,000 Q2 278,900 2,753,000 5,458,000 Q3 395,000 2,995,000 6,803,000 IQR 125,700 512,300 3,210,000 Skewness 9.2 2.9 −0.39 Kurtosis 100 20 −1.5 Figure 5. The distribution of drilling and hydraulic frac- turing water use for vertic al, horizontal, and extended hori - zontal wells. The 25th and 75th percentiles are represented with a blue box, the 50th percentile is represented with a red line, the 10th and 90th percentiles are represented with black lines, and the outliers are represented with red plus signs. The median total water use per well has remained con- stant or decreased slightly since 2010 for both vertical and horizontal wells. As drilling and hydraulic fracturing technology improves, the water use per well may con- tinue to decrease slightly or remain constant. However, the number of wells in the Wattenberg field has been increasing from 2010 to 2013 and is very likely continue Figure 6. A simple linear regression between the number of hydraulic fracturing stages and the volume of hydraulic fracturing water used. Horizontal wells (less than 25 stages) are shown in the blue region and extended horizontal wells are shown in the red region. Figure 7. The distribution of the total water use for horizon- tal and extended horizontal water use normalized to the num- ber of hydraulic fracturing stages. to increase. The water use does not show any strong spa- tial correlation within the field. The same water demand predictions can be made throughout the Wattenberg. Flowback or produced water estimates for each well were not included in this study. As water treatment and reuse becomes more prevalent in the Wattenberg field, the net water use should also be considered when esti- mating demands on water resources. Produced water vo- lumes may show significant temporal and spatial varia- tion and further complicate water demand predictions. The volume of oil and gas recovered for each gallon of water used should also be considered. This measure of water intensity is important to determine how efficiently water is being used and to compare different well types and sizes. The efficiency of additional factors beyond water quantity, such as community impacts, air and water quality, land disturbances, should be considered. Open Access JWARP 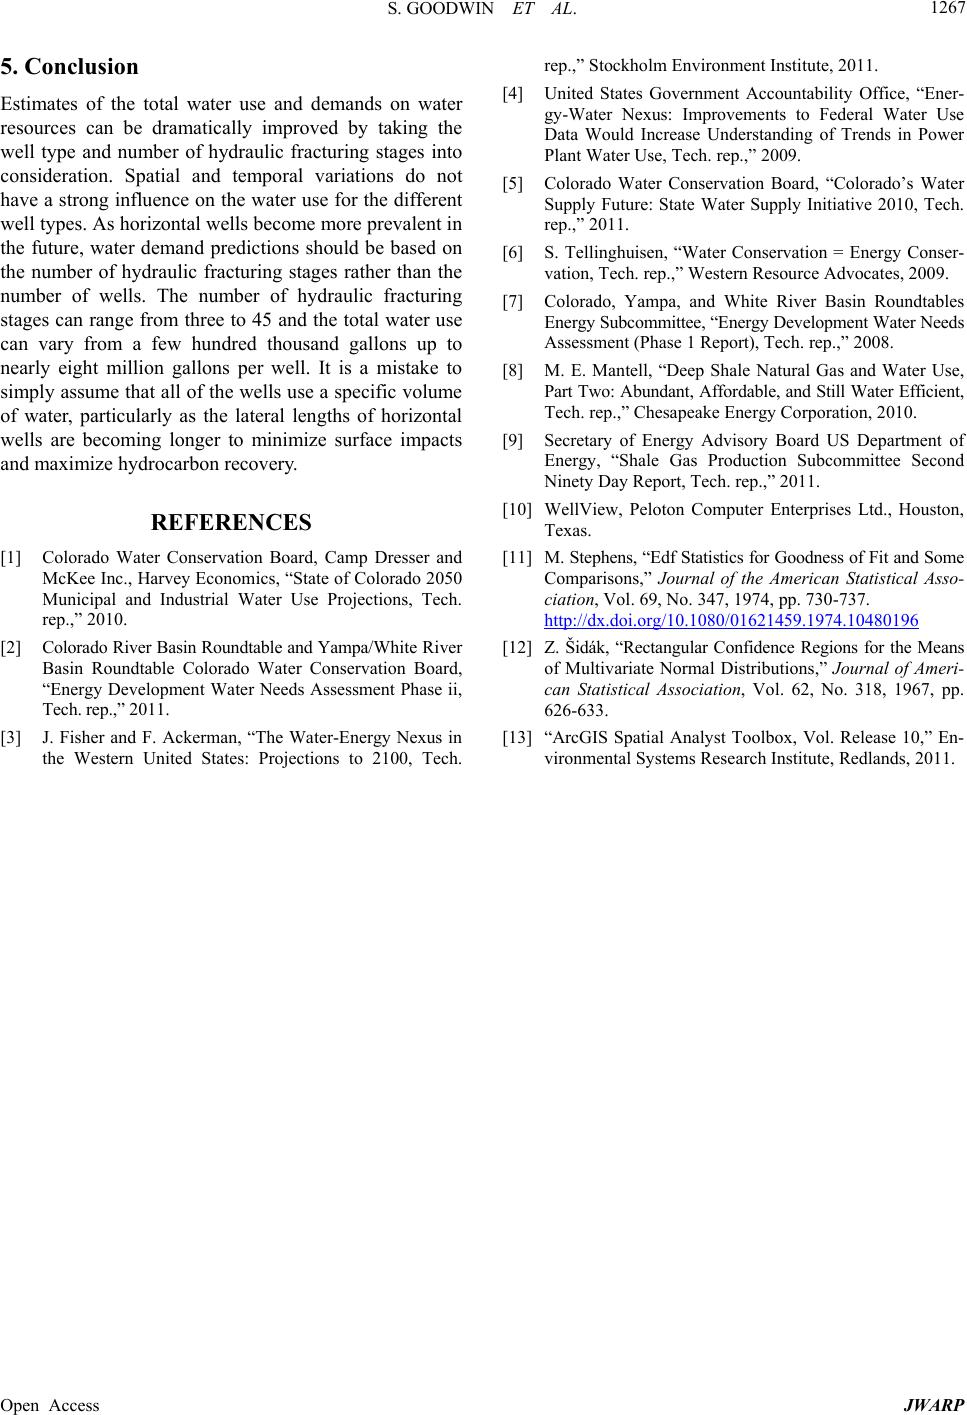 S. GOODWIN ET AL. Open Access JWARP 1267 5. Conclusion Estimates of the total water use and demands on water resources can be dramatically improved by taking the well type and number of hydraulic fracturing stages into consideration. Spatial and temporal variations do not have a strong influence on the water use for the different well types. As horizontal wells become more prevalent in the future, water demand predictions should be based on the number of hydraulic fracturing stages rather than the number of wells. The number of hydraulic fracturing stages can range from three to 45 and the total water use can vary from a few hundred thousand gallons up to nearly eight million gallons per well. It is a mistake to simply assume that all of the wells use a specific volume of water, particularly as the lateral lengths of horizontal wells are becoming longer to minimize surface impacts and maximize hydrocarbon recovery. REFERENCES [1] Colorado Water Conservation Board, Camp Dresser and McKee Inc., Harvey Economics, “State of Colorado 2050 Municipal and Industrial Water Use Projections, Tech. rep.,” 2010. [2] Colorado River Basin Roundtable and Yampa/White River Basin Roundtable Colorado Water Conservation Board, “Energy Development Water Needs Assessment Phase ii, Tech. rep.,” 2011. [3] J. Fisher and F. Ackerman, “The Water-Energy Nexus in the Western United States: Projections to 2100, Tech. rep.,” Stockholm Environment Institute, 2011. [4] United States Government Accountability Office, “Ener- gy-Water Nexus: Improvements to Federal Water Use Data Would Increase Understanding of Trends in Power Plant Water Use, Tech. rep.,” 2009. [5] Colorado Water Conservation Board, “Colorado’s Water Supply Future: State Water Supply Initiative 2010, Tech. rep.,” 2011. [6] S. Tellinghuisen, “Water Conservation = Energy Conser- vation, Tech. rep.,” Western Resource Advocates, 2009. [7] Colorado, Yampa, and White River Basin Roundtables Energy Subcommittee, “Energy Development Water Needs Assessment (Phase 1 Report), Tech. rep.,” 2008. [8] M. E. Mantell, “Deep Shale Natural Gas and Water Use, Part Two: Abundant, Affordable, and Still Water Efficient, Tech. rep.,” Chesapeake Energy Corporation, 2010. [9] Secretary of Energy Advisory Board US Department of Energy, “Shale Gas Production Subcommittee Second Ninety Day Report, Tech. rep.,” 2011. [10] WellView, Peloton Computer Enterprises Ltd., Houston, Texas. [11] M. Stephens, “Edf Statistics for Goodness of Fit and Some Comparisons,” Journal of the American Statistical Asso- ciation, Vol. 69, No. 347, 1974, pp. 730-737. http://dx.doi.org/10.1080/01621459.1974.10480196 [12] Z. Šidák, “Rectangular Confidence Regions for the Means of Multivariate Normal Distributions,” Journal of Ameri- can Statistical Association, Vol. 62, No. 318, 1967, pp. 626-633. [13] “ArcGIS Spatial Analyst Toolbox, Vol. Release 10,” En- vironmental Systems Research Institute, Redlands, 2011. |