

Paper Menu >>
Journal Menu >>
 Journal of Environmental Protection, 2013, 4, 33-40 Published Online December 2013 (http://www.scirp.org/journal/jep) http://dx.doi.org/10.4236/jep.2013.412A1004 Open Access JEP Decline of VOC Concentrations with the Aging of Houses in Japan Motoya Hayashi1, Haruki Osawa2 1Department of Life Style and Space Design, Miyagi Gakuin Women’s University, Sendai, Japan; 2Department of Healthy Building and Housing, National Institute of Public Health, Wako, Japan. Email: [email protected].jp, [email protected] Received September 8th, 2013; revised October 12th, 2013; accepted November 7th, 2013 Copyright © 2013 Motoya Hayashi, Haruki Osawa. This is an open access article distributed under the Creative Commons Attribu- tion License, which permits unrestricted use, distribution, and reproduction in any medium, provided the original work is properly cited. In accordance of the Creative Commons Attribution License all Copyrights © 2013 are reserved for SCIRP and the owner of the intellectual property Motoya Hayashi, Haruki Osawa. All Copyright © 2013 are guarded by law and by SCIRP as a guardian. ABSTRACT The purpose of this investig ation is to know the long-term characteristics of VOC concentrations in houses bu ilt before the building code in 2003 and to clarify th e coun termeasures against indoor air po llution in the houses already built. For example, the improvements of living habits, ventilation and the remove of building materials. The concentrations of VOCs were measured in these houses in summer and winter from 2000 to 2005. The results showed that the concentra- tion of formaldehyde decreased in the first year. After that the decline of the concentration was not seen and the con- centration chang ed only with the temperature. The characteristics of decline were thought to be caused by two sorts of emission. One is an emission of concealed formaldehyde in the process of material production and the other is an emis- sion with the generation of formaldehyde from adhesives of urea resin and moisture. The concentration of toluene de- creased rapidly in the first year. The concentrations of xylene, ethyl-benzene and styrene showed a similar change. But the concentrations of acetaldehyde which were measured from the summer of 2002 did not decrease and its concentra- tion in some houses was higher than the guideline even in the winter of 2005. Keywords: Indoor Air Quality; VOC; Passive Sampling; Questionnaire Survey; Statistics Analysis 1. Introduction A traditional Japanese house has a structure of wooden posts and beams. Houses with this structure have wide openings. Therefore the traditional house is beneficial to indoor cooling in summer and to the prevention of the deterioration of wooden materials. Also there are many air infiltration routes through the wall, floor, ceiling, etc. Since 1970s, the structures have been improved to be airtight and insulated using insulation materials and films. However, many infiltration routes lurk in the concealed spaces like spaces inside the walls, the ceilings and the floors [1]. The living style of Japanese dwellers has changed in the sixty years after World War 2. The unoccupied time in houses became longer, because the number of family became smaller. And the time of opening windows be- came shorter with the spread of air conditioner. New building materials have been produced in factories since 1960s, and prefabricated houses have expanded in Japan since 1970s. Under these situations, “sick house”: the indoor air pollution by chemical compounds from build- ing materials, has been closed up in Japan since 1990s. And many countermeasures against indoor air pollution in houses have been taken by the Japanese government, building companies, building material manufacturers and other related groups. And a new building code with countermeasures against indoor air pollution has been forced by the Ministry of Land, Infrastructure and Transport since 2003. According to this building code the concentration of formaldehyde is expected to be lower than the guideline: 0.08 ppm, which was established by the Ministry of Health, Labour and Welfare of Japanese Government in 1993. This building code requires our consideration about the emission rate of formaldehyde from building materials. The regulated materials are not only building materials which are used for interior finish but also materials which are concealed in walls, ceilings and floors. And the installation of ventilation equipment 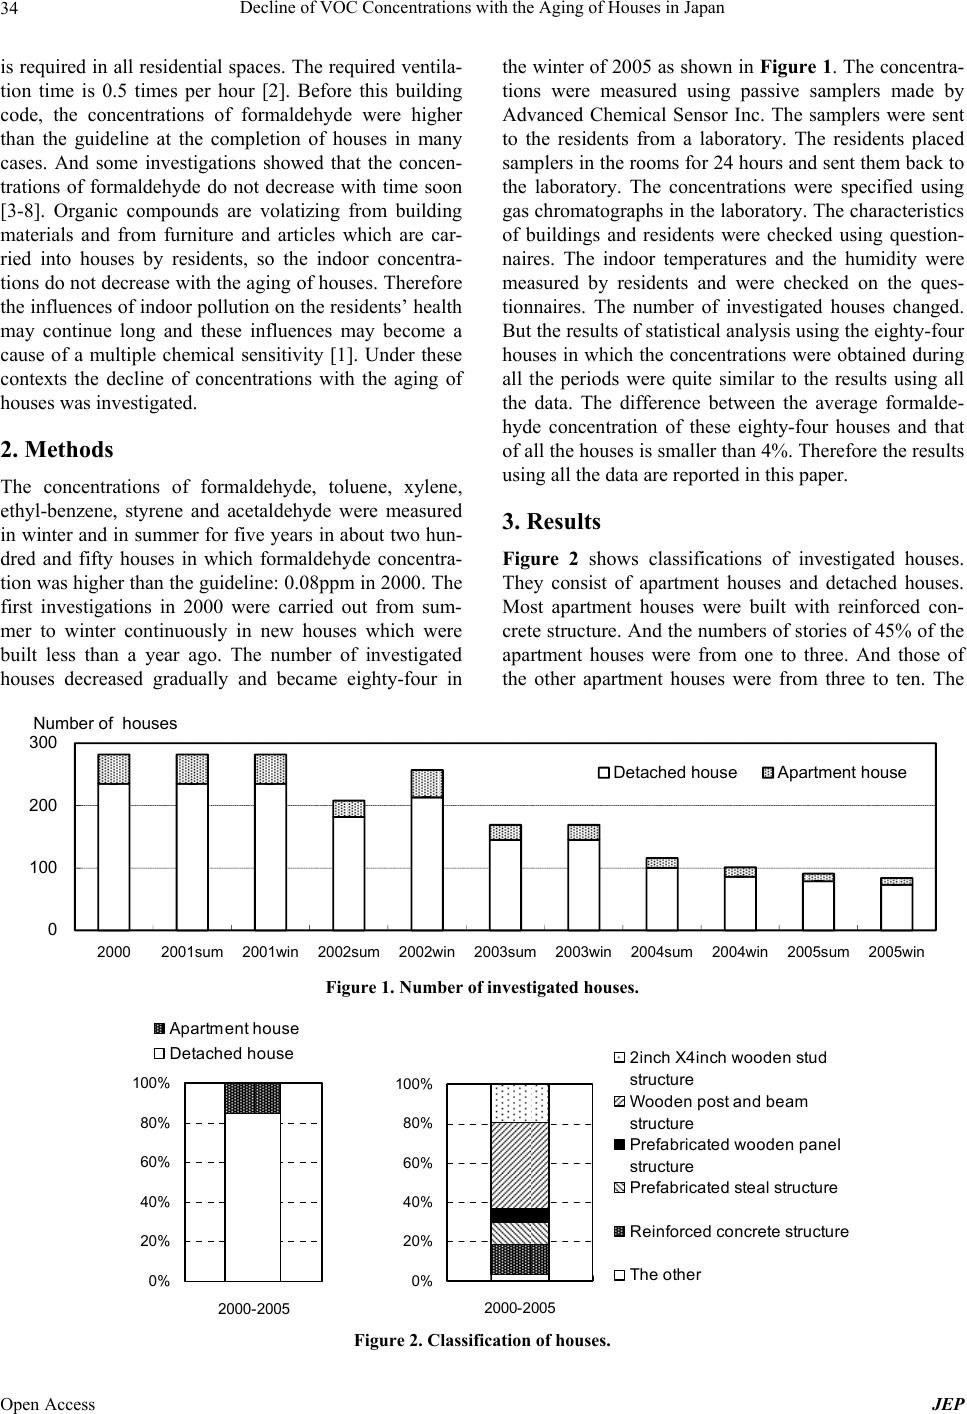 Decline of VOC Concentrations with the Aging of Houses in Japan 34 is required in all residential spaces. The required ventila- tion time is 0.5 times per hour [2]. Before this building code, the concentrations of formaldehyde were higher than the guideline at the completion of houses in many cases. And some investigations showed that the concen- trations of formaldehyde do not decrease with time soon [3-8]. Organic compounds are volatizing from building materials and from furniture and articles which are car- ried into houses by residents, so the indoor concentra- tions do not decrease with the aging of houses. Therefore the influences of indoor pollution on the residents’ health may continue long and these influences may become a cause of a multiple chemical sensitivity [1]. Under these contexts the decline of concentrations with the aging of houses was investigated. 2. Methods The concentrations of formaldehyde, toluene, xylene, ethyl-benzene, styrene and acetaldehyde were measured in winter and in summer for five years in about two hun- dred and fifty houses in which formaldehyde concentra- tion was higher than the guideline: 0.08ppm in 2000. The first investigations in 2000 were carried out from sum- mer to winter continuously in new houses which were built less than a year ago. The number of investigated houses decreased gradually and became eighty-four in the winter of 2005 as shown in Figure 1. The concentra- tions were measured using passive samplers made by Advanced Chemical Sensor Inc. The samplers were sent to the residents from a laboratory. The residents placed samplers in the rooms for 24 hours and sent them back to the laboratory. The concentrations were specified using gas chromatographs in the laboratory. The characteristics of buildings and residents were checked using question- naires. The indoor temperatures and the humidity were measured by residents and were checked on the ques- tionnaires. The number of investigated houses changed. But the results of statistical analysis using the eig hty-four houses in which the concentrations were obtained during all the periods were quite similar to the results using all the data. The difference between the average formalde- hyde concentration of these eighty-four houses and that of all the houses is smaller than 4%. Th erefore the resu lts using all the data are reported in this paper. 3. Results Figure 2 shows classifications of investigated houses. They consist of apartment houses and detached houses. Most apartment houses were built with reinforced con- crete structure. And the numbers of stories of 45% of the apartment houses were from one to three. And those of the other apartment houses were from three to ten. The 0 100 200 300 20002001sum 2001win 2002sum 2002win 2003sum 2003win 2004sum 2004win 2005sum 2005win Number of houses Detached houseApartment house Figure 1. Number of investigated houses. 0% 20% 40% 60% 80% 100% 2000-2005 A partment house Detached house 0% 20% 40% 60% 80% 100% 2000-2005 2inch X4inch wooden stud structu re Wooden post and beam structu re Prefabricated wooden panel structu re Prefabricated steal structure Reinforced concrete structure The other Figure 2. Classification of houses. Open Access JEP 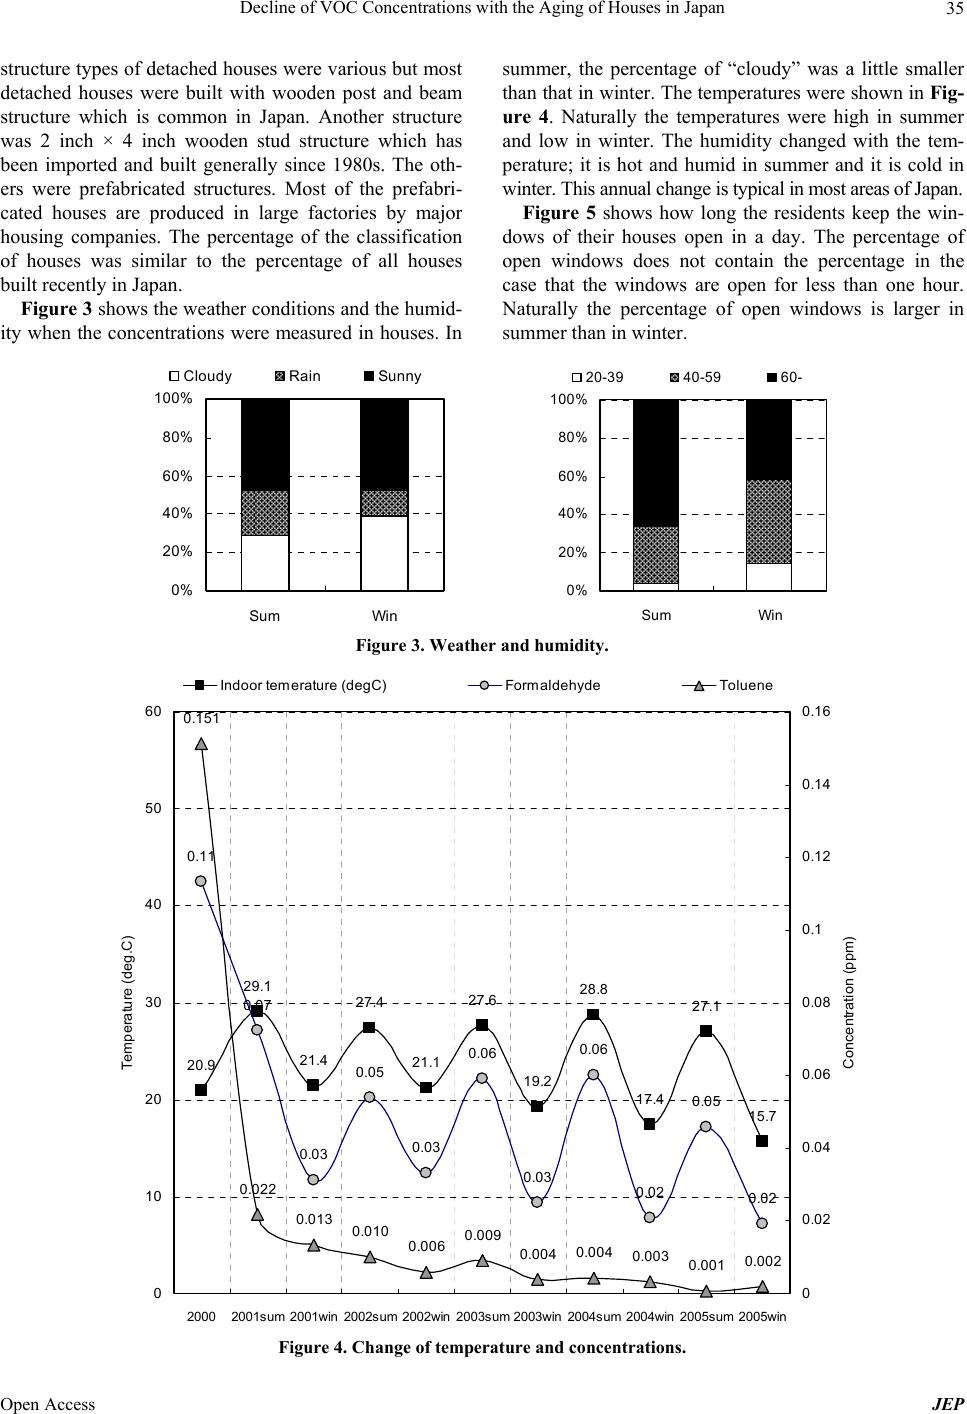 Decline of VOC Concentrations with the Aging of Houses in Japan 35 structure types of detached houses were various but most detached houses were built with wooden post and beam structure which is common in Japan. Another structure was 2 inch × 4 inch wooden stud structure which has been imported and built generally since 1980s. The oth- ers were prefabricated structures. Most of the prefabri- cated houses are produced in large factories by major housing companies. The percentage of the classification of houses was similar to the percentage of all houses built recently in Jap an. Figure 3 shows the weather conditions an d the humid- ity when the concentrations were measured in houses. In summer, the percentage of “cloudy” was a little smaller than that in winter. The temperatures were shown in Fig- ure 4. Naturally the temperatures were high in summer and low in winter. The humidity changed with the tem- perature; it is hot and humid in summer and it is cold in winter. This annual change is typic al in m ost a reas of Japa n. Figure 5 shows how long the residents keep the win- dows of their houses open in a day. The percentage of open windows does not contain the percentage in the case that the windows are open for less than one hour. Naturally the percentage of open windows is larger in summer than in winter. 0% 20% 40% 60% 80% 100% Sum Win Cloudy Rain Sunny 0% 20% 40% 60% 80% 100% Sum Win 20-39 40-5960- Figure 3. Weather and humidity. 20.9 29.1 21.4 27.4 21.1 27.6 19.2 28.8 17.4 27.1 15.7 0.11 0.07 0.03 0.05 0.03 0.06 0.03 0.06 0.02 0.05 0.02 0.151 0.022 0.0130.010 0.006 0.009 0.0040.0040.003 0.001 0.002 0 10 20 30 40 50 60 20002001sum2001win 2002sum2002win 2003sum2003win 2004sum2004win 2005sum2005win Temperature (deg.C) 0 0.02 0.04 0.06 0.08 0.1 0.12 0.14 0.16 Concentration (ppm) Indoor temerature (degC)FormaldehydeToluene Figure 4. Change of temperature and concentrations. Open Access JEP 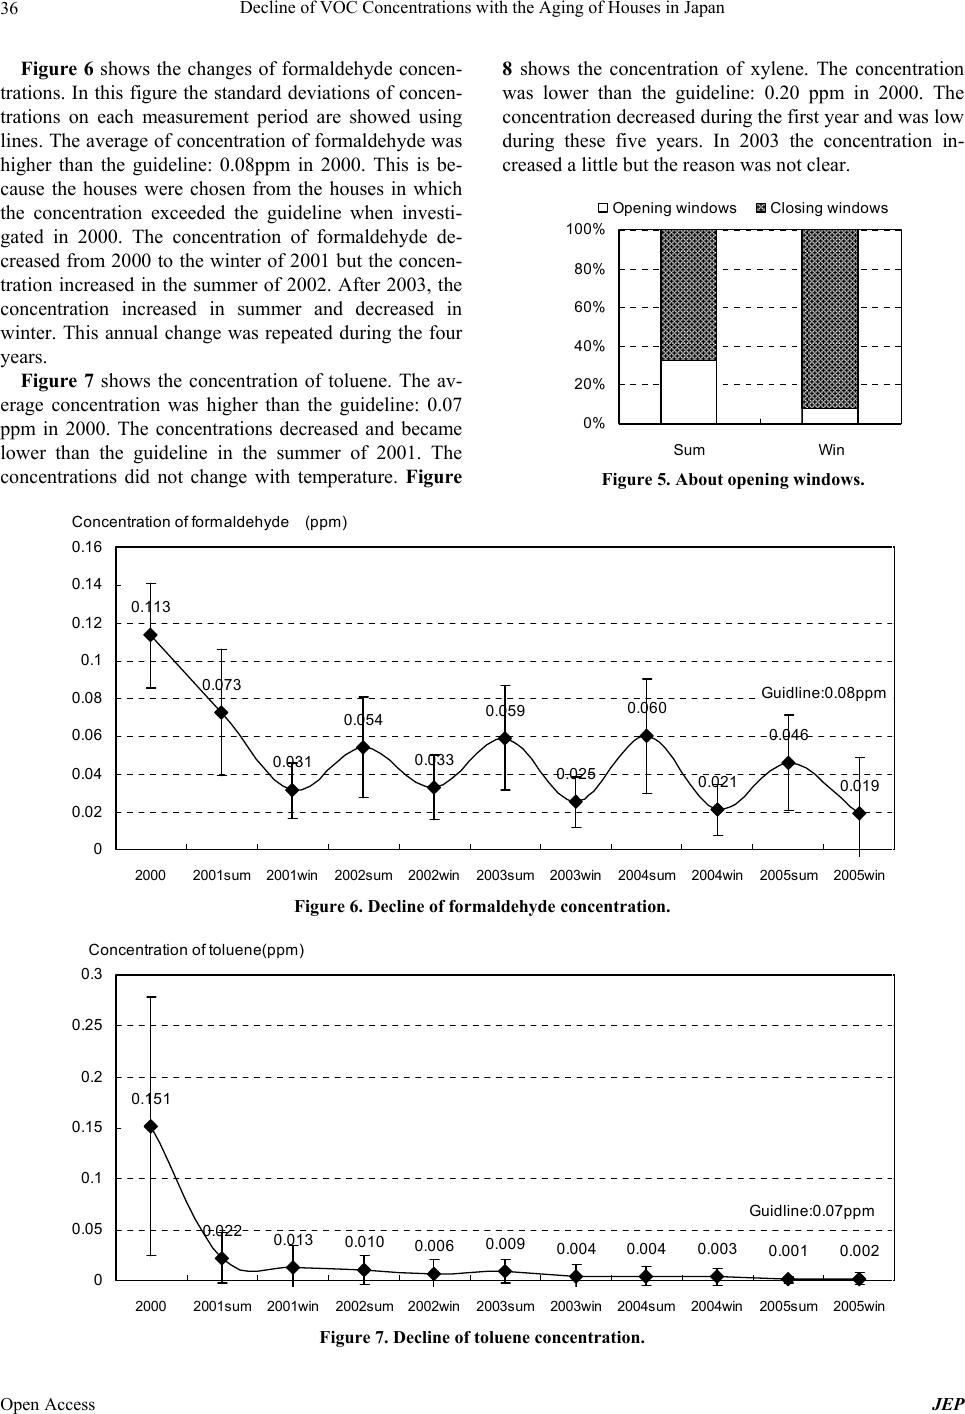 Decline of VOC Concentrations with the Aging of Houses in Japan 36 Figure 6 shows the changes of formaldehyde concen- trations. In this figure the standard deviations of concen- trations on each measurement period are showed using lines. The average of concentration of formaldehyde was higher than the guideline: 0.08ppm in 2000. This is be- cause the houses were chosen from the houses in which the concentration exceeded the guideline when investi- gated in 2000. The concentration of formaldehyde de- creased from 2000 to the winter of 2001 but the concen- tration increased in the summer of 2002. After 2003, the concentration increased in summer and decreased in winter. This annual change was repeated during the four years. Figure 7 shows the concentration of toluene. The av- erage concentration was higher than the guideline: 0.07 ppm in 2000. The concentrations decreased and became lower than the guideline in the summer of 2001. The concentrations did not change with temperature. Figure 8 shows the concentration of xylene. The concentration was lower than the guideline: 0.20 ppm in 2000. The concentration decreased during the first year and was low during these five years. In 2003 the concentration in- creased a little but the reason was not clear. 0% 20% 40% 60% 80% 100% Sum Win Opening windowsClosing windows Figure 5. About opening windows. Concentration of formaldehyde (ppm) 0.113 0.073 0.031 0.054 0.033 0.059 0.025 0.060 0.021 0.046 0.019 0 0.02 0.04 0.06 0.08 0.1 0.12 0.14 0.16 20002001sum2001win 2002sum2002win 2003sum2003win 2004sum2004win 2005sum 2005win Guidline:0.08ppm Figure 6. Decline of formaldehyde concentration. Concentration of toluene(ppm) 0.151 0.022 0.013 0.010 0.006 0.009 0.004 0.0040.0030.001 0.002 0 0.05 0.1 0.15 0.2 0.25 0.3 20002001sum 2001win2002sum2002win2003sum 2003win 2004sum 2004win2005sum 2005win Guidline:0.07ppm Figure 7. Decline of toluene concentration. Open Access JEP 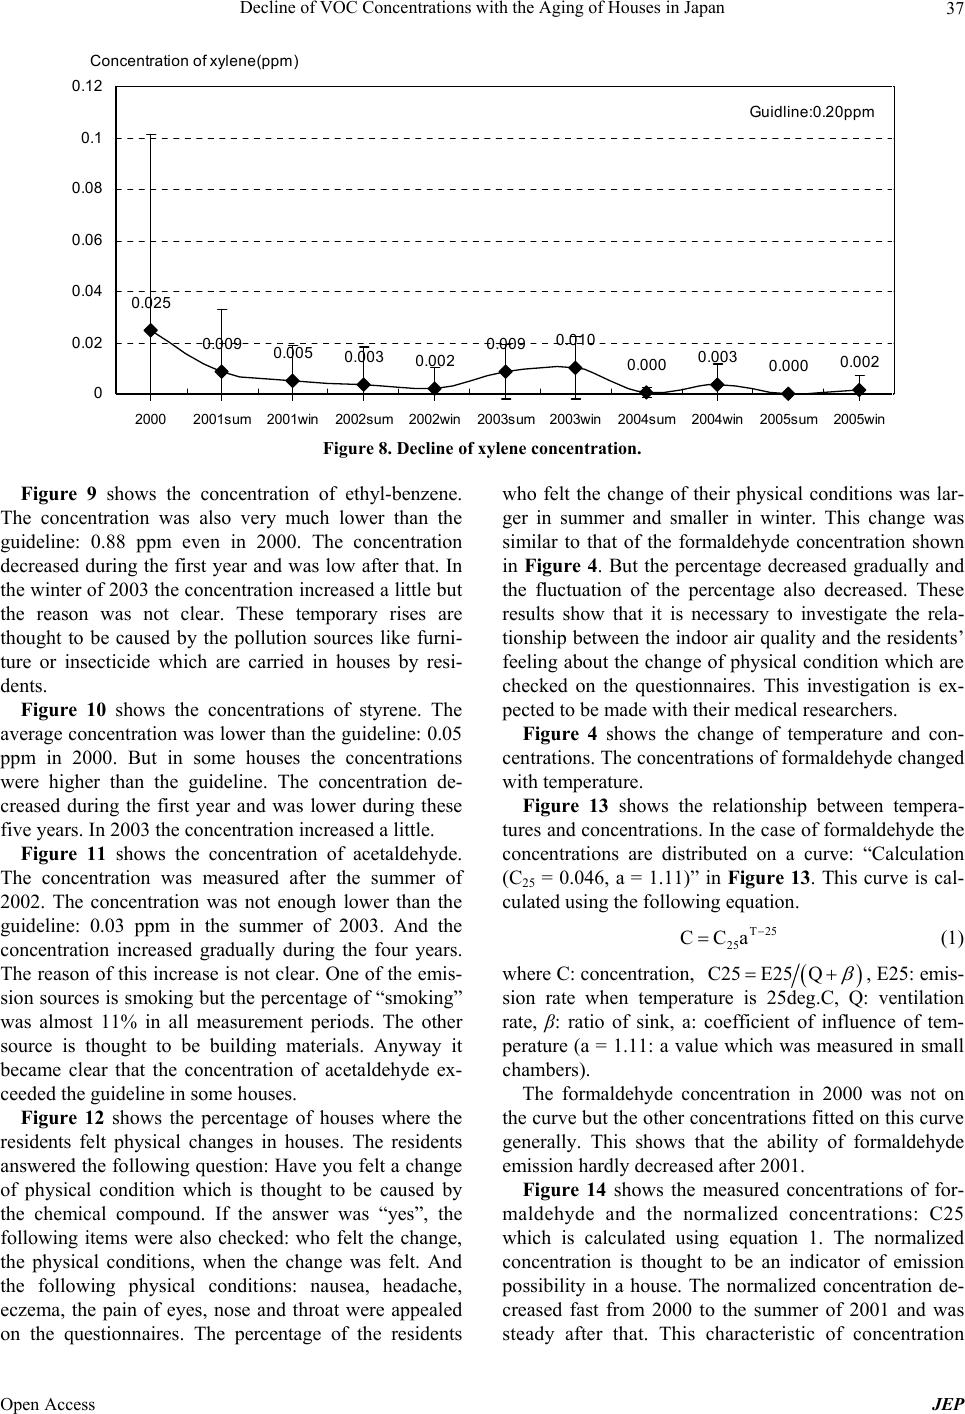 Decline of VOC Concentrations with the Aging of Houses in Japan 37 Concentration of xylene(ppm) 0.025 0.009 0.005 0.0030.002 0.009 0.010 0.000 0.003 0.000 0.002 0 0.02 0.04 0.06 0.08 0.1 0.12 2000 2001su m 2001win 2002sum2002win 2003sum2003win 2004su m 2004win2005sum 2005win Guidline:0.20ppm Figure 8. Decline of xylene concentration. Figure 9 shows the concentration of ethyl-benzene. The concentration was also very much lower than the guideline: 0.88 ppm even in 2000. The concentration decreased during the first year and was low after that. In the winter of 2003 the concentratio n increased a little bu t the reason was not clear. These temporary rises are thought to be caused by the pollution sources like furni- ture or insecticide which are carried in houses by resi- dents. Figure 10 shows the concentrations of styrene. The average concen tration was lower than the guideline: 0.05 ppm in 2000. But in some houses the concentrations were higher than the guideline. The concentration de- creased during the first year and was lower during these five years. In 2003 the concentration increased a little. Figure 11 shows the concentration of acetaldehyde. The concentration was measured after the summer of 2002. The concentration was not enough lower than the guideline: 0.03 ppm in the summer of 2003. And the concentration increased gradually during the four years. The reason of this increase is not clear. One of the emis- sion sources is smoking but the percentage of “smoking” was almost 11% in all measurement periods. The other source is thought to be building materials. Anyway it became clear that the concentration of acetaldehyde ex- ceeded the guideline in some houses. Figure 12 shows the percentage of houses where the residents felt physical changes in houses. The residents answered the following question: Have you felt a change of physical condition which is thought to be caused by the chemical compound. If the answer was “yes”, the following items were also checked: who felt the change, the physical conditions, when the change was felt. And the following physical conditions: nausea, headache, eczema, the pain of eyes, nose and throat were appealed on the questionnaires. The percentage of the residents who felt the change of their physical conditions was lar- ger in summer and smaller in winter. This change was similar to that of the formaldehyde concentration shown in Figure 4. But the percentage decreased gradually and the fluctuation of the percentage also decreased. These results show that it is necessary to investigate the rela- tionship between the indoor air qu ality and the residents’ feeling about the change of physical condition which are checked on the questionnaires. This investigation is ex- pected to be made with their medical researchers. Figure 4 shows the change of temperature and con- centrations. The concentrations of formaldehyde changed with temperature. Figure 13 shows the relationship between tempera- tures and concentrations. In the case of formaldehyde the concentrations are distributed on a curve: “Calculation (C25 = 0.046, a = 1.11)” in Figure 13. This curve is cal- culated using the following equation. T25 25 CCa (1) where C: concentration, C25E25 Q , E25: emis- sion rate when temperature is 25deg.C, Q: ventilation rate, β: ratio of sink, a: coefficient of influence of tem- perature (a = 1.11: a value which was measured in small chambers). The formaldehyde concentration in 2000 was not on the curve but the other co ncentrations fitted o n this curve generally. This shows that the ability of formaldehyde emission hardly decreased after 2001. Figure 14 shows the measured concentrations of for- maldehyde and the normalized concentrations: C25 which is calculated using equation 1. The normalized concentration is thought to be an indicator of emission possibility in a house. The normalized concentration de- creased fast from 2000 to the summer of 2001 and was steady after that. This charcteristic of concentration a Open Access JEP 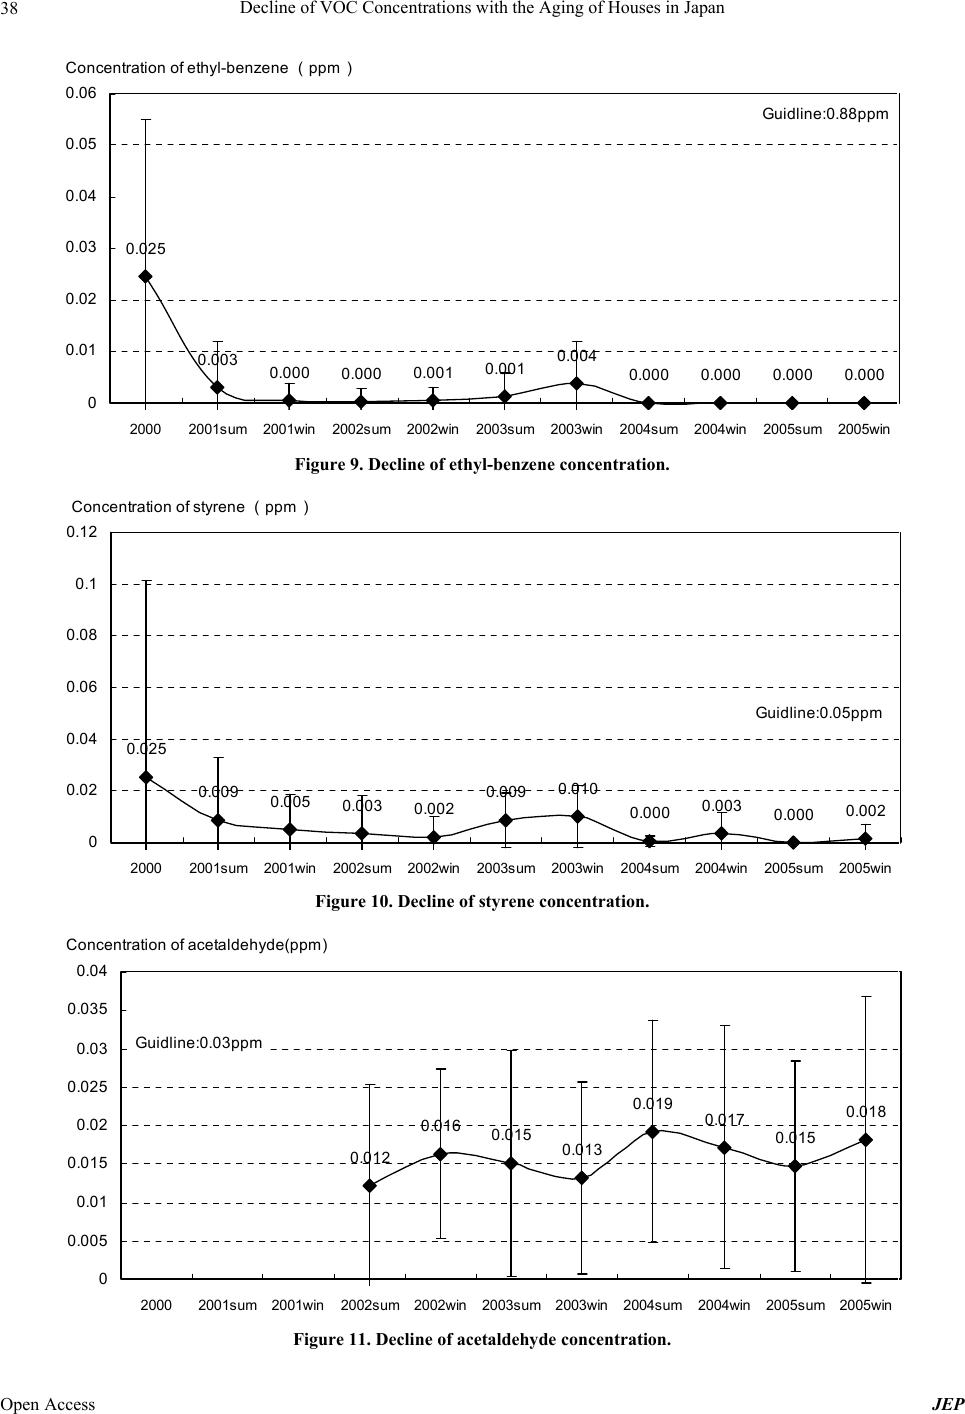 Decline of VOC Concentrations with the Aging of Houses in Japan 38 Concentration of ethyl-benzene (ppm) 0.025 0.003 0.000 0.000 0.001 0.001 0.004 0.000 0.000 0.000 0.000 0 0.01 0.02 0.03 0.04 0.05 0.06 20002001sum 2001win2002sum 2002win2003sum 2003win2004sum 2004win2005sum 2005win Guidline:0.88ppm Figure 9. Decline of ethyl-benzene concentration. Concentration of styrene (ppm) 0.025 0.009 0.005 0.003 0.002 0.009 0.010 0.000 0.003 0.000 0.002 0 0.02 0.04 0.06 0.08 0.1 0.12 20002001sum 2001win2002sum 2002win2003sum 2003win2004sum 2004win2005sum 2005win Guidline:0.05ppm Figure 10. Decline of styrene concentration. Concentration of acetaldehyde(ppm) 0.012 0.016 0.015 0.013 0.019 0.017 0.015 0.018 0 0.005 0.01 0.015 0.02 0.025 0.03 0.035 0.04 20002001sum 2001win2002sum 2002win2003sum 2003win2004sum2004win2005sum 2005win Guidline:0.03ppm Figure 11. Decline of acetaldehyde concentration. Open Access JEP 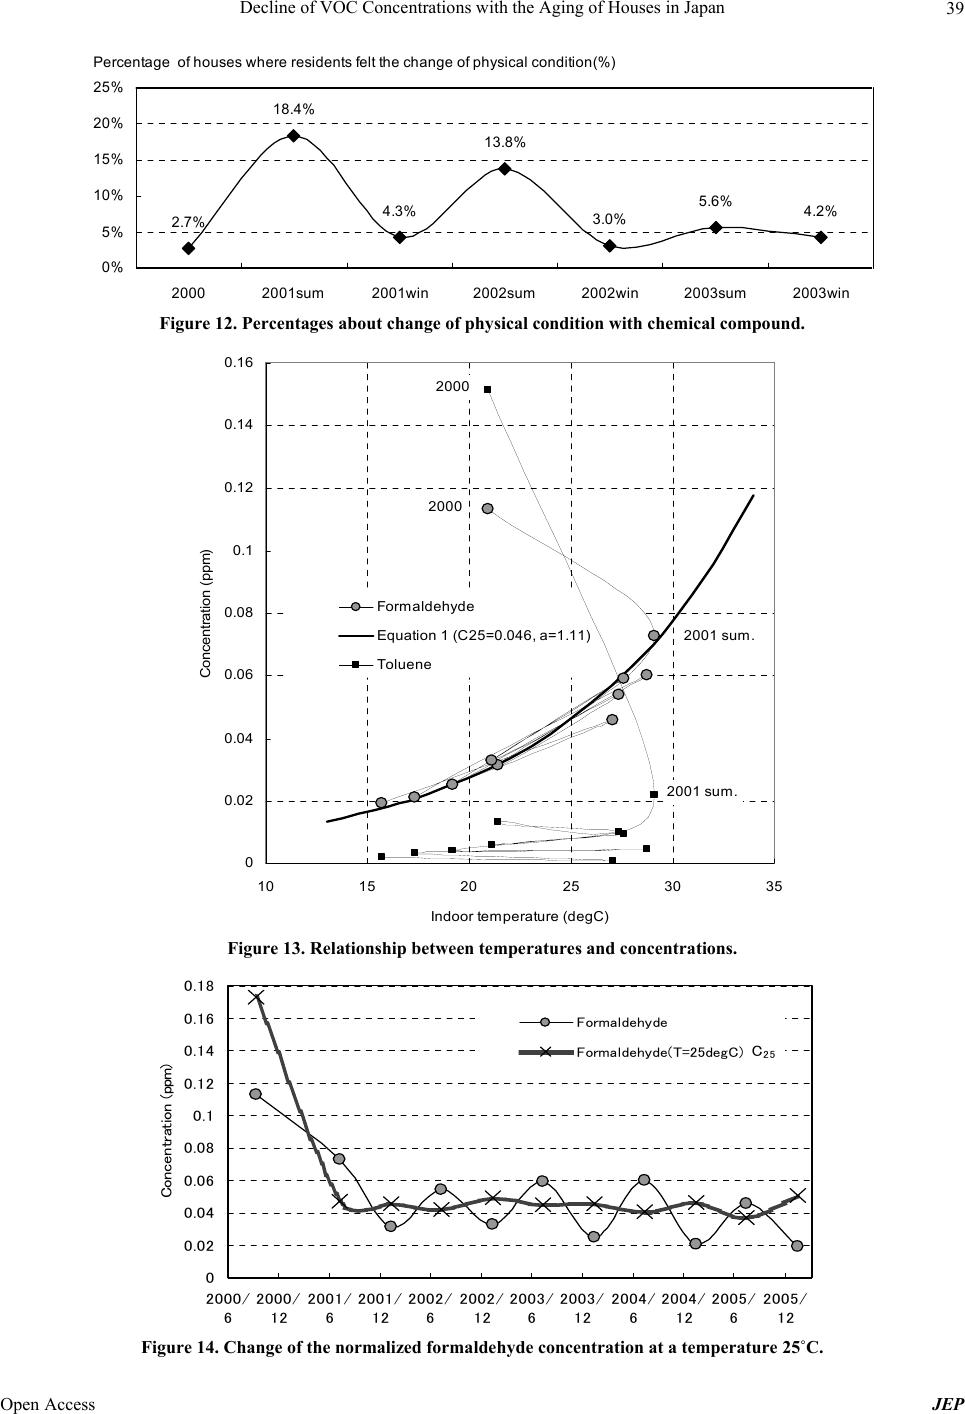 Decline of VOC Concentrations with the Aging of Houses in Japan 39 Percentage of houses where residents felt the change of physical condition(%) 2.7% 18.4% 4.3% 13.8% 3.0% 5.6% 4.2% 0% 5% 10% 15% 20% 25% 20002001sum2001win2002sum 2002win2003sum 2003win Figure 12. Percentages about change of physical condition with chemical co mpound. 0 0.02 0.04 0.06 0.08 0.1 0.12 0.14 0.16 10 15 2025 30 35 Indoor temperature (degC) Concentration (ppm) Formaldehyde Equation 1 (C25=0.046, a=1.11) Toluene 2000 2000 2001 sum. 2001 sum. Figure 13. Relationship between temperatures and concentrations. 0 0.02 0.04 0.06 0.08 0.1 0.12 0.14 0.16 0.18 2000/ 6 2000/ 12 2001/ 6 2001/ 12 2002/ 6 2002/ 12 2003/ 6 2003/ 12 2004/ 6 2004/ 12 2005/ 6 2005/ 12 Concentration (ppm) F ormaldehy de F ormaldehy de(T=25degC) C 25 Figure 14. Change of the normalized formaldehyde concentration at a temperature 25˚C. Open Access JEP 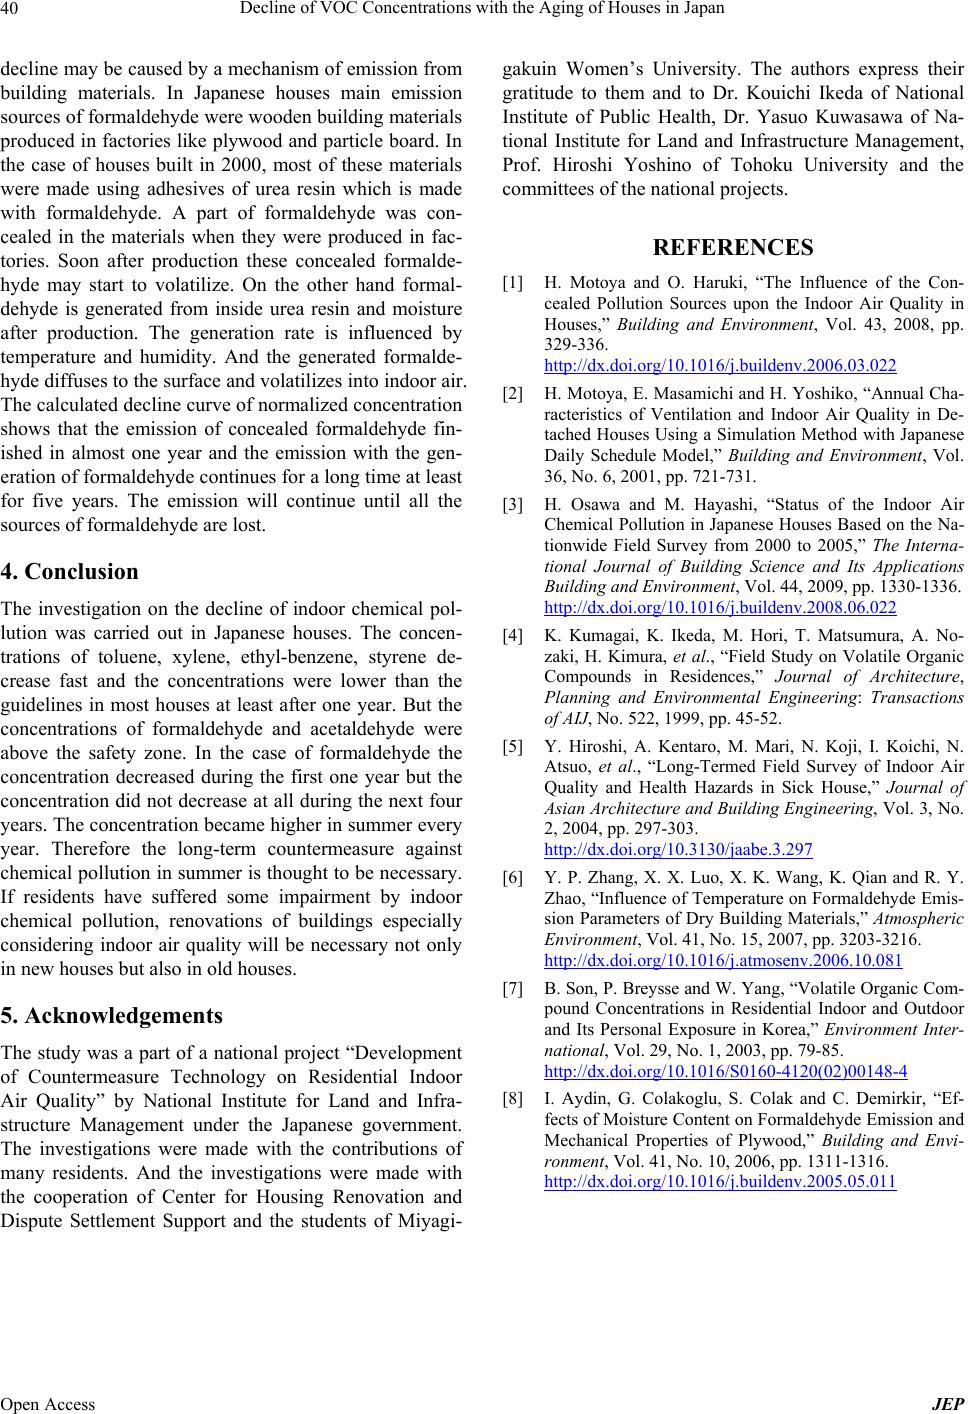 Decline of VOC Concentrations with the Aging of Houses in Japan Open Access JEP 40 decline may be caused by a mechanism of emission from building materials. In Japanese houses main emission sources of formaldehyde were wooden building materials produced in factories like plywood and particle board. In the case of houses built in 2000, most of these materials were made using adhesives of urea resin which is made with formaldehyde. A part of formaldehyde was con- cealed in the materials when they were produced in fac- tories. Soon after production these concealed formalde- hyde may start to volatilize. On the other hand formal- dehyde is generated from inside urea resin and moisture after production. The generation rate is influenced by temperature and humidity. And the generated formalde- hyde diffuses to the surface and volatilizes into indoor air. The calculated decline curve of normalized concentration shows that the emission of concealed formaldehyde fin- ished in almost one year and the emission with the gen- eration of formaldeh yde contin ues for a long ti me at least for five years. The emission will continue until all the sources of formaldehyde are lost. 4. Conclusion The investigation on the decline of indoor chemical pol- lution was carried out in Japanese houses. The concen- trations of toluene, xylene, ethyl-benzene, styrene de- crease fast and the concentrations were lower than the guidelines in most houses at least after one year. But the concentrations of formaldehyde and acetaldehyde were above the safety zone. In the case of formaldehyde the concentration decreased during the first one year but the concentration did not decrease at all during the next four years. The concentration became higher in summer every year. Therefore the long-term countermeasure against chemical pollution in su mmer is thought to be necessary. If residents have suffered some impairment by indoor chemical pollution, renovations of buildings especially considering indoor air quality will be necessary not only in new houses but als o in ol d ho uses. 5. Acknowledgements The study was a part of a national project “Development of Countermeasure Technology on Residential Indoor Air Quality” by National Institute for Land and Infra- structure Management under the Japanese government. The investigations were made with the contributions of many residents. And the investigations were made with the cooperation of Center for Housing Renovation and Dispute Settlement Support and the students of Miyagi- gakuin Women’s University. The authors express their gratitude to them and to Dr. Kouichi Ikeda of National Institute of Public Health, Dr. Yasuo Kuwasawa of Na- tional Institute for Land and Infrastructure Management, Prof. Hiroshi Yoshino of Tohoku University and the committees of the nationa l pro jects. REFERENCES [1] H. Motoya and O. Haruki, “The Influence of the Con- cealed Pollution Sources upon the Indoor Air Quality in Houses,” Building and Environment, Vol. 43, 2008, pp. 329-336. http://dx.doi.org/10.1016/j.buildenv.2006.03.022 [2] H. Motoya, E. Masamichi and H. Yoshiko, “Annual Cha- racteristics of Ventilation and Indoor Air Quality in De- tached Houses Using a Simulation Method with Japanese Daily Schedule Model,” Building and Environment, Vol. 36, No. 6, 2001, pp. 721-731. [3] H. Osawa and M. Hayashi, “Status of the Indoor Air Chemical Pollution in Japanese Houses Based on the Na- tionwide Field Survey from 2000 to 2005,” The Interna- tional Journal of Building Science and Its Applications Building and Environment, Vol. 44, 2009, pp. 1330-1336. http://dx.doi.org/10.1016/j.buildenv.2008.06.022 [4] K. Kumagai, K. Ikeda, M. Hori, T. Matsumura, A. No- zaki, H. Kimura, et al., “Field Study on Volatile Organic Compounds in Residences,” Journal of Architecture, Planning and Environmental Engineering: Transactions of AIJ, No. 522, 1999, pp. 45-52. [5] Y. Hiroshi, A. Kentaro, M. Mari, N. Koji, I. Koichi, N. Atsuo, et al., “Long-Termed Field Survey of Indoor Air Quality and Health Hazards in Sick House,” Journal of Asian Architecture and Building Engineering, Vol. 3, No. 2, 2004, pp. 297-303. http://dx.doi.org/10.3130/jaabe.3.297 [6] Y. P. Zhang, X. X. Luo, X. K. Wang, K. Qian and R. Y. Zhao, “Influence of Temperature on Formaldehyde Emis- sion Parameters of Dry Building Materials,” Atmospheric Environment, Vol. 41, No. 15, 2007, pp. 3203-3216. http://dx.doi.org/10.1016/j.atmosenv.2006.10.081 [7] B. Son, P. Breysse and W. Yang, “Volatile Organic Com- pound Concentrations in Residential Indoor and Outdoor and Its Personal Exposure in Korea,” Environment Inter- national, Vol. 29, No. 1, 2003, pp. 79-85. http://dx.doi.org/10.1016/S0160-4120(02)00148-4 [8] I. Aydin, G. Colakoglu, S. Colak and C. Demirkir, “Ef- fects of Moisture Content on Formaldehyde Emission and Mechanical Properties of Plywood,” Building and Envi- ronment, Vol. 41, No. 10, 2006, pp. 1311-1316. http://dx.doi.org/10.1016/j.buildenv.2005.05.011 |