

Paper Menu >>
Journal Menu >>
 Engineering, 2013, 5, 566-569 http://dx.doi.org/10.4236/eng.2013.510B116 Published Online October 2013 (http://www.scirp.org/journal/eng) Copyright © 2013 SciRes. ENG Automatic Assessment of Expanded Disability Status Scale (EDSS) in Multiple Sclerosis Using a Decision Tree Hua Cao1,2,3*, Olivier Agnani1,2,4,5, Laurent Peyrodie1,2,3,6, Samuel Boudet1,2,4, Cécile Donzé1,2,4,5 1Université Lille Nord de France, Lille, France 2UCLille, Lille, France 3Unité de Traiteme nt des Signaux Biomédicaux, Hautes Etudes d’Ingénieur, Lille, France 4Faculté Libre de Médecine, Groupe Hospitalier de l’Institut Catholique Lillois, Lille, France 5Service de Médecine Physique et de Rééducation Fonctionnelle, Hôpital de Saint-Philibert, Lomme, France 6Laboratoire d’Automatique et Génie Informatique et Signal, Université de Lille 1, Lille, France Email: *[email protected] Received 2013 ABSTRACT The expanded disability status scale (EDSS) is frequently used to classify the patients with multiple sclerosis (MS). We presented in this paper a novel method to automatically assess the EDSS score from posturologic data (center of pres- sure signals) using a decision tree. Two groups of participants (one for learning and the other for test) with EDSS rang- ing from 0 to 4.5 performed our balance experiment with eyes closed. Two linear measures (the length and the surface) and twelve non-linear measures (the recurrence rate, the Shannon e ntropy, the averaged diagonal line length and the trapping time for th e position, the instantaneous velocity and the instantaneous acceleration of the center of pressure respectively) were calculated for all the participants. Several decision trees were constructed with learning data and tested with test data. By comparing clinical and estimated EDSS scores in the test group, we selected one decision tree with five measures which revealed a 75% of agreement. The results have signified that our tree model is able to auto- matically assess the EDSS scores and that it is possible to distinguish the ED SS scores by using linear and non-linear postural sway measures. Keywords: Multiple Sclerosis (MS); Expanded Disability Status Scale (EDSS); Center of Pressure (COP); Recurrence Quantification Analysis (RQA); Decision Tree 1. Introduction The expanded disability status scale (EDSS), proposed by Kurtzke [1], is frequently used to classify and s tan- dardize the patients with multiple sclerosis (MS). The EDSS score ranges fro m 0 (normal neurological exami- nation) to 10 (death from MS) in 0.5 unit increments. There are eight functional systems (FS) involved to cal- culate the score: pyramidal, cerebellar, brain stem, sen- sory, bow el and bladder, cerebral, visual and other. EDSS is an ordinal measure and differences between the scale steps are not homogeneous. To overcome the va- riability between neurologists involved in examining the patients, at least a difference of 1.0 EDSS unit has been needed for defining a significant clinical change [2]. People with MS often present with poor balance which can be quantified by the force platform posturography, i.e. the trajectory of center of pressure (COP). During quiet standing on a force platform, two types of measures are usually derived from the posturologic data (COP sig- nal) for evaluating postural performance: linear and non- linear measures of postural sway. Linear measures, such as mean and standard deviation of sway amplitude, can mask the temporal var iability of postural sway, while non-linear measures, such as measures of recurrence quantification ana lysis (RQA), can provide dynamical features of COP oscillations of a given time series. Some studies on balance control in MS patients [3,4] have demonstrated that sway (postural disorders) is sig- nificantly greater in the MS group than in controls. In our previous papers [5,6], we observed a significant correla- tion between the EDSS and the posturologic data. There- fore, the purpose of this paper was to present a novel method of automatic assessment of EDSS scores from measures of postural sway using a decision tree. 2. Materials and Methods 2.1. Experiments There were two groups of participants (between 25 and 68 years of age) in our study: one of 118 participants (89 *Corresponding a uthor.  H. CAO ET AL. Copyright © 2013 SciRes. ENG 567 patients and 29 healthy subjects) as the learning group and the other of 20 patients as the test group. This study was realized in the Hôpital de Saint-Philibert, Lomme, France. Neurologists established their clinical EDSS scores ranging from 0 to 4.5. Nobody had orthopedic problems. This balance analysis technique is based on measurement of the COP’s sway in a standing subject with a recording time of 51.2 seconds and a sampling frequency of 40 Hz. The participant stood upright on a Satel platform (Figure 1) with bare feet and with his arms by the side. They were asked to stand as still as possible with the eyes closed during the record. 2.2. Measures of Postural Sway 2.2.1. Linear Measures Two linear measures were computed for all the partici- pants: the length (L) representing the total length of the COP path, and the surface (S) corresponding to the sur- face area of the ellipse that enclosed 90% of the COP points computed by principal component analysis (PCA). 2.2.2. Non-Linear Measures As posturogram reflects the movement of the COP, four non-linear RQA measures [7] were respectively calcu- lated for COP’s position (P), instantaneous velocity (V) and acceleration (A) (Table 1) of each part icipant. Recurrence rate (Rec): which is expressed as the den- sity of recurrence points in the recurrence plot (RP) 2,1 1(, ) N ij RecR ij N = = ∑ , (1) where N represents the number of points on the COP’s space trajectory and R(i,j) represents the value of the point (i,j) in the RP. Shannon entropy (Ent): which represents the probabil- ity of finding a diagonal of a given length min ()ln () N ll Entpl pl = = − ∑ , (2) where lmin is the minimal diagonal length, and p(l) is the probability of a diagonal line of exactly length l in the RP. This probability can be estimated from the frequency (a) (b) Figure 1. Satel force platform (a) and measurement of the COP (b). Table 1. Formula for calculating the COP’s instantaneous velocity and acceleration. Parameter Formu la Instantaneous velocity (V) ( )( ) 22 ()(( ))ViVxiVy i= + ( ) ((1)(1))/(2 *)Vxi XiXit=+− −∆ ()((1)(1))/(2 *)VyiYiYit=+− −∆ Instantaneous acceleration (A) ( )( ) 22 ()(( ))AiAxiAy i = + () ((1)())/( )Ax iVx iVx it= +−∆ () ((1)())/( )Ay iVy iVy it= +−∆ ∆t: sample duration equal to 1/40 s. distribution P(l) with ( ) min () () N ll Pl pl Pl = =∑ . (3) Averaged diagona l line length (LL): which measures the average length of the diagonal lines min min () () N ll N ll lP l LL Pl = = = ∑ ∑ , (4) which is related with the predictability time of the dy- namical system. Trapping time (TT): which quantifies the average length of the vertical lines min min () () N vv N vv vP v TT Pv = = = ∑ ∑ (5) where P(v) is the frequency distribution of the lengths v of the vertical lines, which have at least a length of vmin. For calculating these measures, the time delay was set to 1/40 s and the embedding dimension was 1. The mi- nimal diagonal length was set to 2 samples. The radius thresholds for identify recurrence were set to 15 mm for the position, 39 mm/s for the velocity and 360 mm/s2 for the acceleration, because the maximal correlation coeffi- cients between EDSS and recurrence measures were ob- tained with these radius for the learning group. 2.3. Data Analysis Decision tree analysis [8] was performed in order to se- lect the most important measures (among 14 measures mentioned previously) for assessing EDSS scores. We constructed our decision tree with all the possible com- binations of no more than 5 measures of the learning group, because a combination of too many measures would increase the complexity of the tree. In ord er to evaluate each constructed tree, the percentage of agree- ment (%Agreement) with an error of ±0.5 EDSS steps allowed was calculated by comparing estimated and cli- nical EDSS scores of the learning group. If its %Agree- 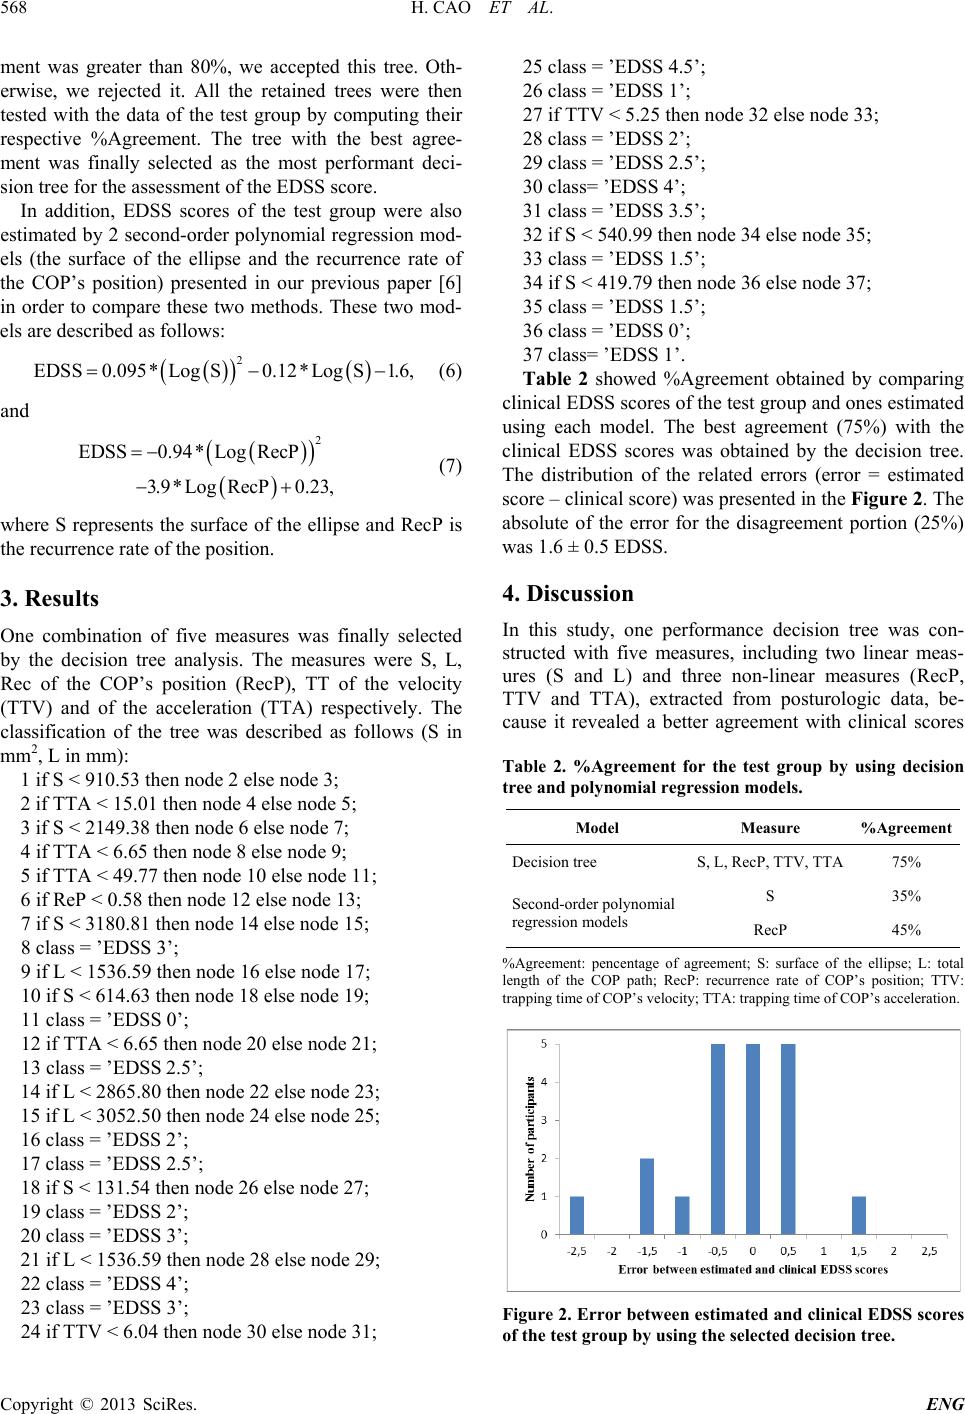 H. CAO ET AL. Copyright © 2013 SciRes. ENG 568 ment was greater than 80%, we accepted this tree. Oth- erwise, we rejected it. All the retained trees were then tested with the data of th e test group by computing their respective %Agreement. The tree with the best agree- ment was finally selected as the most performant deci- sion tree for the assessment of the EDSS score. In addition, EDSS scores of the test group were also estimated by 2 second-order polynomial regression mod- els (the surface of the ellipse and the recurrence rate of the COP’s position) presented in our previous paper [6] in order to compare these two methods. These two mod- els are described as follows: ( ) ( ) ( ) 2 EDSS0.095* Log S0.12*Log S1.6,= −− (6) and ( ) ( ) ( ) 2 EDSS0.94* LogRecP 3.9*Log RecP0.23, = − −+ (7) where S represents the surface of the ellipse and RecP is the recurrence rate of the position. 3. Results One combination of five measures was finally selected by the decision tree analysis. The measures were S, L, Rec of the COP’s position (RecP), TT of the velocity (TTV) and of the acceleration (TTA) respectively. The classification of the tree was described as follows (S in mm2, L in mm): 1 if S < 910.53 then node 2 else node 3; 2 if TTA < 15.01 then node 4 else node 5; 3 if S < 2149.38 then node 6 else node 7; 4 if TTA < 6.65 then node 8 else node 9; 5 if TTA < 49.77 then node 10 else node 11; 6 if ReP < 0.58 then node 12 else node 13; 7 if S < 3180.81 then node 14 else node 15; 8 class = ’EDSS 3’; 9 if L < 1536.59 then node 16 else node 17; 10 if S < 614.63 then node 18 else node 19; 11 class = ’EDSS 0’; 12 if TTA < 6.65 then node 20 else node 21; 13 class = ’EDSS 2.5’; 14 if L < 2865.80 then node 22 else node 23; 15 if L < 3052.50 then node 24 else node 25; 16 class = ’EDSS 2’; 17 class = ’EDSS 2.5’; 18 if S < 131.54 then node 26 else node 27; 19 class = ’EDSS 2’; 20 class = ’EDSS 3’; 21 if L < 1536.59 then node 28 else node 29; 22 class = ’EDSS 4’; 23 class = ’EDSS 3’; 24 if TTV < 6.04 then node 30 else node 31; 25 class = ’EDSS 4.5’; 26 class = ’EDSS 1’; 27 if TTV < 5.25 then node 32 else node 33; 28 class = ’EDSS 2’; 29 class = ’EDSS 2.5’; 30 class= ’EDSS 4’; 31 class = ’EDSS 3.5’; 32 if S < 540.99 then node 34 else node 35; 33 class = ’EDSS 1.5’; 34 if S < 419.79 then node 36 else node 37; 35 class = ’EDSS 1.5’; 36 class = ’EDSS 0’; 37 class= ’EDSS 1’. Table 2 showed %Agreement obtained by comparing clinical EDSS s cores of the test group and ones estimated using each model. The best agreement (75%) with the clinical EDSS scores was obtained by the dec ision tree. The distribution of the related errors (erro r = estimated score – clinica l score) was presented in the Figure 2. The absolute of the error for the disagreement portion (25%) was 1.6 ± 0.5 EDSS. 4. Discussion In this study, one performance decision tree was con- structed with five measures, including two linear meas- ures (S and L) and three non-linear measures (RecP, TTV and TTA), extracted from posturologic data, be- cause it revealed a better agreement with clinical scores Table 2. %Agreement for the test group by using decision tree and polynomial regression models. Model Measure %Agreement Decision tree S, L, RecP, TTV, TTA 75% Second-order polynomial regression models S 35% RecP 45% %Agreement: pencentage of agreement; S: surface of the ellipse; L: total length of the COP path; RecP: recur rence rate of COP’s position; TTV: trapping time of COP’s velo ci ty; TTA: trapping time of COP’s accelerat ion. Figure 2. Error between estimated and clinical EDSS scores of the test group by using the selected decision tree. 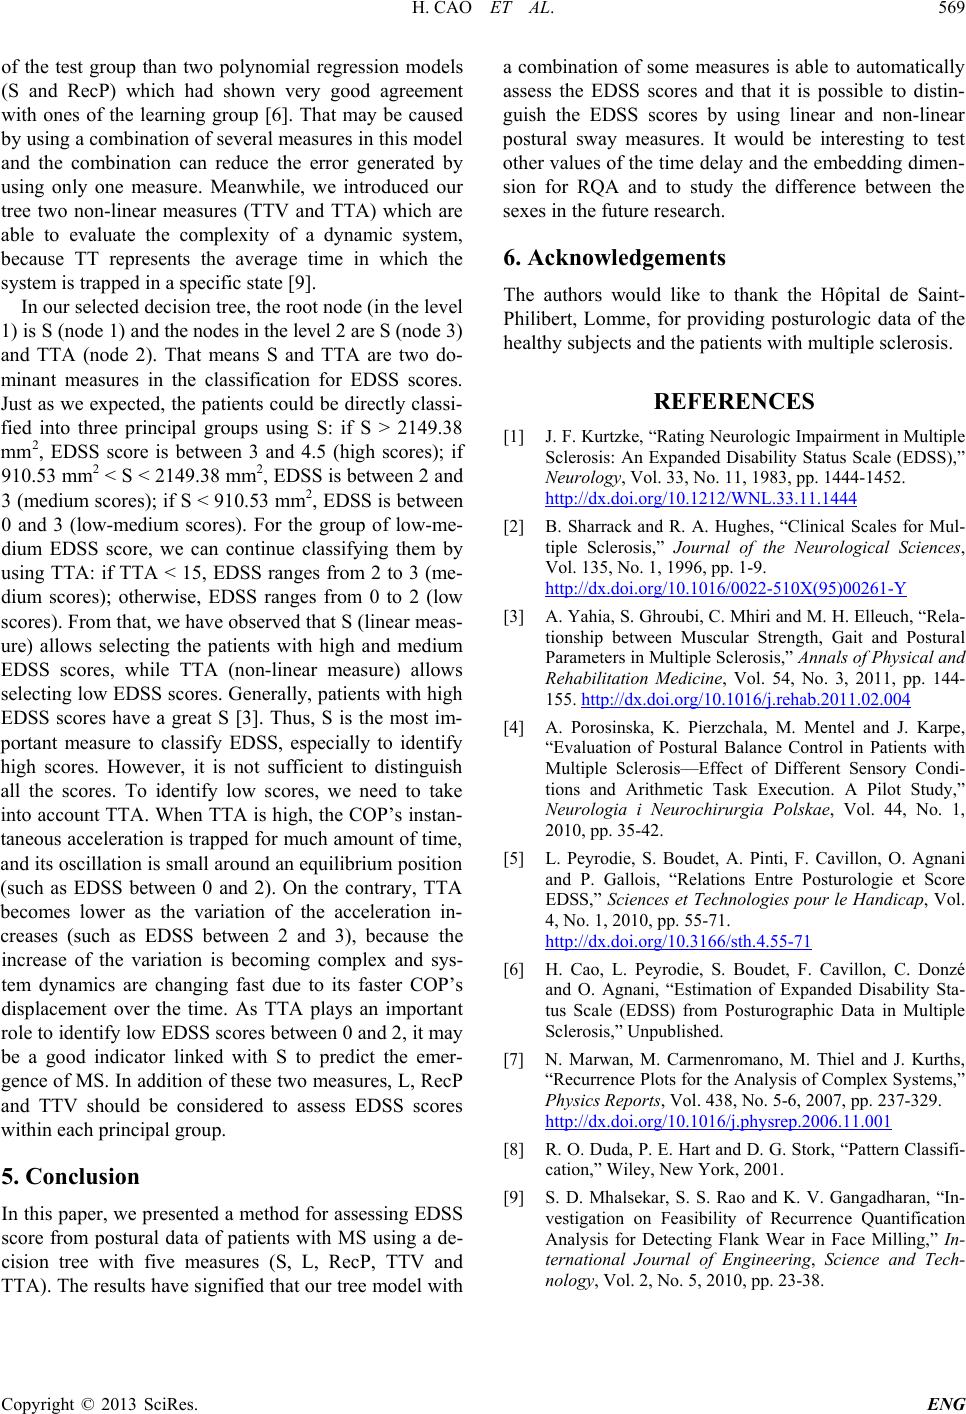 H. CAO ET AL. Copyright © 2013 SciRes. ENG 569 of the test group than two polynomial regression models (S and RecP) which had shown very good agreement with ones of the learning group [6]. That may be caused by using a combination of several measures in this model and the combination can reduce the error gen erated by using only one measure. Meanwhile, we introduced our tree two non-linear measures (TTV and TTA) which are able to evaluate the complexity of a dynamic system, because TT represents the average time in which the system is trapped in a specific state [9]. In our selected decision tree, the root node (in the level 1) is S (node 1) and the nodes in the level 2 are S (node 3) and TTA (node 2). That means S and TTA are two do- minant measures in the classification for EDSS scores. Just as we expected, the patients could be directly classi- fied into three principal groups using S: if S > 2149.38 mm2, EDSS score is between 3 and 4.5 (high scores); if 910.53 mm2 < S < 2149.38 mm2, EDSS is between 2 and 3 (medium scores); if S < 910.53 mm2, EDSS is between 0 and 3 (low-medium scores). Fo r the group of low-me- dium EDSS score, w e can continue classifying them by using TTA: if TTA < 15, EDSS ranges from 2 to 3 (me- dium scores); otherwise, EDSS ranges fro m 0 to 2 (low scores). From that, we have observed that S (linear meas- ure) allows selecting the patients with high and medium EDSS scores, while TTA (non-linear measure) allows selecting low EDSS scores. Generally, patients with high EDSS scores have a great S [3]. Thus, S is the most im- portant measure to classify EDSS, especially to identify high scores. However, it is not sufficient to distinguish all the scores. To identify low scores, we need to take into account TTA. When TTA is high, the COP’s instan- taneous acceleration is trapped for much amount of time, and its oscillation is small around an equilibrium position (such as EDSS between 0 and 2). On the contrary, TTA becomes lower as the variation of the acceleration in- creases (such as EDSS between 2 and 3), because the increase of the variation is becoming complex and sys- tem dynamics are changing fast due to its faster COP’s displacement over the time. As TTA plays an important role to identify low EDSS scores between 0 and 2, it may be a good indicator linked with S to predict the emer- gence of MS. In addition of these two measures, L, RecP and TTV should be considered to assess EDSS scores within each principal grou p. 5. Conclusion In this paper, we presented a method for assessing EDSS score from postural data of patients with MS using a de- cision tree with five measures (S, L, RecP, TTV and TTA). The results have signified that our tree model with a combination of some measures is able to automatically assess the EDS S scores and that it is possible to distin- guish the EDSS scores by using linear and non-linear postural sway measures. It would be interesting to test other values of the time d elay and the embedding dimen- sion for RQA and to study the difference between the sexes in the future research. 6. Acknowledgements The authors would like to thank the Hôpital de Saint- Philibert, Lomme, for prov iding posturologic data of the healthy subjects and the patients with multiple sclerosis. REFERENCES [1] J. F. Kurtzke, “Rating Neurologic Impairment in Multiple Sclerosis: An Expanded Disability Status Scale (EDSS),” Neurology, Vol. 33, No. 11, 1983, pp. 1444-1452. http://dx.doi.org/10.1212/WNL.33.11.1444 [2] B. Sharrack and R. A. Hughes, “Clinical Scales for Mul- tiple Sclerosis,” Journal of the Neurological Sciences, Vol. 135, No. 1, 1996, pp. 1-9. http://dx.doi.org/10.1016/0022-510X(95)00261-Y [3] A. Yahia, S. Ghroubi, C. Mhiri and M. H. Elleuch, “Rela- tionship between Muscular Strength, Gait and Postural Parameters in Multiple Sclerosis,” Annals of Physical and Rehabilitation Medicine, Vol . 54, No. 3, 2011, pp. 144- 155. http://dx.doi.org/10.1016/j.rehab.2011.02.004 [4] A. Porosinska, K. Pierzchala, M. Mentel and J. Karpe, “Evaluation of Postural Balance Control in Patients with Multiple Sclerosis—Effect of Different Sensory Condi- tions and Arithmetic Task Execution. A Pilot Study,” Neurologia i Neurochirurgia Polskae, Vol. 44, No. 1, 2010, pp. 35-42. [5] L. Peyrodie, S. Boudet, A. Pinti, F. Cavillon, O. Agnani and P. Gallois, “Relations Entre Posturologie et Score EDSS,” Sciences et Technologies pour le Handicap, Vol. 4, No. 1, 2010, pp. 55-71. http://dx.doi.org/10.3166/sth.4.55-71 [6] H. Cao, L. Peyrodie, S. Boudet, F. Cavillon, C. Donzé and O. Agnani, “Estimation of Expanded Disability Sta- tus Scale (EDSS) from Posturographic Data in Multiple Sclerosis,” Unpublished. [7] N. Marwan, M. Carmenromano, M. Thiel and J. Kurths, “Recurrence Plots for the Analysis of Complex Systems,” Physics Reports, Vol. 438, No. 5-6, 2007, pp. 237-329. http://dx.doi.org/10.1016/j.physrep.2006.11.001 [8] R. O. Duda, P. E. Hart and D. G. Stork, “Pattern Classifi- cation,” Wiley, New York, 2001. [9] S. D. Mhalsekar, S. S. Rao and K. V. Gangadharan, “In- vestigation on Feasibility of Recurrence Quantification Analysis for Detecting Flank Wear in Face Milling,” In- ternational Journal of Engineering, Science and Tech- nology, Vol. 2, No. 5, 2010, pp. 23-38. |