

Paper Menu >>
Journal Menu >>
 Engineering, 2013, 5, 513-517 http://dx.doi.org/10.4236/eng.2013.510B105 Published Online October 2013 (http://www.scirp.org/journal/eng) Copyright © 2013 SciRes. ENG Prediction of Peptides Binding to Major Histocompatibility Class II Molecules Using Machine Learning Methods Fateme Kazemi Faramarzi, Majid Mohammad Beigi, Yasamin Botorabi, Najme Mousavi Department of Biomedical Engineering, University of Isfahan, Isfahan, Iran Email: [email protected] Received 2013 Abstract In daily life, we are frequently attacked by infection organisms such as bacteria and viruses. Major Histocompatibility (MHC) molecules have an essential role in T-cell activation and initiating an adaptive immune response. Development of methods for prediction of MHC-Peptide binding is important in vaccine design and immunotherapy. In this study, we try to predict the binding between peptides and MHC class II. Support vector machine (SVM) and Multi-Layer Percep- tron (MLP) are used for classification. These classifiers based on pseudo amino acid compositions of data that we ex- tracted from PseAAC server, classify the data. Since, the dataset, used in this work, is imbalanced, we apply a pre- processing step to over-sample the minority class and come over this problem. The results show that using the concept of pseudo amino acid composition and applying over-sampling method, increases the performance of predictor. Fur- thermore, the results demonstrate that using the concept of Pse AAC and SVM is a successful method for the prediction of MHC class II molecules. Keywords: MHC Class II; Imbalanced Data; SMOTE; SVM 1. Introduction Major Histocompatibility (MHC) molecules play a sig- nificant role in graft rejection and T-cell activation. Binding between the antigenic peptide and the MHC molecule is a necessary prerequisite for recognition of antigens by the T cells and initiating an adaptive immune response [1]. But, all the peptides cannot bind and only some of them can bind to MHC molecules. Prediction of which peptides can bind to MHC molecules is important to understanding the immune system response. The pep- tide that can bind to MHC and causes an immune re- sponse is called T-cell epitope. Antigen processing and presentation take place by MHC class I and MHC class II pathways. It is clear that development of machine learning methods to predict the epitopes can reduce the number of the high-cost assay needed to identify T-cell epitopes. This prediction is im- portant for vaccine design and immunotherapy for dis- eases such as cancer [2]. In this study, we use two machine learning methods to predict the binding between peptide and MHC class II molecule and apply these methods on the HLA-DRB1* 0301 data. For machine learning approaches we need to extract features from amino acid sequences. Different computa- tional methods were introduced for this purpose. One of them is Composition-Transition-Distribution (CTD). In this method, in order to apply machine learning method, peptides with different-lengths are mapped to fixed lengths [3]. Another proposed method is k-spectrum kernel. If the similarity between two sequences is high, these sequences have a great k-spectrum kernel value. This means that the y have many common k-mer subse- quences [4]. In another work, the Local Alignment (LA) kernel was suggested for prediction. In this method, local alignment with gaps is applied to sequences and a score is obtained. This score is used to measure the similarity between these sequences [5]. In this work, we calculate the pseudo amino acid com- positions [6] for peptides using PseAAC server and then classify the peptides based on these extracted features. For the imbalanced dataset problem, we apply a pre- processing step to balance the data distribution. For this purpose we use Synthetic Minority Over-sampling Tech- nique (SMOTE). Also, Multi-Layer Perceptron (ML P) and Support Vector Machine (SVM) are used for the classification task. The results are compared with pre- vious results in [7]. In order to implement these methods, Weka machine learning workbench is used (www. cs.waikato.ac.nz). Figure 1 shows the significant steps in our approach. The reminder sections are organized as follow, Section II describes the related techniq u es for our approach , 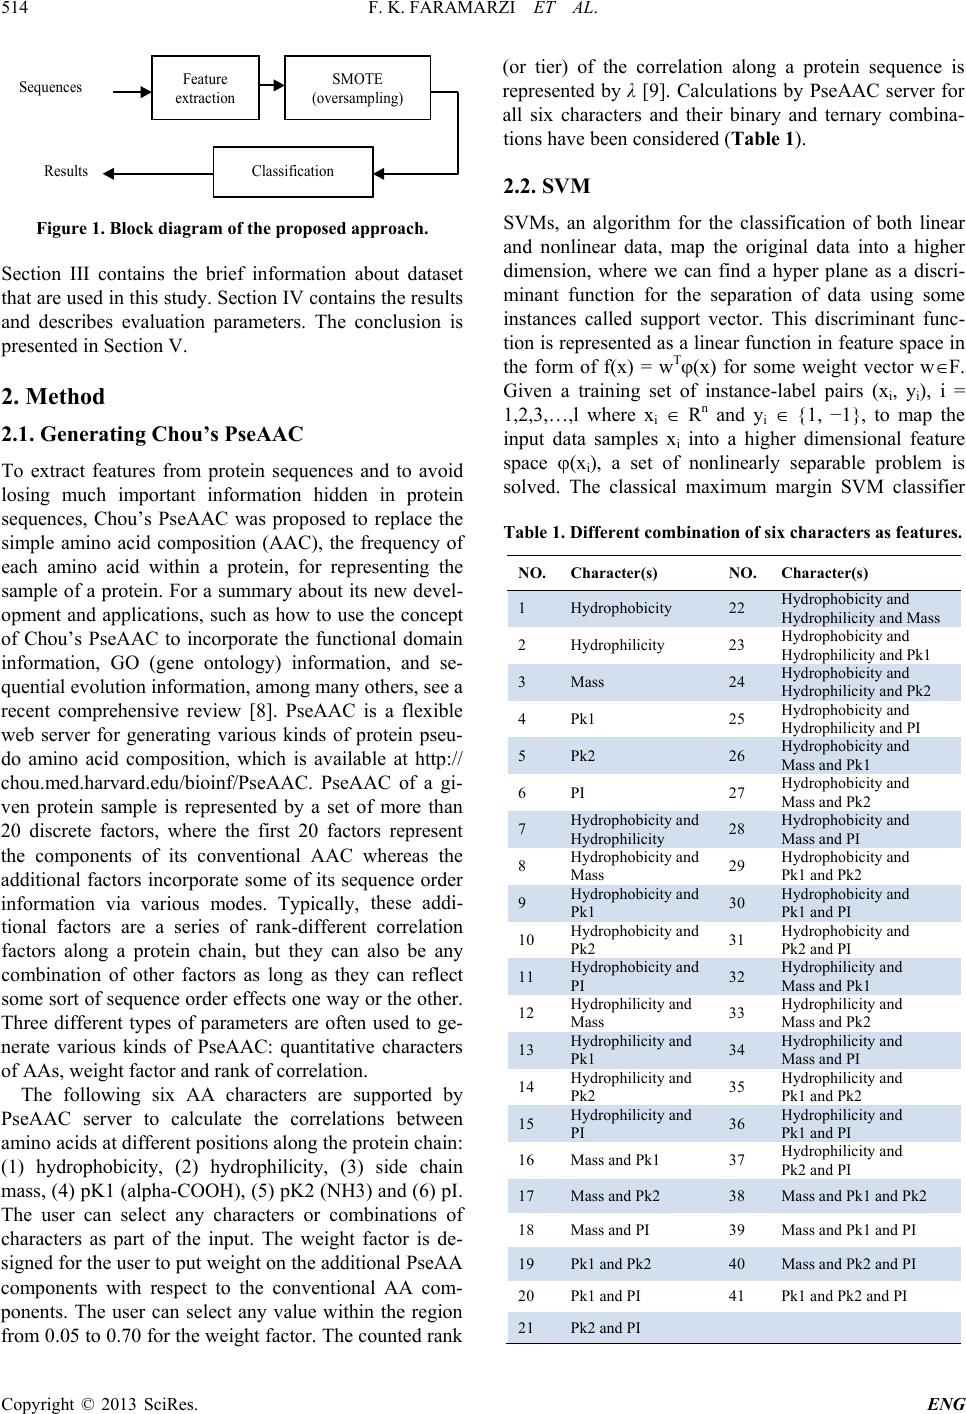 F. K. FARAMARZI ET AL. Copyright © 2013 SciRes. ENG 514 Feature extraction Classification SMOTE (oversampling) Sequences Results Figure 1. Block diagram of the proposed approach. Section III contains the brief information about dataset that are used in this study. Section IV contains the results and describes evaluation p arameters. The conclusion is presented in Section V. 2. Method 2.1. Generating Chou’s PseAAC To extract features from protein sequences and to avoid losing much important information hidden in protein sequences, Chou’s PseAA C was proposed to replace the simple amino acid composition (AAC), the frequency of each amino acid within a protein, for representing the sample of a protein. For a summary about its new devel- opment and applications, such as how to use the concept of Chou’s PseAAC to incorporate the functional domain information, GO (gene ontology) information, and se- quential evolution information, among many others, see a recent comprehensive review [8]. PseAAC is a flexible web server for generating various kinds of protein pseu- do amino acid composition, which is available at http:// chou.med.harvard.edu/bioinf/PseAAC. PseAAC of a gi- ven protein sample is represented by a set of more than 20 discrete factors, where the first 20 factors represent the components of its conventional AAC whereas the additional factors incorporate some of its sequence order information via various modes. Typically, these addi- tional factors are a ser ies of rank-different correlation factors along a protein chain, but they can also be any combination of other factors as long as they can reflect some sort of sequence order effects one way or the other. Three different types of parameters are often used to ge- nerate various kinds of PseAAC: quantitative characters of AAs, weight factor and rank of correlation. The following six AA characters are supported by PseAAC server to calculate the correlations between amino acids at different positions along the protein chain: (1) hydrophobicity, (2) hydrophilicity, (3) side chain mass, (4) pK1 (alpha-COOH), (5) pK2 (NH3) and (6) pI. The user can select any characters or combinations of characters as part of the input. The weight factor is de- signed for the user to put weight on the additional PseAA components with respect to the conventional AA com- ponents. The user can select any value within the region from 0.05 to 0.70 for the weight factor. The counted rank (or tier) of the correlation along a protein sequence is represented by λ [9]. Calculations by PseA AC s erver for all six characters and their binary and ternary combina- tions have been considered (Table 1). 2.2. SVM SVMs, an algorithm for the classification of both linear and nonlinear data, map the original data into a higher dimension, where we can find a hyper plane as a discri- minant function for the separation of data using some instances called support vector. This discriminant func- tion is represented as a linear function in feature space in the form of f(x) = wTϕ(x) for some weight vector w∈F. Given a training set of instance-label pairs (xi, yi), i = 1,2,3,…,l where xi ∈ Rn and yi ∈ {1, −1}, to map the input data samples xi into a higher dimensional feature space ϕ(xi), a set of nonlinearly separable problem is solved. The classical maximum margin SVM classifier Table 1. Different combination of six characters as features. NO. Character(s) NO. Character(s) 1 Hydrophobicity 22 Hydrophobicity and Hydrophilicity and Mass 2 Hydrophilicity 23 Hydrophobicity and Hydrophilicity and Pk1 3 Mass 24 Hydrophobicit y and Hydrophilicity and Pk2 4 Pk1 25 Hydrophobicity and Hydrophilicity and PI 5 Pk2 26 Hydrophobicity and Mass and Pk1 6 PI 27 Hydrophobicity and Mass and Pk2 7 Hydrophobicity and Hydrophilicity 28 Hydrophobicity and Mass and PI 8 Hydrophobicity and Mass 29 Hydrophobicit y and Pk1 and Pk2 9 Hydrophobicity and Pk1 30 Hydrophobicity and Pk1 and PI 10 Hydrophobicity and Pk2 31 Hydrophobicity and Pk2 and PI 11 Hydrophobicity and PI 32 Hydrophilicity and Mass and Pk1 12 Hydrophilicity and Mass 33 Hydrophilicity and Mass and Pk2 13 Hydrophilicity and Pk1 34 Hydrophilicity and Mass and PI 14 Hydrophilicity and Pk2 35 Hydrophilicity and Pk1 and Pk2 15 Hydrophilicity and PI 36 Hydrophilicity and Pk1 and PI 16 Mass and Pk1 37 Hydrophilicity and Pk2 and PI 17 Mass and Pk2 38 Mass and Pk1 and Pk2 18 Mass and PI 39 Mass and Pk 1 and PI 19 Pk1 and Pk2 40 Mass and Pk2 and PI 20 Pk1 and PI 41 Pk1 and Pk2 and PI 21 Pk2 and PI 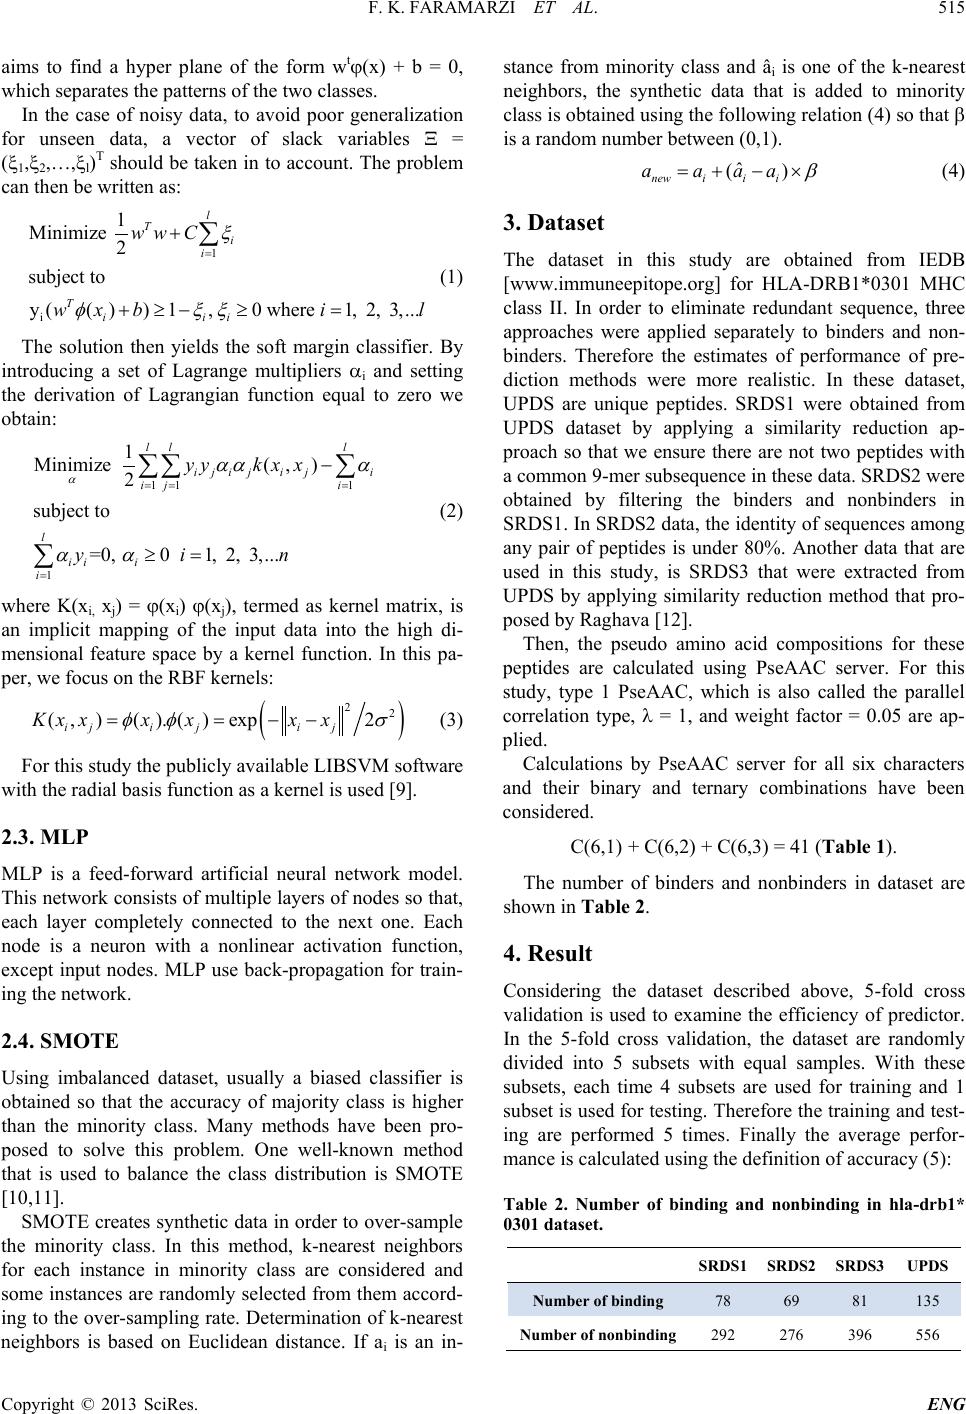 F. K. FARAMARZI ET AL. Copyright © 2013 SciRes. ENG 515 aims to find a hyper plane of the form wtϕ(x) + b = 0, which separates the patterns of the two classes. In the case of noisy data, to avoid poor generalization for unseen data, a vector of slack variables Ξ = (ξ1,ξ2,…,ξl)T should be taken in to account. The problem can then be written as: 1 i 1 Minimize 2 subject to y(())1,0where 1, 2, 3, ... l Ti i Ti ii ww C wxbi l ξ φ ξξ = + + ≥−≥= ∑ (1) The solution then yields the soft margin classifier. By introducing a set of Lagrange multipliers αi and setting the derivation of Lagrangian function equal to zero we obtain: 11 1 1 1 Minimize (,) 2 subject to =0, 0 1, 2, 3,... ll l iji jiji ij i l ii i i yyk xx yin α αα α αα = == = − ≥= ∑∑ ∑ ∑ (2) where K(xi, xj) = ϕ(xi) ϕ(xj), termed as kernel matrix, is an implicit mapping of the input data into the high di- mensional feature space by a kernel function. In this pa- per, we focus on the RBF kernels: () 22 (,)(). ()exp2 ijiji j Kxxxxx x φφ σ == −− (3) For this study the publicly available LIBSVM software with the radial basis function as a kernel is used [9]. 2.3. MLP MLP is a feed-forward artificial neural network model. This netwo rk consists of multiple layers of nodes so that, each layer completely connected to the next one. Each node is a neuron with a nonlinear activation function, except input nodes. MLP use back-propagation for train- ing the network. 2.4. SMOTE Using imbalanced dataset, usually a biased classifier is obtained so that the accuracy of majority class is higher than the minority class. Many methods have been pro- posed to solve this problem. One well-known method that is used to balance the class distribution is SMOTE [10,11]. SMOTE creates synthetic data in order to over-sample the minority class. In this method, k-nearest neighbors for each instance in minority class are considered and some instances are randomly selected from them accord- ing to the over-sampling rate. Determination of k-nearest neighbors is based on Euclidean distance. If ai is an in- stance from minority class and âi is one of the k-nearest neighbors, the synthe tic data that is added to minority class is obtained using the following relation (4) so that β is a random number between (0,1). ˆ () newiii aa aa β =+−× (4) 3. Dataset The dataset in this study are obtained from IEDB [www.immuneepitope.org] for HLA-DRB1*0301 MHC class II. In order to eliminate redundant sequence, three approaches were applied separately to binders and non- binders. Therefore the estimates of performance of pre- diction methods were more realistic. In these dataset, UPDS are unique peptides. SRDS1 were obtained from UPDS dataset by applying a similarity reduction ap- proach so that we ensure there are not two peptides with a common 9-mer subsequence in these data. SRDS2 were obtained by filtering the binders and nonbinders in SRDS1. In SRDS2 data, the identity of sequences among any pair of peptides is under 80%. Another data that are used in this study, is SRDS3 that were extracted from UPDS by applying similarity reduction method that p ro- posed by Raghava [12]. Then, the pseudo amino acid compositions for these peptides are calculated using PseAAC server. For this study, type 1 PseAAC, which is al so called the parallel correlation type, λ = 1, and weight factor = 0.05 are ap- plied. Calculations by PseAAC server for all six characters and their binary and ternary combinations have been considered. C(6,1) + C(6,2) + C(6,3) = 41 (Table 1). The number of binders and nonbinders in dataset are shown in Table 2. 4. Result Considering the dataset described above, 5-fold cros s validation is used to examine the efficiency of predictor. In the 5-fold cross validation, the dataset are randomly divided into 5 subsets with equal samples. With these subsets, each time 4 subsets are used for training and 1 subset is used for testing. Therefore the training and test- ing are performed 5 times. Finally the average perfor- mance is calculated using the definition of accuracy (5): Table 2. Number of binding and nonbinding in hla-drb1* 0301 dataset. SRDS1 SRDS2 SRDS3 UPDS Number of binding 78 69 81 135 Number of nonbinding 292 276 396 556 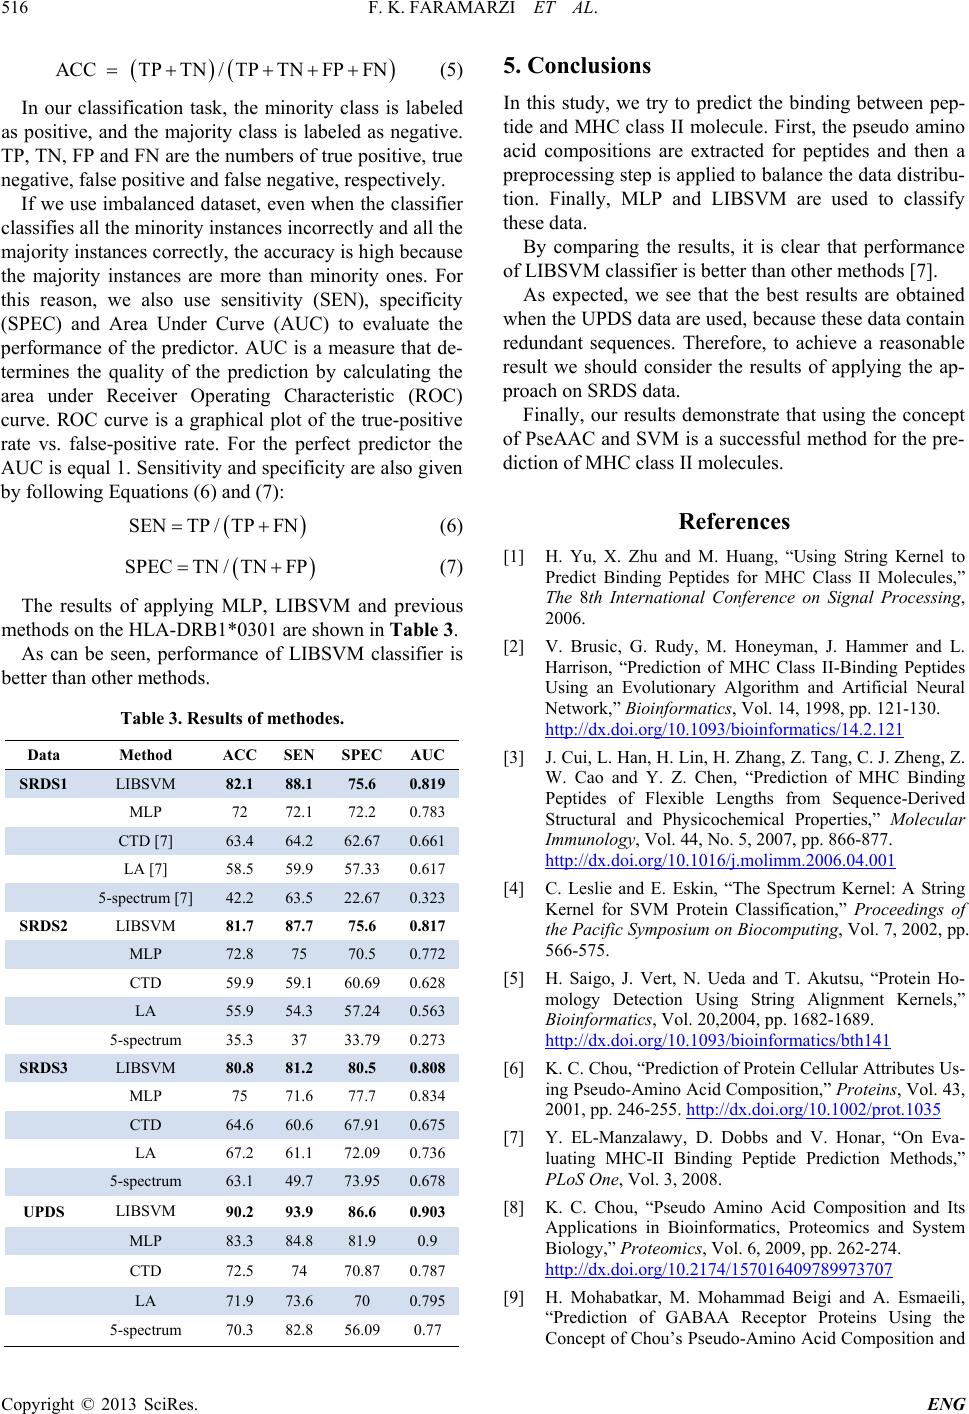 F. K. FARAMARZI ET AL. Copyright © 2013 SciRes. ENG 516 () () ACC TPTN/ TPTNFPFN=++ ++ (5) In our classification task, the minor ity class is labeled as positive, and the majority class is labeled as negative. TP, TN, FP and FN are the numbers of true positive, true negative, false positive and false negative, respectively. If we use imbalanced dataset, even when the classifier classifies all the minority instances incorrectly and all the majority instances correctly, the accuracy is high because the majority instances are more than minority ones. For this reason, we also use sensitivity (SEN), specificity (SPEC) and Area Under Curve (AUC) to evaluate the performance of the predictor. AUC is a measure that de- termines the quality of the prediction by calculating the area under Receiver Operating Characteristic (ROC) curve. ROC curve is a graphical plot of the true-positive rate vs. false-positive rate. For the perfect predictor the AUC is equal 1. Sensitivity and specificity are also given by following Equations (6) and (7): ( ) SENTP /TPFN= + (6 ) ( ) SPECTN /TNFP= + (7) The results of applying MLP, LIBSVM and previous methods on the HLA-DRB1*0301 are shown in Table 3. As can be seen, performance of LIBSVM classifier is better than other methods. Table 3. Results of methodes. Data Method ACC SEN SPEC AUC SRDS1 LIBSVM 82.1 88.1 75.6 0.819 MLP 72 72.1 72.2 0.783 CTD [7] 63.4 64.2 62.67 0.661 LA [7] 58.5 59.9 57.33 0.617 5-spectrum [7] 42.2 63.5 22.67 0.323 SRDS2 LIBSVM 81.7 87.7 75.6 0.817 MLP 72.8 75 70.5 0.772 CTD 59.9 59.1 60.69 0.628 LA 55.9 54.3 57.24 0.563 5-spectrum 35.3 37 33.79 0.273 SRDS3 LIBSVM 80.8 81.2 80.5 0.808 MLP 75 71.6 77.7 0.834 CTD 64.6 60.6 67.91 0.675 LA 67.2 61.1 72.09 0.736 5-spectrum 63.1 49.7 73.95 0.678 UPDS LIBSVM 90.2 93.9 86.6 0.903 MLP 83.3 84.8 81.9 0.9 CTD 72.5 74 70.87 0.787 LA 71.9 73.6 70 0.795 5-spectrum 70.3 82.8 56.09 0.77 5. Conclusions In this study, we try to predict the binding between pep- tide and MHC class II molecule. First, the pseudo amino acid compositions are extracted for peptides and then a preprocessing step is applied to balance the data distribu- tion. Finally, MLP and LIBSVM are used to classify these data. By comparing the results, it is clear that performance of LIBSVM classifier is better than other methods [7]. As expected, we see that the best results are obtained when the U PD S data are used, because these data contain redundant sequences. Therefore, to achieve a reasonable result we should consider the results of applying the ap- proach on SRDS data. Finally, our r esults demonstrate that using the concept of PseAAC and SVM is a successful method for the pre- diction of MHC class II molecules. References [1] H. Yu, X. Zhu and M. Huang, “Using String Kernel to Predict Binding Peptides for MH C Class II Molecules,” The 8th International Conference on Signal Processing, 2006. [2] V. Brusic, G. Rudy, M. Honeyman, J. Hammer and L. Harrison, “Prediction of MHC Class II-Binding Peptides Using an Evolutionary Algorithm and Artificial Neural Network,” Bioinformatics, Vol. 14, 1998, pp. 121-130. http://dx.doi.org/10.1093/bioinformatics/14.2.121 [3] J. Cui, L. Han, H. Lin, H. Zhang, Z. Tang, C. J. Zheng, Z. W. Cao and Y. Z. Chen, “Prediction of MHC Binding Peptides of Flexible Lengths from Sequence-Derived Structural and Physicochemical Properties,” Molecular Immunology, Vol. 44, No. 5, 2007, pp. 866-877. http://dx.doi.org/10.1016/j.molimm.2006.04.001 [4] C. Leslie and E. Eskin, “The Spectrum Kernel: A String Kernel for SVM Protein Classification,” Proceedings of the Pacific Symposium on Biocomputing, Vol. 7, 2002, pp. 566-575. [5] H. Saigo, J. Vert, N. Ueda and T. Akutsu, “Protein Ho- mology Detection Using String Alignment Kernels,” Bioinformatics, Vol. 20,2004, pp. 1682-1689. http://dx.doi.org/10.1093/bioinformatics/bth141 [6] K. C. Chou, “Prediction of Protein Cellular Attributes Us- ing Pseudo-Amino Acid Composition,” Proteins, Vol. 43, 2001, pp. 246-255. http://dx.doi.org/10.1002/prot.1035 [7] Y. EL-Manzalawy, D. Dobbs and V. Honar, “On Eva- luating MHC-II Binding Peptide Prediction Methods,” PLoS One, Vol. 3, 2008. [8] K. C. Chou, “Pseudo Amino Acid Composition and Its Applications in Bioinformatics, Proteomics and System Biology,” Proteomics, Vol. 6, 2009, pp. 262-274. http://dx.doi.org/10.2174/157016409789973707 [9] H. Mohabatkar, M. Mohammad Beigi and A. Esmaeili, “Prediction of GABAA Receptor Proteins Using the Concept of Chou’s Pseudo-Amino Acid Composition and  F. K. FARAMARZI ET AL. Copyright © 2013 SciRes. ENG 517 Support Vector Machine,” Journal of Theoretical Biology, Vol. 281, 2011, pp. 18-23. http://dx.doi.org/10.1016/j.jtbi.2011.04.017 [10] J. Luengo, A. Fernández, S. García and F. Herrera, “Ad- dressing Data Complexity for Imbalanced Data Sets: Analysis of SMOTE -Based Oversampling and Evolutio- nary Undersampling,” Soft Computing, Vol. 15, 2011, pp. 1909-1936. http://dx.doi.org/10.1007/s00500-010-0625-8 [11] H. Han, W. Y. Wang and B. H. Mao, “Borderline- SMOTE: A New Over-Sampling Method in Imbalanced Data Sets Learning,” International Conference on Intelli- gent Computing, 2005, pp. 878-887. [12] G. Raghava, “Evaluation of MHC Binding Peptide Pre- diction Algorithms”. http://www.imtech.res.in/raghava/mhcbench |