

Paper Menu >>
Journal Menu >>
 Open Journal of Applied Sciences, 2013, 3, 514-518 Published Online December 2013 (http://www.scirp.org/journal/ojapps) http://dx.doi.org/10.4236/ojapps.2013.38060 Open Access OJAppS Measurements of Natural Radioactivity in Some Granite Samples Using Alpha Spectrometric Analysis Hanan Mohamed Diab1, Mohamed Helmy Eweis Monged1, Mahmoud Khattab2 1Egyptian Nuclear and Radiological Regulatory Authority, Cairo, Egypt 2Nuclear Materials Authority, Cairo, Egypt Email: [email protected], [email protected] Received September 12, 2013; revised October 13, 2013; accepted October 21, 2013 Copyright © 2013 Hanan Mohamed Diab et al. This is an open access article distributed under the Creative Commons Attribution License, which permits unrestricted use, distribution, and reproduction in any medium, provided the original work is properly cited. In accordance of the Creative Commons Attribution License all Copyrights © 2013 are reserved for SCIRP and the owner of the intellectual property Hanan Mohamed Diab et al. All Copyright © 2013 are guarded by law and by SCIRP as a guardian. ABSTRACT Alpha spectrometry using pulse height analysis has been used for the determination of uranium concentrations in dif- ferent environmental samples. The concentration of 238U was measured by both destructive and non-destructive tech- niques with a detection limit of less than 1.8 mBq/kg. However, because of the extremely low 234U concentrations in environmental samples, it was necessary to use a destructive technique to separate U from the sample matrices as well as remove interfering elements from the sample solution to determine 238U/234U ratio. In this study, the uranium was separated from the environmental samples using anion exchangers in (Dowex 1 × 8 Cl− form) and purified via co-pre- cipitation with Lanthanum fluorides (LaF3) and the alpha source prepared by electrodeposition. The results obtained were validated using some certified reference samples. Keywords: Uranium Separation; α-Spectrometry; Alpha Pulse Height Analysis Isotopic Ratio; Granite Samples 1. Introduction Uranium is a widely distributed lithophile metallic ele- ment. It may be present as a significant constituent in some minerals (e.g. uraninite, brannerite and carnotite) or as an accessory element in others (e.g. zircon, apatite, allanite and monazite). The natural uranium consists of three radioisotopes; 238U, 235U and 234U with atomic abun- dances of approximately 99.275%, 0.72%, and 0.0055% respectively. All three isotopes comprise the natural ura- nium and have the same geochemical behavior [1]. The uranium concentration and U-isotopic ratios are usually detected and determined in various environmental, sam- ples by different non-destructive and destructive tech- niques. The non-destructive techniques are mostly achieved by γ-spectrometry (e.g. NaI- and HPGe-detectors). They are carried out on the bulk samples without the need for complicated and time consuming radiochemical separa- tions methods [2,3]. Moreover, the destructive techniques are carried out through several analytical methods (e.g. α-spectrometry, fluorimetry, kinetic phosphorescence, neutron activation analysis, etc). Among these techniques, α-spectrometry is the most common one that measures radioisotopes and can detect low uranium concentrations (below ng1−1). Its detection limit is typically 100 to 1000 times lower than γ-spectrometry [4]. This technique is mostly used for detection and analysis of U as well as Th radioisotopes, particularly in the environmental samples, such as natural waters, which are characterized with low radioactivity concentration levels [3,5]. The procedure for alpha spectrometry is carried out through several steps including sample preparation, ra- diochemical separation, preparation of a thin alpha source, such as via electro-deposition or co-precipitation, and α- counting employing high-resolution pulse height analysis [6-9]. Sample preparation aims to convert the sample into a thin layered, chemically isolated form that can be placed into the spectrometer and counted with a minimum alpha particle energy interferences and self absorption, and alpha peak broadening due to energy straggling with thick sources. It is often an extensive process and requires several steps including: 1) sample digestion (preliminary treatment); 2) uranium separation and purification 3) alpha source prepa- ration, and 4) alpha counting over extended periods for low detection limits. The uranium separation is usually 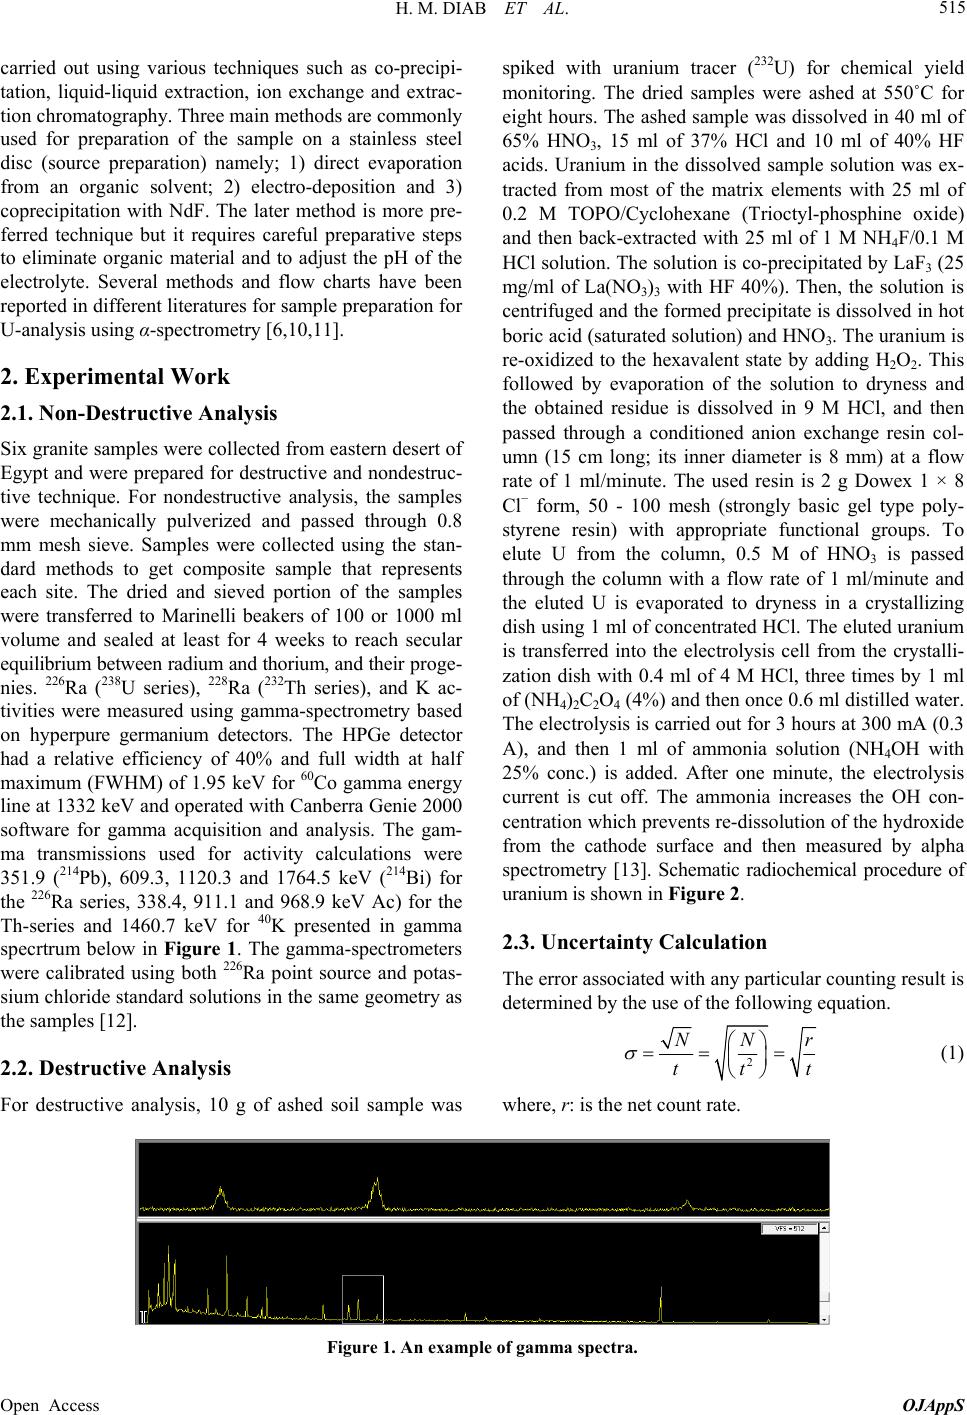 H. M. DIAB ET AL. 515 carried out using various techniques such as co-precipi- tation, liquid-liquid extraction, ion exchange and extrac- tion chromatography. Three main methods are commonly used for preparation of the sample on a stainless steel disc (source preparation) namely; 1) direct evaporation from an organic solvent; 2) electro-deposition and 3) coprecipitation with NdF. The later method is more pre- ferred technique but it requires careful preparative steps to eliminate organic material and to adjust the pH of the electrolyte. Several methods and flow charts have been reported in different literatures for sample preparation for U-analysis using α-spectrometry [6,10,11]. 2. Experimental Work 2.1. Non-Destructive Analysis Six granite samples were collected from eastern desert of Egypt and were prepared for destructive and nondestruc- tive technique. For nondestructive analysis, the samples were mechanically pulverized and passed through 0.8 mm mesh sieve. Samples were collected using the stan- dard methods to get composite sample that represents each site. The dried and sieved portion of the samples were transferred to Marinelli beakers of 100 or 1000 ml volume and sealed at least for 4 weeks to reach secular equilibrium between radium and thorium, and their proge- nies. 226Ra (238U series), 228Ra (232Th series), and K ac- tivities were measured using gamma-spectrometry based on hyperpure germanium detectors. The HPGe detector had a relative efficiency of 40% and full width at half maximum (FWHM) of 1.95 keV for 60Co gamma energy line at 1332 keV and operated with Canberra Genie 2000 software for gamma acquisition and analysis. The gam- ma transmissions used for activity calculations were 351.9 (214Pb), 609.3, 1120.3 and 1764.5 keV (214Bi) for the 226Ra series, 338.4, 911.1 and 968.9 keV Ac) for the Th-series and 1460.7 keV for 40K presented in gamma specrtrum below in Figure 1. The gamma-spectrometers were calibrated using both 226Ra point source and potas- sium chloride standard solutions in the same geometry as the samples [12]. 2.2. Destructive Analysis For destructive analysis, 10 g of ashed soil sample was spiked with uranium tracer (232U) for chemical yield monitoring. The dried samples were ashed at 550˚C for eight hours. The ashed sample was dissolved in 40 ml of 65% HNO3, 15 ml of 37% HCl and 10 ml of 40% HF acids. Uranium in the dissolved sample solution was ex- tracted from most of the matrix elements with 25 ml of 0.2 M TOPO/Cyclohexane (Trioctyl-phosphine oxide) and then back-extracted with 25 ml of 1 M NH4F/0.1 M HCl solution. The solution is co-precipitated by LaF3 (25 mg/ml of La(NO3)3 with HF 40%). Then, the solution is centrifuged and the formed precipitate is dissolved in hot boric acid (saturated solution) and HNO3. The uranium is re-oxidized to the hexavalent state by adding H2O2. This followed by evaporation of the solution to dryness and the obtained residue is dissolved in 9 M HCl, and then passed through a conditioned anion exchange resin col- umn (15 cm long; its inner diameter is 8 mm) at a flow rate of 1 ml/minute. The used resin is 2 g Dowex 1 × 8 Cl− form, 50 - 100 mesh (strongly basic gel type poly- styrene resin) with appropriate functional groups. To elute U from the column, 0.5 M of HNO3 is passed through the column with a flow rate of 1 ml/minute and the eluted U is evaporated to dryness in a crystallizing dish using 1 ml of concentrated HCl. The eluted uranium is transferred into the electrolysis cell from the crystalli- zation dish with 0.4 ml of 4 M HCl, three times by 1 ml of (NH4)2C2O4 (4%) and then once 0.6 ml distilled water. The electrolysis is carried out for 3 hours at 300 mA (0.3 A), and then 1 ml of ammonia solution (NH4OH with 25% conc.) is added. After one minute, the electrolysis current is cut off. The ammonia increases the OH con- centration which prevents re-dissolution of the hydroxide from the cathode surface and then measured by alpha spectrometry [13]. Schematic radiochemical procedure of uranium is shown in Figure 2. 2.3. Uncertainty Calculation The error associated with any particular counting result is determined by the use of the following equation. 2 NN tt t r (1) where, r: is the net count rate. Figure 1. An example of gamma spectra. Open Access OJAppS 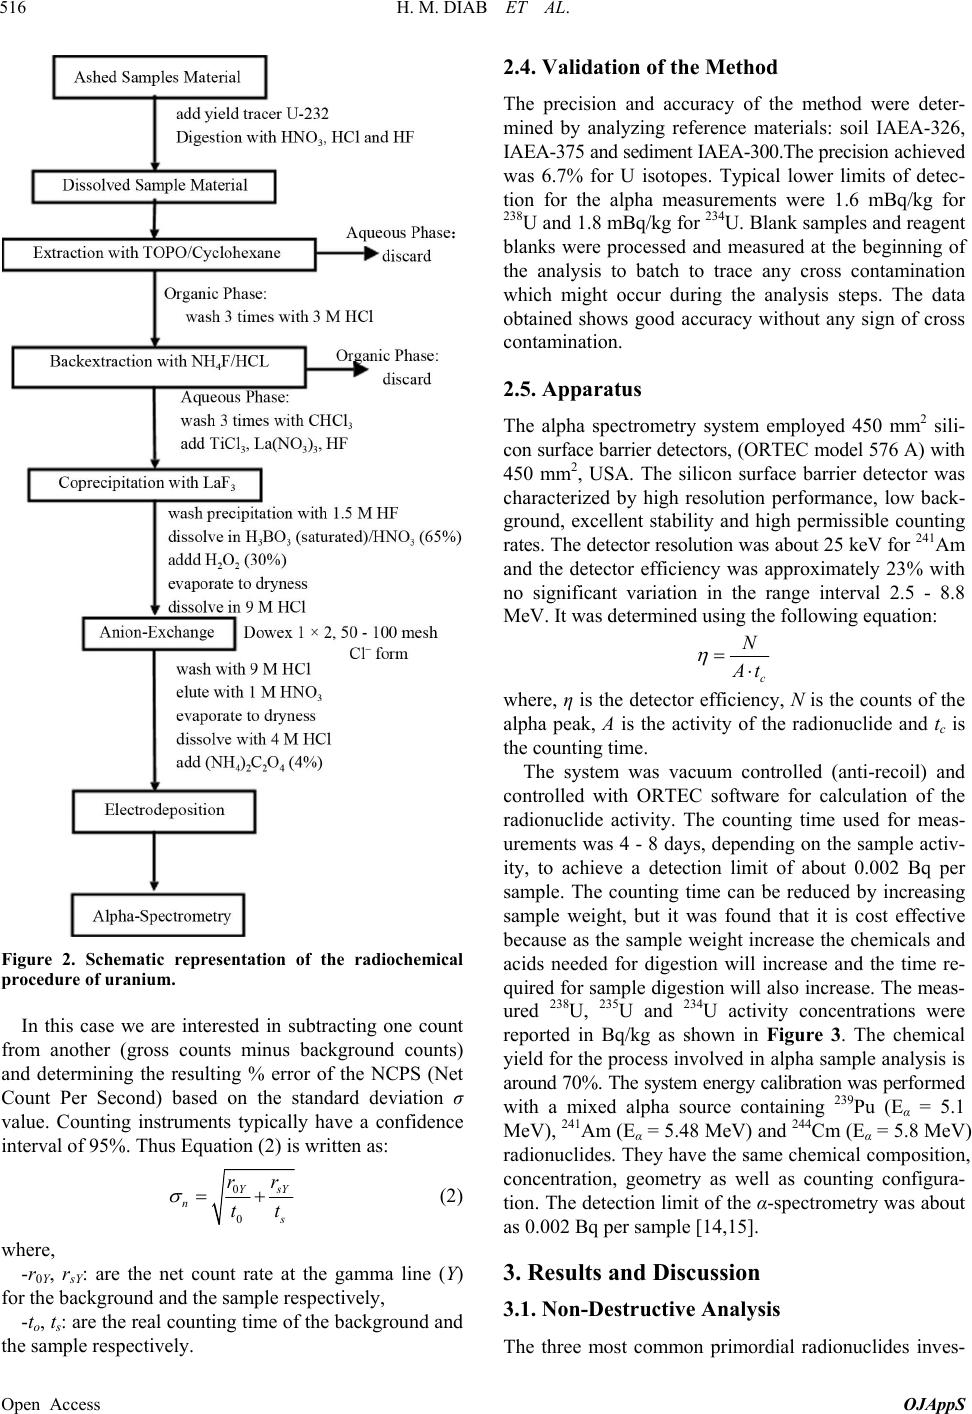 H. M. DIAB ET AL. 516 Figure 2. Schematic representation of the radiochemical procedure of uranium. In this case we are interested in subtracting one count from another (gross counts minus background counts) and determining the resulting % error of the NCPS (Net Count Per Second) based on the standard deviation σ value. Counting instruments typically have a confidence interval of 95%. Thus Equation (2) is written as: 0 0 YsY n s rr tt (2) where, -r0Y, rsY : are the net count rate at the gamma line (Y) for the background and the sample respectively, -to, ts: are the real counting time of the background and the sample respectively. 2.4. Validation of the Method The precision and accuracy of the method were deter- mined by analyzing reference materials: soil IAEA-326, IAEA-375 and sediment IAEA-300.The precision achieved was 6.7% for U isotopes. Typical lower limits of detec- tion for the alpha measurements were 1.6 mBq/kg for 238U and 1.8 mBq/kg for 234U. Blank samples and reagent blanks were processed and measured at the beginning of the analysis to batch to trace any cross contamination which might occur during the analysis steps. The data obtained shows good accuracy without any sign of cross contamination. 2.5. Apparatus The alpha spectrometry system employed 450 mm2 sili- con surface barrier detectors, (ORTEC model 576 A) with 450 mm2, USA. The silicon surface barrier detector was characterized by high resolution performance, low back- ground, excellent stability and high permissible counting rates. The detector resolution was about 25 keV for 241Am and the detector efficiency was approximately 23% with no significant variation in the range interval 2.5 - 8.8 MeV. It was determined using the following equation: c N A t where, η is the detector efficiency, N is the counts of the alpha peak, A is the activity of the radionuclide and tc is the counting time. The system was vacuum controlled (anti-recoil) and controlled with ORTEC software for calculation of the radionuclide activity. The counting time used for meas- urements was 4 - 8 days, depending on the sample activ- ity, to achieve a detection limit of about 0.002 Bq per sample. The counting time can be reduced by increasing sample weight, but it was found that it is cost effective because as the sample weight increase the chemicals and acids needed for digestion will increase and the time re- quired for sample digestion will also increase. The meas- ured 238U, 235U and 234U activity concentrations were reported in Bq/kg as shown in Figure 3. The chemical yield for the process involved in alpha sample analysis is around 70%. The system energy calibration was performed with a mixed alpha source containing 239Pu (Eα = 5.1 MeV), 241Am (Eα = 5.48 MeV) and 244Cm (Eα = 5.8 MeV) radionuclides. They have the same chemical composition, concentration, geometry as well as counting configura- tion. The detection limit of the α-spectrometry was about as 0.002 Bq per sample [14,15]. 3. Results and Discussion 3.1. Non-Destructive Analysis The three most common primordial radionuclides inves- Open Access OJAppS 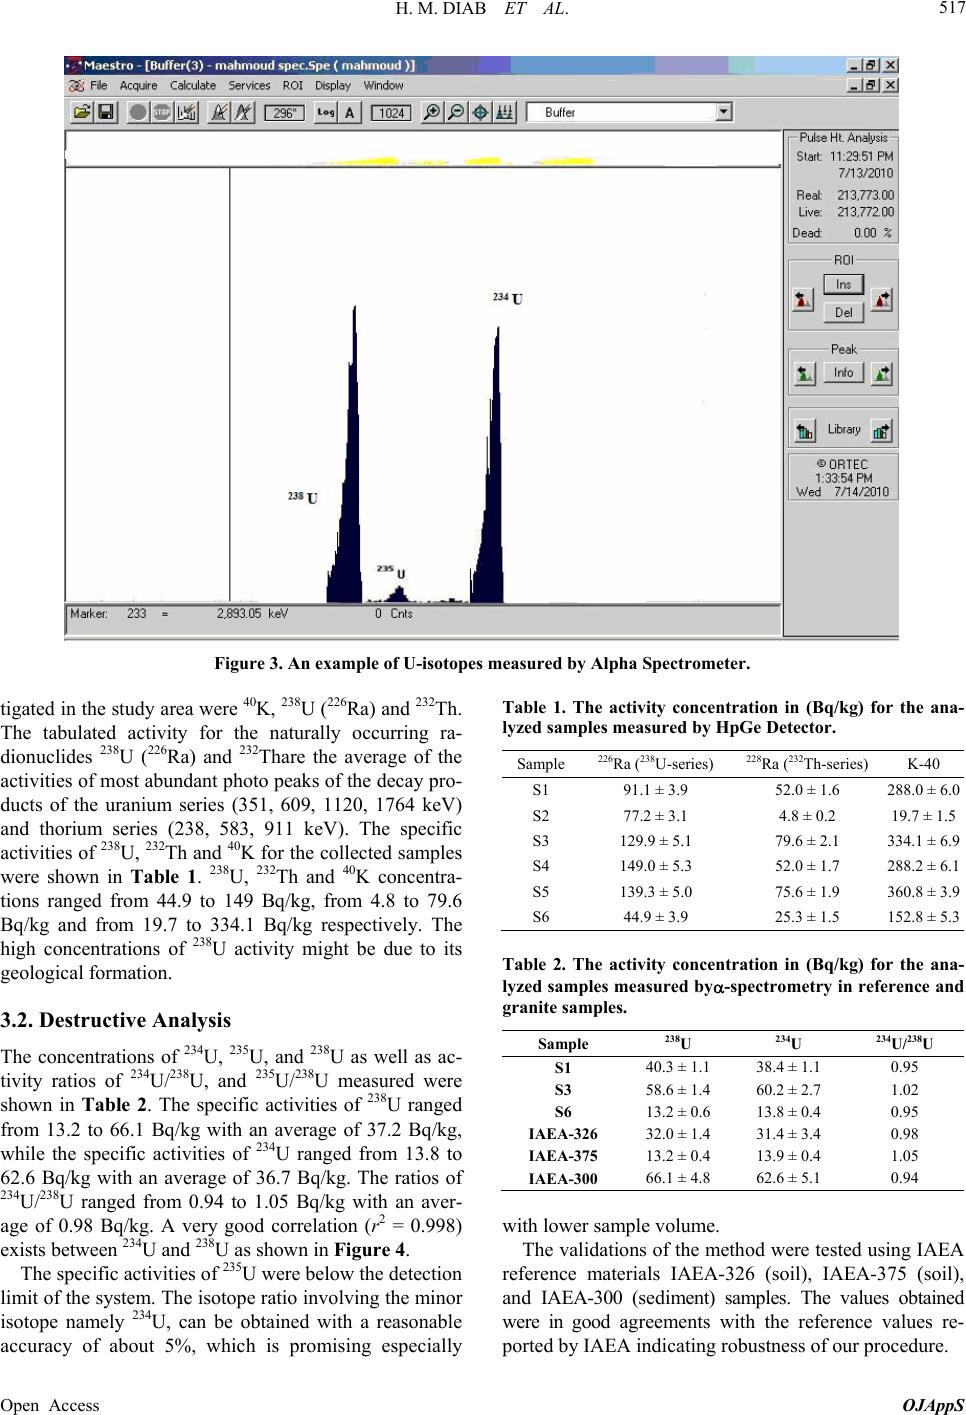 H. M. DIAB ET AL. 517 Figure 3. An example of U-isotopes measured by Alpha Spectrometer. tigated in the study area were K, U (Ra) and Th. 3.2. Destructive Analysis 5U, and 238U as well as ac- ction lim Table 1. The activity concentration in (Bq/kg) for the ana- 40 238226232 The tabulated activity for the naturally occurring ra- dionuclides 238U (226Ra) and 232Thare the average of the activities of most abundant photo peaks of the decay pro- ducts of the uranium series (351, 609, 1120, 1764 keV) and thorium series (238, 583, 911 keV). The specific activities of 238U, 232Th and 40K for the collected samples were shown in Table 1. 238U, 232Th and 40K concentra- tions ranged from 44.9 to 149 Bq/kg, from 4.8 to 79.6 Bq/kg and from 19.7 to 334.1 Bq/kg respectively. The high concentrations of 238U activity might be due to its geological formation. The concentrations of 234U, 23 tivity ratios of 234U/238U, and 235U/238U measured were shown in Table 2. The specific activities of 238U ranged from 13.2 to 66.1 Bq/kg with an average of 37.2 Bq/kg, while the specific activities of 234U ranged from 13.8 to 62.6 Bq/kg with an average of 36.7 Bq/kg. The ratios of 234U/238U ranged from 0.94 to 1.05 Bq/kg with an aver- age of 0.98 Bq/kg. A very good correlation (r2 = 0.998) exists between 234U and 238U as shown in Figure 4. The specific activities of 235U were below the dete it of the system. The isotope ratio involving the minor isotope namely 234U, can be obtained with a reasonable accuracy of about 5%, which is promising especially lyzed samples measured by HpGe Detector. Sample 226Ra (238U-series) 228Ra (232Th-series) K-40 S1 91.1 ± 3.9 52.0 ± 1.6 288.0 ± 6.0 S2 77.2 ± 3.1 4.8 ± 0.2 195.7 ± 1. S3 129.9 ± 5.1 79.6 ± 2.1 334.1 ± 6.9 S4 149.0 ± 5.3 52.0 ± 1.7 288.2 ± 6.1 S5 139.3 ± 5.0 75.6 ± 1.9 360.8 ± 3.9 S6 44.9 ± 3.9 25.3 ± 1.5 152.8 ± 5.3 Table 2. The acentratiog) fo lyzed samples measured by-ectrometry in reference and ctivity conn in (Bq/kr the ana- sp granite samples. Sample 238U 234U 234U/238U S1 40.3 ± 1.1 38.4 ± 1.1 0.95 S3 58.4 60..7 IAE IAE 6 ± 1.2 ± 21.02 S6 13.2 ± 0.6 13.8 ± 0.4 0.95 A-326 32.0 ± 1.4 31.4 ± 3.4 0.98 A-375 13.2 ± 0.4 13.9 ± 0.4 1.05 IAEA-300 66.1 ± 4.8 62.6 ± 5.1 0.94 wimpl The validations of the meod were tested using IAEA 26 (soil), IAEA-375 (soil), an th lower sae volume. th reference materials IAEA-3 d IAEA-300 (sediment) samples. The values obtained were in good agreements with the reference values re- ported by IAEA indicating robustness of our procedure. Open Access OJAppS 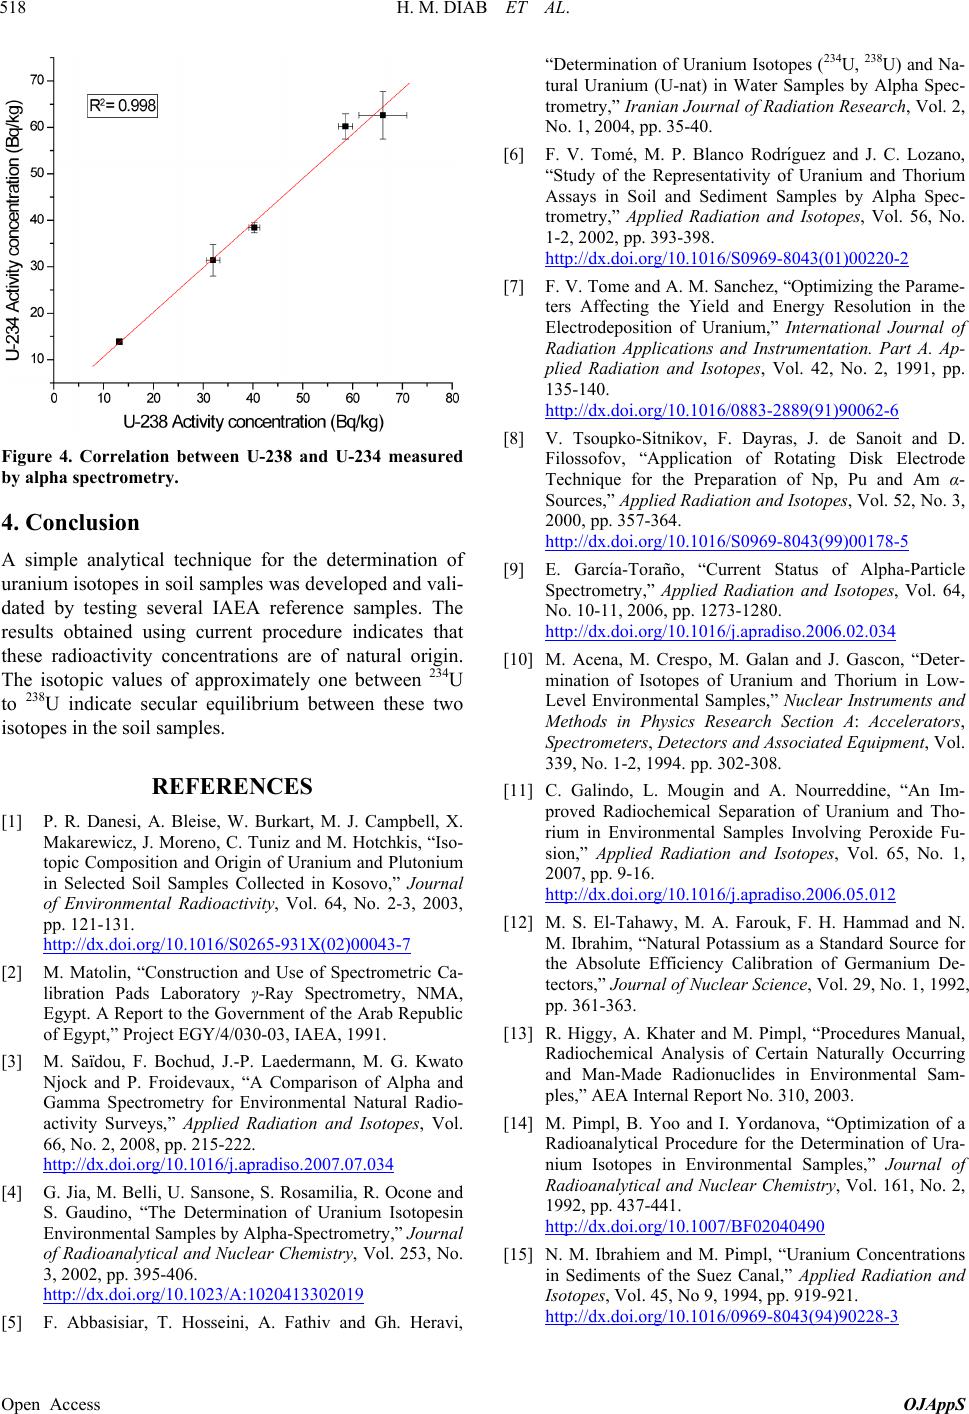 H. M. DIAB ET AL. 518 Figure 4. Correlation between U-238 and U-234 measured by alpha spectrometry. al technique for the determination of soil samples was developed and NCES [1] P. R. Danesi, . J. Campb Makarewicz, J.M. Hotchkis, “Iso- 4. Conclusion A simple analytic uranium isotopes invali- dated by testing several IAEA reference samples. The results obtained using current procedure indicates that these radioactivity concentrations are of natural origin. The isotopic values of approximately one between 234U to 238U indicate secular equilibrium between these two isotopes in the soil samples. REFERE A. Bleise, W. Burkart, M Moreno, C. Tuniz and ell, X. topic Composition and Origin of Uranium and Plutonium in Selected Soil Samples Collected in Kosovo,” Journal of Environmental Radioactivity, Vol. 64, No. 2-3, 2003, pp. 121-131. http://dx.doi.org/10.1016/S0265-931X(02)00043-7 [2] M. Matolin, “ libration Pads Laboratory γ-Ray Spectrometry, N Construction and Use of Spectrometric Ca- MA, lpha and Egypt. A Report to the Government of the Arab Republic of Egypt,” Project EGY/4/030-03, IAEA, 1991. [3] M. Saïdou, F. Bochud, J.-P. Laedermann, M. G. Kwato Njock and P. Froidevaux, “A Comparison of A Gamma Spectrometry for Environmental Natural Radio- activity Surveys,” Applied Radiation and Isotopes, Vol. 66, No. 2, 2008, pp. 215-222. http://dx.doi.org/10.1016/j.apradiso.2007.07.034 [4] G. Jia, M. Belli, U. Sansone, S S. Gaudino, “The Determination of Uranium Is . Rosamilia, R. Ocone and otopesin Environmental Samples by Alpha-Spectrometry,” Journal of Radioanalytical and Nuclear Chemistry, Vol. 253, No. 3, 2002, pp. 395-406. http://dx.doi.org/10.1023/A:1020413302019 [5] F. Abbasisiar, T. Hosseini, A. Fathiv and Gh. Heravi, co Rodrı́guez and J. C. Lozano, /S0969-8043(01)00220-2 “Determination of Uranium Isotopes (234U, 238U) and Na- tural Uranium (U-nat) in Water Samples by Alpha Spec- trometry,” Iranian Journal of Radiation Research, Vol. 2, No. 1, 2004, pp. 35-40. [6] F. V. Tomé, M. P. Blan “Study of the Representativity of Uranium and Thorium Assays in Soil and Sediment Samples by Alpha Spec- trometry,” Applied Radiation and Isotopes, Vol. 56, No. 1-2, 2002, pp. 393-398. http://dx.doi.org/10.1016 rame- .org/10.1016/0883-2889(91)90062-6 [7] F. V. Tome and A. M. Sanchez, “Optimizing the Pa ters Affecting the Yield and Energy Resolution in the Electrodeposition of Uranium,” International Journal of Radiation Applications and Instrumentation. Part A. Ap- plied Radiation and Isotopes, Vol. 42, No. 2, 1991, pp. 135-140. http://dx.doi and D. 016/S0969-8043(99)00178-5 [8] V. Tsoupko-Sitnikov, F. Dayras, J. de Sanoit Filossofov, “Application of Rotating Disk Electrode Technique for the Preparation of Np, Pu and Am α- Sources,” Applied Radiation and Isotopes, Vol. 52, No. 3, 2000, pp. 357-364. http://dx.doi.org/10.1 article o.2006.02.034 [9] E. García-Toraño, “Current Status of Alpha-P Spectrometry,” Applied Radiation and Isotopes, Vol. 64, No. 10-11, 2006, pp. 1273-1280. http://dx.doi.org/10.1016/j.apradis Deter- An Im- /10.1016/j.apradiso.2006.05.012 [10] M. Acena, M. Crespo, M. Galan and J. Gascon, “ mination of Isotopes of Uranium and Thorium in Low- Level Environmental Samples,” Nuclear Instruments and Methods in Physics Research Section A: Accelerators, Spectrometers, Detectors and Associated Equipment, Vol. 339, No. 1-2, 1994. pp. 302-308. [11] C. Galindo, L. Mougin and A. Nourreddine, “ proved Radiochemical Separation of Uranium and Tho- rium in Environmental Samples Involving Peroxide Fu- sion,” Applied Radiation and Isotopes, Vol. 65, No. 1, 2007, pp. 9-16. http://dx.doi.org and N. Khater and M. Pimpl, “Procedures Manual, mization of a 007/BF02040490 [12] M. S. El-Tahawy, M. A. Farouk, F. H. Hammad M. Ibrahim, “Natural Potassium as a Standard Source for the Absolute Efficiency Calibration of Germanium De- tectors,” Journal of Nuclear Science, Vol. 29, No. 1, 1992, pp. 361-363. [13] R. Higgy, A. Radiochemical Analysis of Certain Naturally Occurring and Man-Made Radionuclides in Environmental Sam- ples,” AEA Internal Report No. 310, 2003. [14] M. Pimpl, B. Yoo and I. Yordanova, “Opti Radioanalytical Procedure for the Determination of Ura- nium Isotopes in Environmental Samples,” Journal of Radioanalytical and Nuclear Chemistry, Vol. 161, No. 2, 1992, pp. 437-441. http://dx.doi.org/10.1 m Concentrations 8-3 [15] N. M. Ibrahiem and M. Pimpl, “Uraniu in Sediments of the Suez Canal,” Applied Radiation and Isotopes, Vol. 45, No 9, 1994, pp. 919-921. http://dx.doi.org/10.1016/0969-8043(94)9022 Open Access OJAppS |