

Paper Menu >>
Journal Menu >>
 Advances in Biological Chemistry, 2013, 3, 556-563 ABC http://dx.doi.org/10.4236/abc.2013.36064 Published Online December 2013 (http://www.scirp.org/journal/abc/) Proposal for a new evaluation of phagocytosis using different sizes of fluorescent polystyrene microspheres Riyo Enomoto1,2, Makoto Imamori1, Ayoumi Seon1, Kozue Yoshida1, Aya Furue1, Hirofumi Tsuruda1, Eibai Lee-Hiraiwa1,2* 1Laboratory of Pharmacology, Faculty of Pharmaceutical Sciences, Kobe Gakuin University, Kobe, Japan 2Cooperative Research Center of Life Sciences, Kobe Gakuin University, Kobe, Japan Email: *[email protected] Received 25 September 2013; revised 26 October 2013; accepted 18 November 2013 Copyright © 2013 Riyo Enomoto et al. This is an open access article distributed under the Creative Commons Attribution License, which permits unrestricted use, distribution, and reproduction in any medium, provided the original work is properly cited. ABSTRACT To investigate phagocytosis, peritoneal-resident and J774.1 macrophages were incubated with fluorescent polystyrene microspheres measuring 1.0 μm in diam- ter at 200 particles per cell. The amount of phago- cytized microspheres increased with incubation time, and both cell types had similar phagocytic activity. Further, we investigated the phagocytosis of different sizes of microspheres by J774.1 macrophages. To adequately evaluate phagocytosis, varying amounts of different sizes of microspheres were added to J774.1 cells, and their phagocytic activities were evaluated. When the microspheres were added at a density of 20 particles per cell, few small microspheres (<1.0 µm in diameter) were phagocytized. This result suggested that their low amount caused difficulty in evaluating phagocytosis. In contrast, when the same variety of microspheres was added at a density of 200 particles per cell, phagocytosis of large microspheres (>3 µm in diameter) could not be evaluated because of cytotox- icity. Thus, the amount of different sizes of micro- spheres added is important for precisely evaluating phagocytic activity. When the amount of different sizes of microspheres added was standardized to pro- vide a set amount of total surface area, phagocytosis of these microspheres could be adequately evaluated and compared. To determine the effects of phagocy- tosis on cell viability and proliferation, cells incubated with different sizes of microspheres were assayed us- ing a cell counting kit. We found that phagocytosis had no effect on cell viability or proliferation and was independent of particle size. Furthermore, cells al- ready phagocytized microspheres retained their pha- gocytic activity. Keywords: Macrophage; Phagocytosis; Polystyrene Microsphere; Total Surface Area 1. INTRODUCTION Dying cells [1-5] or foreign materials [6] are rapidly re- moved in vivo, both by neighboring tissue cells and professional phagocytes such as macrophages and den- dritic cells. Recently, micron-, submicron-, and nano- scale particles composed of various materials have been used as delivery devices for living cells or tissues. Most of these artificial particles are also phagocytized by macrophages present in tissues or organs throughout the body [7,8], especially, particles with a negative charge are recognized via scavenger receptors and phagocytized by macrophages. Phagocytosis by macrophages has often been investi- gated using fluorescent polystyrene microspheres. Ma- crophage activity is generally evaluated by measuring the number of phagocytized microspheres. Because the num- ber of microspheres phagocytized increases in proportion to the number added to cultures, experimental conditions are very important in accurately evaluating phagocytic activity. However, currently, researchers set their own original criteria for the addition of microspheres and evaluation of phagocytosis because no standardized con- ditions for such assays have been determined. This situ- ation complicates the interpretation and comparison of related data in many reports concerning phagocytosis. Currently, microspheres are often added in any amount or weight per culture area for the evaluation of pha- gocytosis, but these conditions are presumably unsuitable for the addition of extremely large or small microspheres or those having different specific gravities. The recent developments of new materials and nano-scale tech- nologies are key components in the field of delivery devices. Thus, new standardized conditions that are *Corresponding author. OPEN ACCESS  R. Enomoto et al. / Advances in Biological Chemistry 3 (2013) 556-563 557 widely applicable are necessary for the evaluation of phagocytosis. Thus, in this study, we developed new standardized conditions for the addition of microspheres. Furthermore, we assessed cell viability and cell activity of macrophages after phagocytosis using these stan- dardized conditions. 2. MATERIALS AND METHODS 2.1. Microsphere Various sizes of Fluoresbrite® yellow–green fluorescent polystyrene microspheres were purchased from Poly- sciences Inc. (Warrington, PA). FluoSphere®-red fluo- rescent 1.0-µm microspheres were purchased from Mole- cular probes/Life Technologies (Grand Island, NY). Dia- meter coefficient of variation (CV) of each microsphere was 3% to 10%. All experiments were conducted with carboxylate-modified microspheres. 2.2. Cell Culture Peritoneal resident macrophages were harvested from 12-14-week-old female Wistar rats and suspended in RPMI 1640 medium (Nacalai Tesque, Kyoto, Japan) sup- plemented with 10% fetal bovine serum (FBS) (Biowest, Tokyo, Japan). J774.1 macrophages were maintained in in 100-mm plastic dishes containing the same medium. When the cells reached 70% - 80% confluence, they were subcultured and passaged into new 12- or 96-well plastic plates or chamber slides and precultured at 37˚C in an atmosphere of 5% CO2 in air. 2.3. Addition of Microspheres to Macrophages The cells were plated into 12-well plates (8 × 10⁴ cells/ well) and pre-cultured for 2 days (until 70% - 80% con- fluent, approximately 2 × 10⁵ cells/well). The micro- spheres were suspended in RPMI 1640 medium con- taining 10% FBS, and the suspension was added to the cells. We evaluated phagocytosis using 1.0 μm micro- spheres (4 × 10⁷ particles/well, 200 particles per cell). When we measured phagocytosis of other sizes of micro- spheres, we compensated by adjusting for total volume or total surface area in relation to the size of the micro- spheres and amount added. The amount of microspheres of each size added to the cells is shown in Table 1. Upper section of Table 1 shows conditions standardized for volume; the amount of microspheres of each size added was calculated so that the total volume of added microspheres of each size was equal to the total volume of 1.0 μm microspheres used. Lower section of Table 1 shows conditions standardized for surface area. The amount of microspheres of each size added was calcula- ted so that the total surface area of added microspheres of each size was equal to the total surface area of the 1.0 Table 1. Amount ratios of fluorescent microspheres to cells corrected by volume and surface area. Diameter (μm)Volume (πμm3) Factor Cell: Microsphere 0.1 0.00017 ×1000 1:200000 0.2 0.0013 ×125 1:25000 0.5 0.021 ×8.0 1:1600 1.0* 0.167 ×1.0 1:200 2.0 1.33 ×0.125 1:25 3.0 4.50 ×0.037 1:7 6.0 36.0 ×0.005 1:1 Diameter (μm)Surface area (πμm2) Factor Cell: Microsphere 0.1 0.01 ×100 1:20000 0.2 0.04 ×25 1:5000 0.5 0.25 ×4.0 1:800 1.0* 1.0 × 1.0 1:200 2.0 4.0 ×0.250 1:50 3.0 9.0 ×0.111 1:22 6.0 36.0 ×0.028 1:6 *We used this value as a base value. μm microspheres used. 2.4. Quantitative Evaluation of Phagocytosis The medium was removed from 12-well plates and the fluorescent microspheres dispersed in growth medium were added to the cultured cells. The cells were incu- bated at 37˚C in 5% CO2 for indicated times. At the end of the incubation period, cells were washed twice with phosphate buffered saline (PBS) to remove free micros- pheres and harvested by trypsinization. The harvested cells were suspended in PBS and analyzed by flow cyto- metry (FACSCanto, BD Biosciences, Franklin Lakes, NJ). Flow cytometry data are shown as fluorescent side- scatter dot plots. We gated each population of cells according to the amount of microspheres engulfed, from 0 to 4 or more, and calculated the percentage of cells in each population. 2.5. Morphological Observation of Phagocytosis Fluorescent microspheres were added to cells in chamber slides and incubated at 37˚C in an atmosphere of 5% CO2 for indicated times. At the end of the incubation pe- riod, cells were washed twice with PBS to remove free microspheres. Cells on glass chamber slides were di- rectly observed by confocal laser scanning microscopy (FV-1000D, Olympus). 2.6. Evaluation of Cytotoxicity and Proliferation Cells were plated in two 96-well plates (5 × 10³ cells/ well) and pre-cultured for 2 days (until approximately 50% confluent). Different sizes of fluorescent micro- spheres were added to the cells in varying amounts to Copyright © 2013 SciRes. OPEN ACCESS 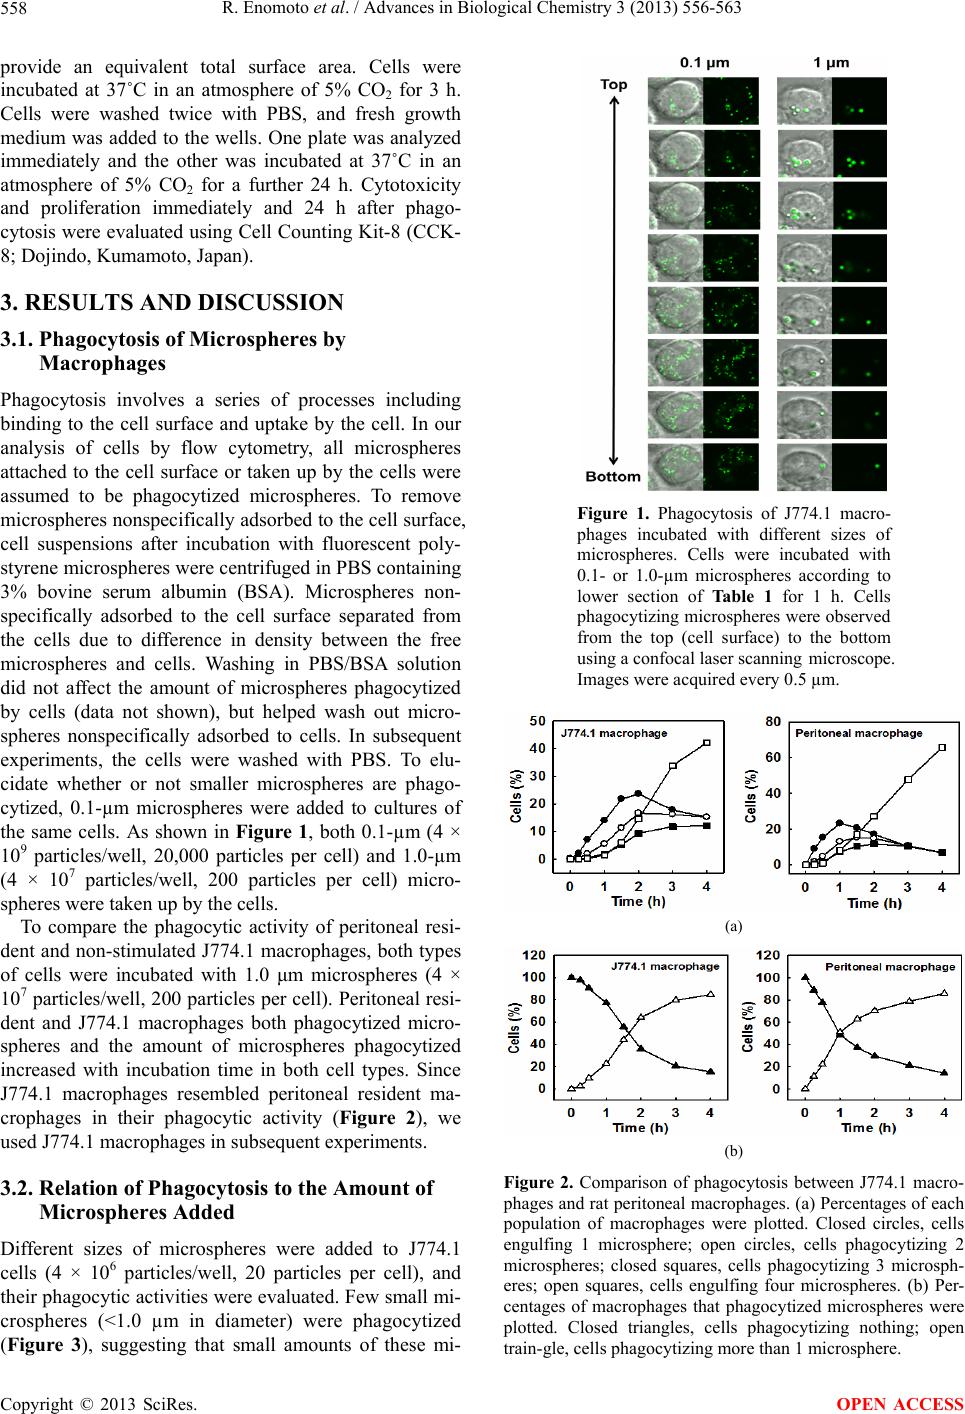 R. Enomoto et al. / Advances in Biological Chemistry 3 (2013) 556-563 558 provide an equivalent total surface area. Cells were incubated at 37˚C in an atmosphere of 5% CO2 for 3 h. Cells were washed twice with PBS, and fresh growth medium was added to the wells. One plate was analyzed immediately and the other was incubated at 37˚C in an atmosphere of 5% CO2 for a further 24 h. Cytotoxicity and proliferation immediately and 24 h after phago- cytosis were evaluated using Cell Counting Kit-8 (CCK- 8; Dojindo, Kumamoto, Japan). 3. RESULTS AND DISCUSSION 3.1. Phagocytosis of Microspheres by Macrophages Phagocytosis involves a series of processes including binding to the cell surface and uptake by the cell. In our analysis of cells by flow cytometry, all microspheres attached to the cell surface or taken up by the cells were assumed to be phagocytized microspheres. To remove microspheres nonspecifically adsorbed to the cell surface, cell suspensions after incubation with fluorescent poly- styrene microspheres were centrifuged in PBS containing 3% bovine serum albumin (BSA). Microspheres non- specifically adsorbed to the cell surface separated from the cells due to difference in density between the free microspheres and cells. Washing in PBS/BSA solution did not affect the amount of microspheres phagocytized by cells (data not shown), but helped wash out micro- spheres nonspecifically adsorbed to cells. In subsequent experiments, the cells were washed with PBS. To elu- cidate whether or not smaller microspheres are phago- cytized, 0.1-µm microspheres were added to cultures of the same cells. As shown in Figure 1, both 0.1-µm (4 × 10⁹ particles/well, 20,000 particles per cell) and 1.0-µm (4 × 10⁷ particles/well, 200 particles per cell) micro- spheres were taken up by the cells. To compare the phagocytic activity of peritoneal resi- dent and non-stimulated J774.1 macrophages, both types of cells were incubated with 1.0 μm microspheres (4 × 10⁷ particles/well, 200 particles per cell). Peritoneal resi- dent and J774.1 macrophages both phagocytized micro- spheres and the amount of microspheres phagocytized increased with incubation time in both cell types. Since J774.1 macrophages resembled peritoneal resident ma- crophages in their phagocytic activity (Figure 2), we used J774.1 macrophages in subsequent experiments. 3.2. Relation of Phagocytosis to the Amount of Microspheres Added Different sizes of microspheres were added to J774.1 cells (4 × 10⁶ particles/well, 20 particles per cell), and their phagocytic activities were evaluated. Few small mi- crospheres (<1.0 µm in diameter) were phagocytized (Figure 3), suggesting that small amounts of these mi- Figure 1. Phagocytosis of J774.1 macro- phages incubated with different sizes of microspheres. Cells were incubated with 0.1- or 1.0-µm microspheres according to lower section of Table 1 for 1 h. Cells phagocytizing microspheres were observed from the top (cell surface) to the bottom using a confocal laser scanning microscope. Images were acquired every 0.5 µm. (a) (b) Figure 2. Comparison of phagocytosis between J774.1 macro- phages and rat peritoneal macrophages. (a) Percentages of each population of macrophages were plotted. Closed circles, cells engulfing 1 microsphere; open circles, cells phagocytizing 2 microspheres; closed squares, cells phagocytizing 3 microsph- eres; open squares, cells engulfing four microspheres. (b) Per- centages of macrophages that phagocytized microspheres were plotted. Closed triangles, cells phagocytizing nothing; open train-gle, cells phagocytizing more than 1 microsphere. Copyright © 2013 SciRes. OPEN ACCESS 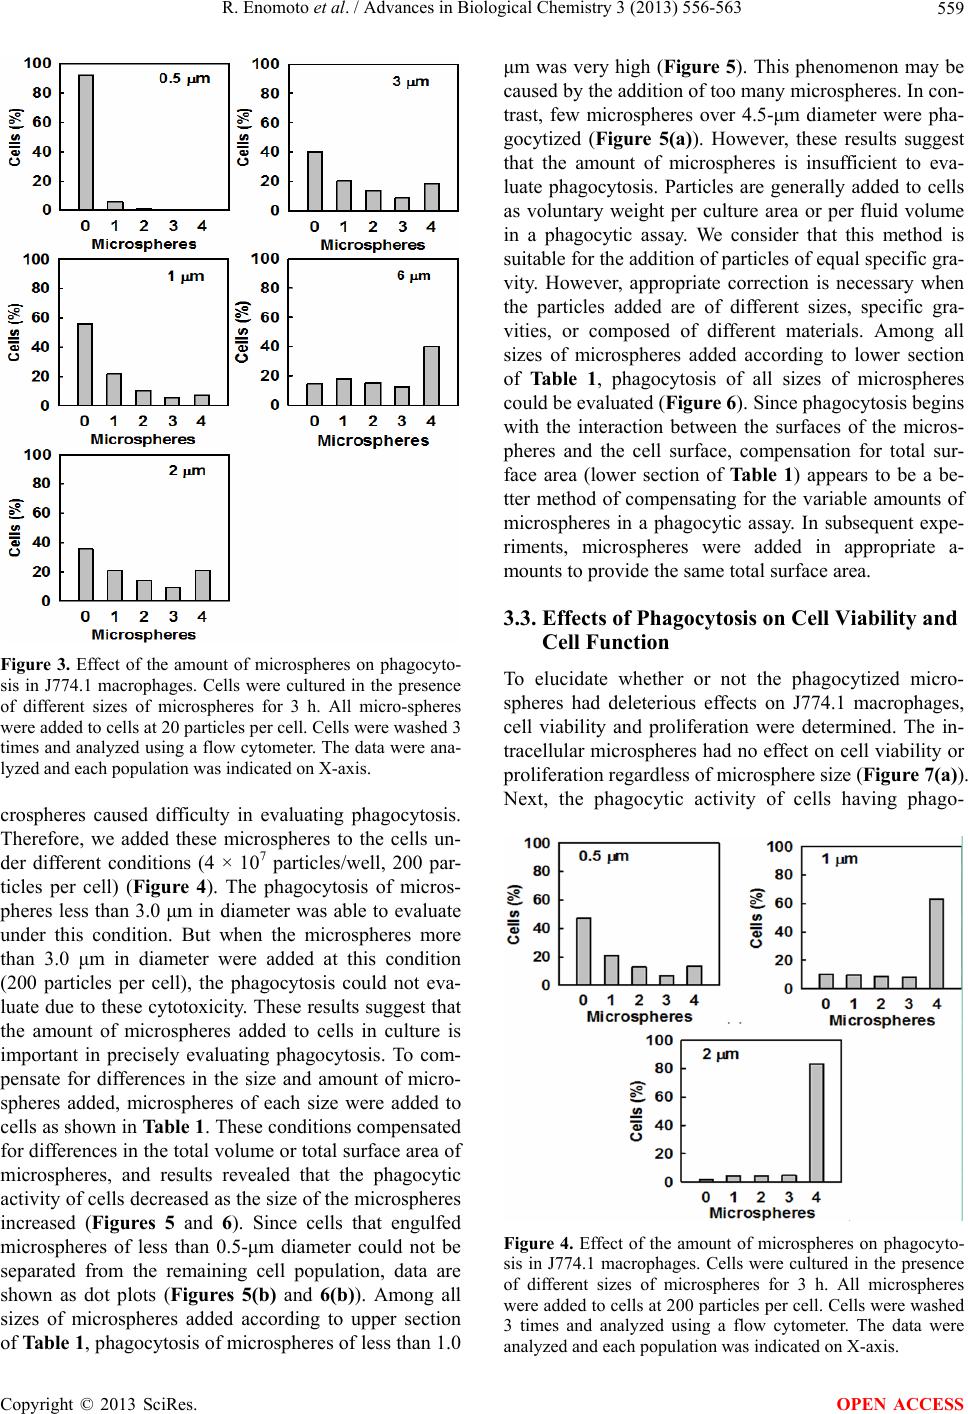 R. Enomoto et al. / Advances in Biological Chemistry 3 (2013) 556-563 559 Figure 3. Effect of the amount of microspheres on phagocyto- sis in J774.1 macrophages. Cells were cultured in the presence of different sizes of microspheres for 3 h. All micro-spheres were added to cells at 20 particles per cell. Cells were washed 3 times and analyzed using a flow cytometer. The data were ana- lyzed and each population was indicated on X-axis. crospheres caused difficulty in evaluating phagocytosis. Therefore, we added these microspheres to the cells un- der different conditions (4 × 10⁷ particles/well, 200 par- ticles per cell) (Figure 4). The phagocytosis of micros- pheres less than 3.0 μm in diameter was able to evaluate under this condition. But when the microspheres more than 3.0 μm in diameter were added at this condition (200 particles per cell), the phagocytosis could not eva- luate due to these cytotoxicity. These results suggest that the amount of microspheres added to cells in culture is important in precisely evaluating phagocytosis. To com- pensate for differences in the size and amount of micro- spheres added, microspheres of each size were added to cells as shown in Table 1. These conditions compensated for differences in the total volume or total surface area of microspheres, and results revealed that the phagocytic activity of cells decreased as the size of the microspheres increased (Figures 5 and 6). Since cells that engulfed microspheres of less than 0.5-μm diameter could not be separated from the remaining cell population, data are shown as dot plots (Figures 5(b) and 6(b)). Among all sizes of microspheres added according to upper section of Table 1, phagocytosis of microspheres of less than 1.0 μm was very high (Figure 5). This phenomenon may be caused by the addition of too many microspheres. In con- trast, few microspheres over 4.5-μm diameter were pha- gocytized (Figure 5(a)). However, these results suggest that the amount of microspheres is insufficient to eva- luate phagocytosis. Particles are generally added to cells as voluntary weight per culture area or per fluid volume in a phagocytic assay. We consider that this method is suitable for the addition of particles of equal specific gra- vity. However, appropriate correction is necessary when the particles added are of different sizes, specific gra- vities, or composed of different materials. Among all sizes of microspheres added according to lower section of Table 1, phagocytosis of all sizes of microspheres could be evaluated (Figure 6). Since phagocytosis begins with the interaction between the surfaces of the micros- pheres and the cell surface, compensation for total sur- face area (lower section of Table 1) appears to be a be- tter method of compensating for the variable amounts of microspheres in a phagocytic assay. In subsequent expe- riments, microspheres were added in appropriate a- mounts to provide the same total surface area. 3.3. Effects of Phagocytosis on Cell Viability and Cell Function To elucidate whether or not the phagocytized micro- spheres had deleterious effects on J774.1 macrophages, cell viability and proliferation were determined. The in- tracellular microspheres had no effect on cell viability or proliferation regardless of microsphere size (Figure 7(a)). Next, the phagocytic activity of cells having phago- Figure 4. Effect of the amount of microspheres on phagocyto- sis in J774.1 macrophages. Cells were cultured in the presence of different sizes of microspheres for 3 h. All microspheres were added to cells at 200 particles per cell. Cells were washed 3 times and analyzed using a flow cytometer. The data were analyzed and each population was indicated on X-axis. Copyright © 2013 SciRes. OPEN ACCESS 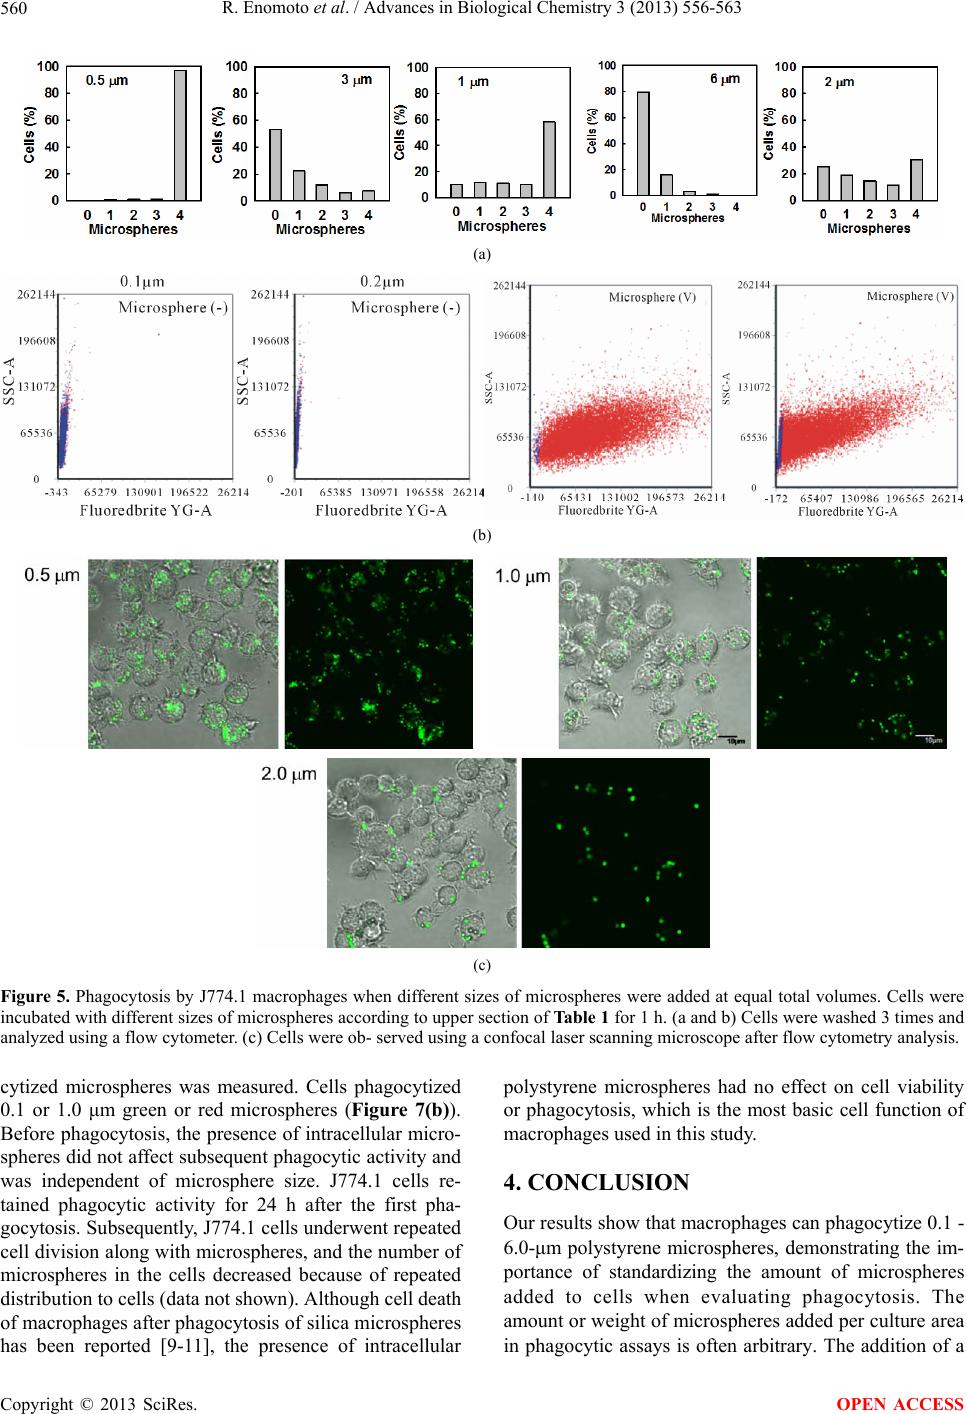 R. Enomoto et al. / Advances in Biological Chemistry 3 (2013) 556-563 Copyright © 2013 SciRes. 560 (a) (b) (c) Figure 5. Phagocytosis by J774.1 macrophages when different sizes of microspheres were added at equal total volumes. Cells were incubated with different sizes of microspheres according to upper section of Table 1 for 1 h. (a and b) Cells were washed 3 times and analyzed using a flow cytometer. (c) Cells were ob- served using a confocal laser scanning microscope after flow cytometry analysis. cytized microspheres was measured. Cells phagocytized 0.1 or 1.0 μm green or red microspheres (Figure 7(b)). Before phagocytosis, the presence of intracellular micro- spheres did not affect subsequent phagocytic activity and was independent of microsphere size. J774.1 cells re- tained phagocytic activity for 24 h after the first pha- gocytosis. Subsequently, J774.1 cells underwent repeated cell division along with microspheres, and the number of microspheres in the cells decreased because of repeated distribution to cells (data not shown). Although cell death of macrophages after phagocytosis of silica microspheres has been reported [9-11], the presence of intracellular polystyrene microspheres had no effect on cell viability or phagocytosis, which is the most basic cell function of macrophages used in this study. 4. CONCLUSION Our results show that macrophages can phagocytize 0.1 - 6.0-μm polystyrene microspheres, demonstrating the im- portance of standardizing the amount of microspheres added to cells when evaluating phagocytosis. The amount or weight of microspheres added per culture area in phagocytic assays is often arbitrary. The addition of a OPEN ACCESS 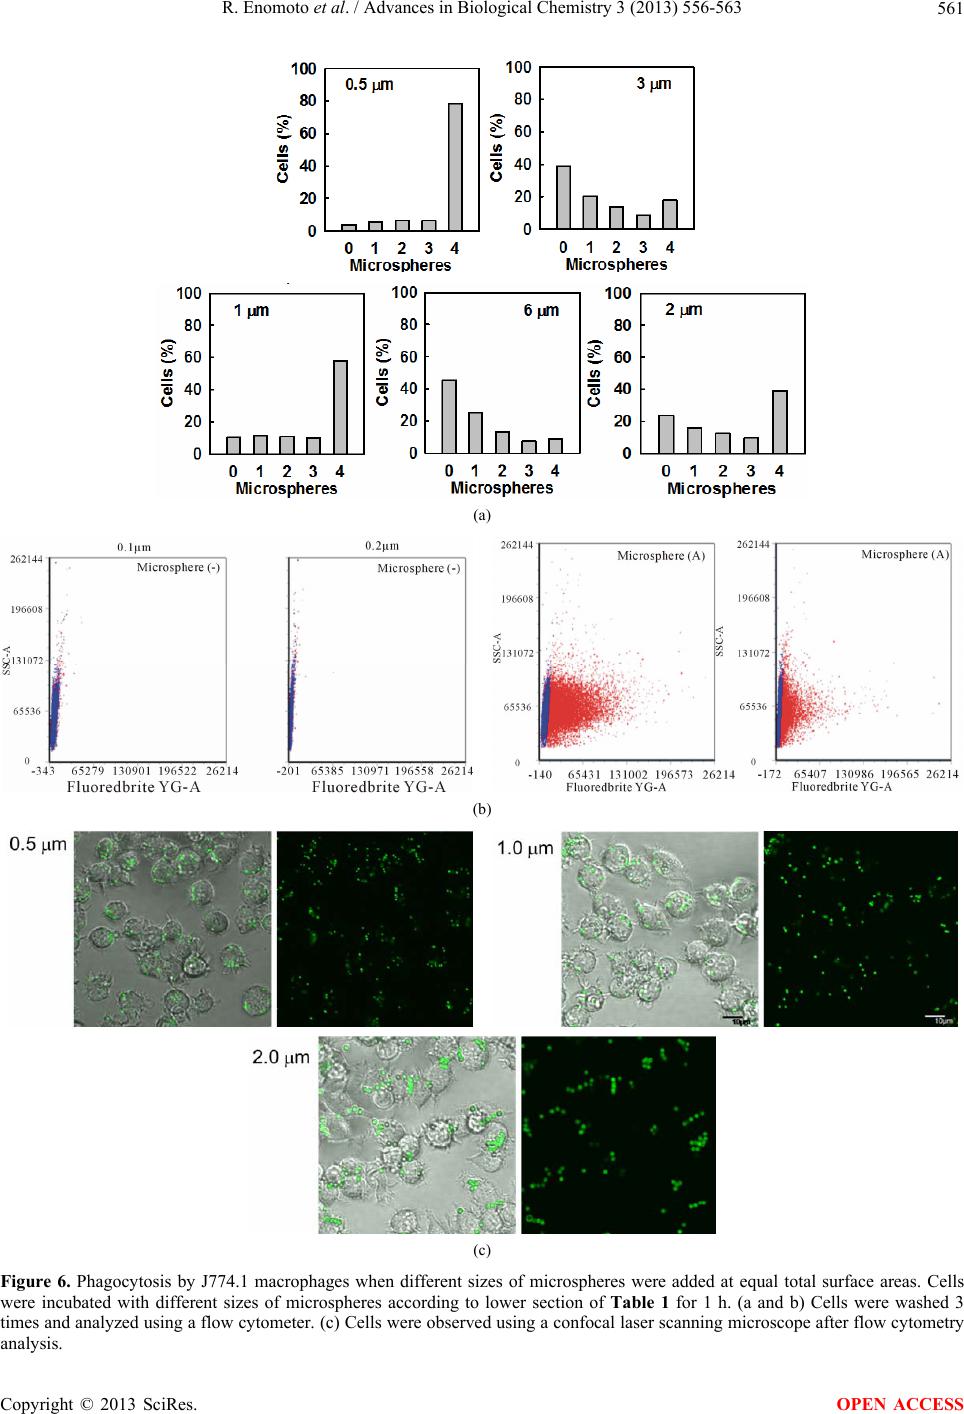 R. Enomoto et al. / Advances in Biological Chemistry 3 (2013) 556-563 561 (a) (b) (c) Figure 6. Phagocytosis by J774.1 macrophages when different sizes of microspheres were added at equal total surface areas. Cells were incubated with different sizes of microspheres according to lower section of Table 1 for 1 h. (a and b) Cells were washed 3 times and analyzed using a flow cytometer. (c) Cells were observed using a confocal laser scanning microscope after flow cytometry analysis. Copyright © 2013 SciRes. OPEN ACCESS 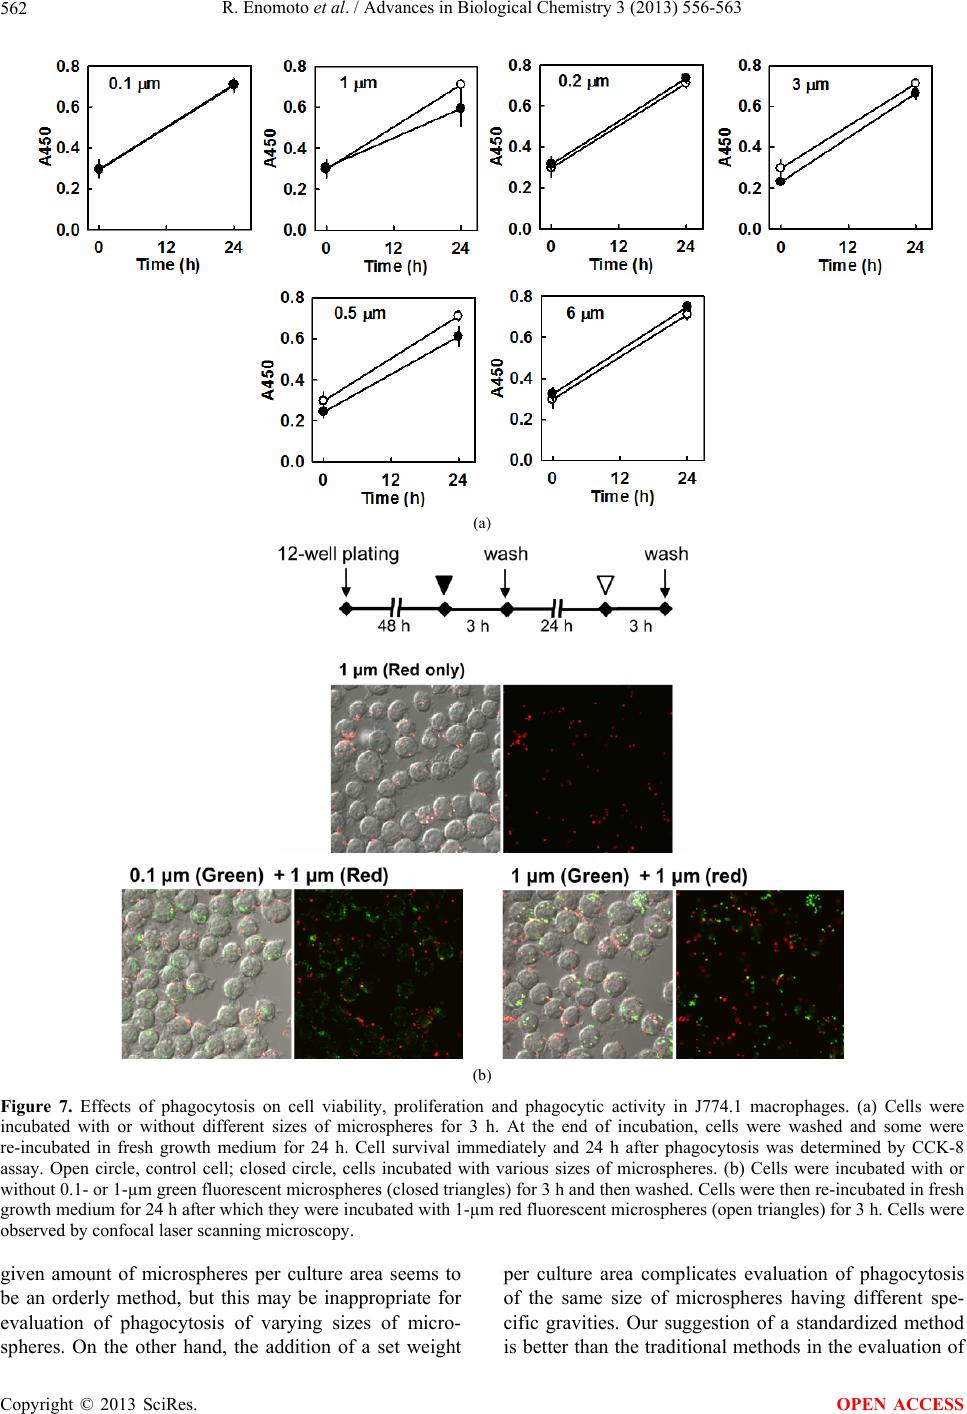 R. Enomoto et al. / Advances in Biological Chemistry 3 (2013) 556-563 562 (a) (b) Figure 7. Effects of phagocytosis on cell viability, proliferation and phagocytic activity in J774.1 macrophages. (a) Cells were incubated with or without different sizes of microspheres for 3 h. At the end of incubation, cells were washed and some were re-incubated in fresh growth medium for 24 h. Cell survival immediately and 24 h after phagocytosis was determined by CCK-8 assay. Open circle, control cell; closed circle, cells incubated with various sizes of microspheres. (b) Cells were incubated with or without 0.1- or 1-µm green fluorescent microspheres (closed triangles) for 3 h and then washed. Cells were then re-incubated in fresh growth medium for 24 h after which they were incubated with 1-µm red fluorescent microspheres (open triangles) for 3 h. Cells were observed by confocal laser scanning microscopy. given amount of microspheres per culture area seems to be an orderly method, but this may be inappropriate for evaluation of phagocytosis of varying sizes of micro- spheres. On the other hand, the addition of a set weight per culture area complicates evaluation of phagocytosis of the same size of microspheres having different spe- cific gravities. Our suggestion of a standardized method is better than the traditional methods in the evaluation of Copyright © 2013 SciRes. OPEN ACCESS 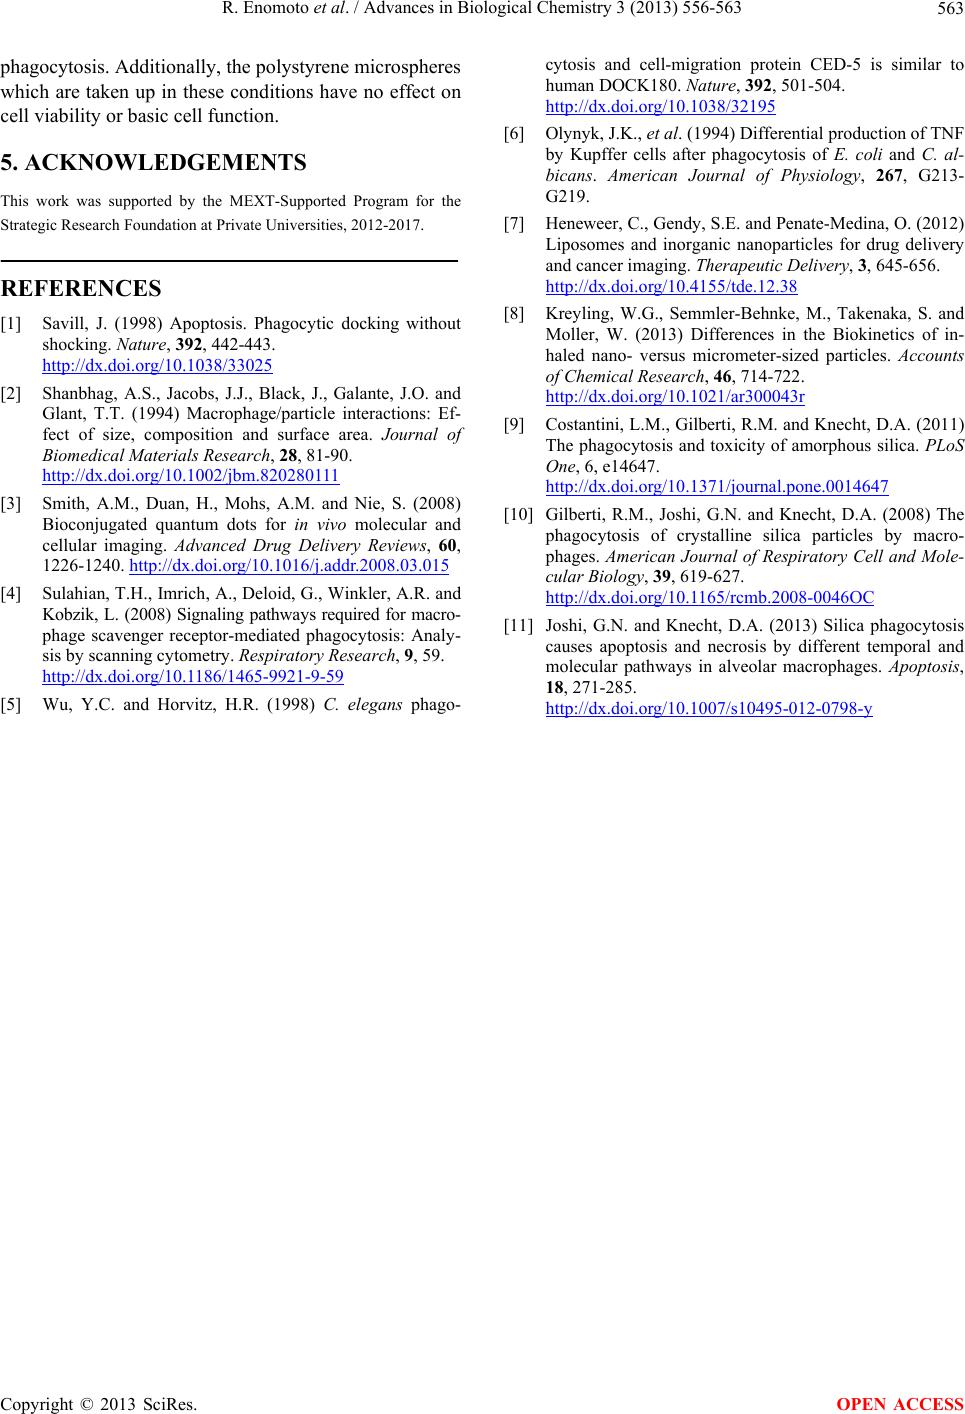 R. Enomoto et al. / Advances in Biological Chemistry 3 (2013) 556-563 563 phagocytosis. Additionally, the polystyrene microspheres which are taken up in these conditions have no effect on cell viability or basic cell function. 5. ACKNOWLEDGEMENTS This work was supported by the MEXT-Supported Program for the Strategic Research Foundation at Private Universities, 2012-2017. REFERENCES [1] Savill, J. (1998) Apoptosis. Phagocytic docking without shocking. Nature, 392, 442-443. http://dx.doi.org/10.1038/33025 [2] Shanbhag, A.S., Jacobs, J.J., Black, J., Galante, J.O. and Glant, T.T. (1994) Macrophage/particle interactions: Ef- fect of size, composition and surface area. Journal of Biomedical Materials Research, 28, 81-90. http://dx.doi.org/10.1002/jbm.820280111 [3] Smith, A.M., Duan, H., Mohs, A.M. and Nie, S. (2008) Bioconjugated quantum dots for in vivo molecular and cellular imaging. Advanced Drug Delivery Reviews, 60, 1226-1240. http://dx.doi.org/10.1016/j.addr.2008.03.015 [4] Sulahian, T.H., Imrich, A., Deloid, G., Winkler, A.R. and Kobzik, L. (2008) Signaling pathways required for macro- phage scavenger receptor-mediated phagocytosis: Analy- sis by scanning cytometry. Respiratory Research, 9, 59. http://dx.doi.org/10.1186/1465-9921-9-59 [5] Wu, Y.C. and Horvitz, H.R. (1998) C. elegans phago- cytosis and cell-migration protein CED-5 is similar to human DOCK180. Nature, 392, 501-504. http://dx.doi.org/10.1038/32195 [6] Olynyk, J.K., et al. (1994) Differential production of TNF by Kupffer cells after phagocytosis of E. coli and C. al- bicans. American Journal of Physiology, 267, G213- G219. [7] Heneweer, C., Gendy, S.E. and Penate-Medina, O. (2012) Liposomes and inorganic nanoparticles for drug delivery and cancer imaging. Therapeutic Delivery, 3, 645-656. http://dx.doi.org/10.4155/tde.12.38 [8] Kreyling, W.G., Semmler-Behnke, M., Takenaka, S. and Moller, W. (2013) Differences in the Biokinetics of in- haled nano- versus micrometer-sized particles. Accounts of Chemical Research, 46, 714-722. http://dx.doi.org/10.1021/ar300043r [9] Costantini, L.M., Gilberti, R.M. and Knecht, D.A. (2011) The phagocytosis and toxicity of amorphous silica. PLoS One, 6, e14647. http://dx.doi.org/10.1371/journal.pone.0014647 [10] Gilberti, R.M., Joshi, G.N. and Knecht, D.A. (2008) The phagocytosis of crystalline silica particles by macro- phages. American Journal of Respiratory Cell and Mole- cular Biology, 39, 619-627. http://dx.doi.org/10.1165/rcmb.2008-0046OC [11] Joshi, G.N. and Knecht, D.A. (2013) Silica phagocytosis causes apoptosis and necrosis by different temporal and molecular pathways in alveolar macrophages. Apoptosis, 18, 271-285. http://dx.doi.org/10.1007/s10495-012-0798-y Copyright © 2013 SciRes. OPEN ACCESS |