

Paper Menu >>
Journal Menu >>
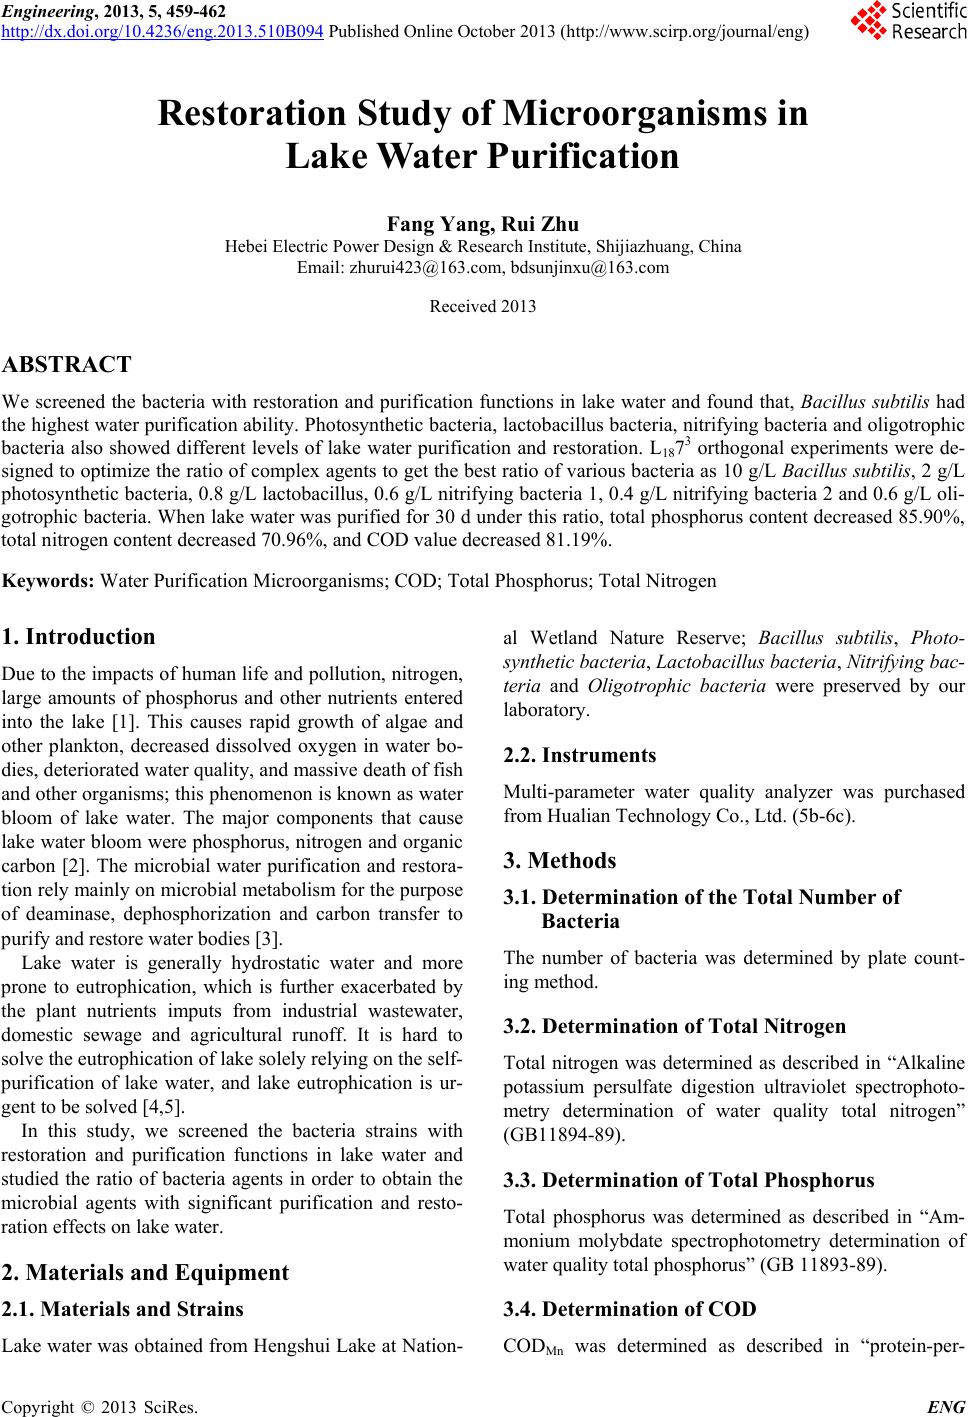 Engineering, 2013, 5, 459-462 http://dx.doi.org/10.4236/eng.2013.510B094 Published Online October 2013 (http://www.scirp.org/journal/eng) Copyright © 2013 SciRes. ENG Restoration Study of Microorganisms in Lake Water Purification Fang Yang, Rui Zhu Hebei Electric Power Design & Research Institute, Shijiazhuang, China Email: z hurui [email protected], [email protected] Received 2013 ABSTRACT We screened the bacteria with restoration and purification functions in lake water and found that, Bacillus subtilis had the highest water purification ability. Photosynthetic bacteria, lactobacillus bacteria, nitrifying bacter ia and oligotrophic bacteria also showed different levels of lake water purification and restoration. L1873 orthogonal experiments were de- signed to optimize the ratio of complex agents to get the best ratio of various bacteria as 10 g/L Bacillus subtilis, 2 g/L photosynthetic bacteria , 0.8 g/L lactobacillus , 0.6 g/L nitrifying b acteria 1, 0.4 g/L nitrifying bacteria 2 and 0.6 g /L oli- gotrophic bacteria. When lake water was purified for 30 d under this ratio, total phosphorus content decr eased 85.90%, total nitrogen content decreased 70.96%, and COD value decreased 81.19%. Keywords: Water Purification Microorganisms; COD; Total Phosphorus; Total Nitrogen 1. Introduction Due to the impacts of human life and pollution, nitrogen, large amounts of phosphorus and other nutrients entered into the lake [1]. This causes rapid growth of algae and other plankton, decreased dissolved oxygen in water bo- dies, deteriorated water quality, and massive death of fish and other organisms; this phenomenon is known as water bloom of lake water. The major components that cause lake water bloom were phosphorus, nitrogen and organic carbon [2]. The microbial water purification and restora- tion rely mainly on microbial metabolism for th e purpose of deaminase, dephosphorization and carbon transfer to purify and r e stor e water bodies [3]. Lake water is generally hydrostatic water and more prone to eutrophication, which is further exacerbated by the plant nutrients imputs from industrial wastewater, domestic sewage and agricultural runoff. It is hard to solve the eutrophication of lake solely re ly ing on the self- purification of lake water, and lake eutrophication is ur- gent to be solved [4,5]. In this study, we screened the bacteria strains with restoration and purification functions in lake water and studied the ratio of bacteria agents in order to obtain the microbial agents with significant purification and resto- ration effects on lake water. 2. Materials and Equipment 2.1. Materials and Strains Lake water was obtained from Hengshui Lake at Nation- al Wetland Nature Reserve; Bacillus subtilis, Photo- synthetic bacteria, Lac tob acillus bacteria, Nitrifying bac- teria and Oligotrophic bacteria were preserved by our laboratory. 2.2. Instruments Multi-parameter water quality analyzer was purchased from Hualian Technology Co., Ltd. (5b-6c). 3. Methods 3.1. Determination of the Total Number of Bacteria The number of bacteria was determined by plate count- ing method. 3.2. Determination of Total Nitrogen Total nitrogen was determined as described in “Alkaline potassium persulfate digestion ultraviolet spectrophoto- metry determination of water quality total nitrogen” (GB11894-89). 3.3. Determination of Total Phosphorus Total phosphorus was determined as described in “Am- monium molybdate spectrophotometry determination of water quality total phosphorus ” (GB 11893-89). 3.4. Determination of COD CODMn was determined as described in “protein-per- 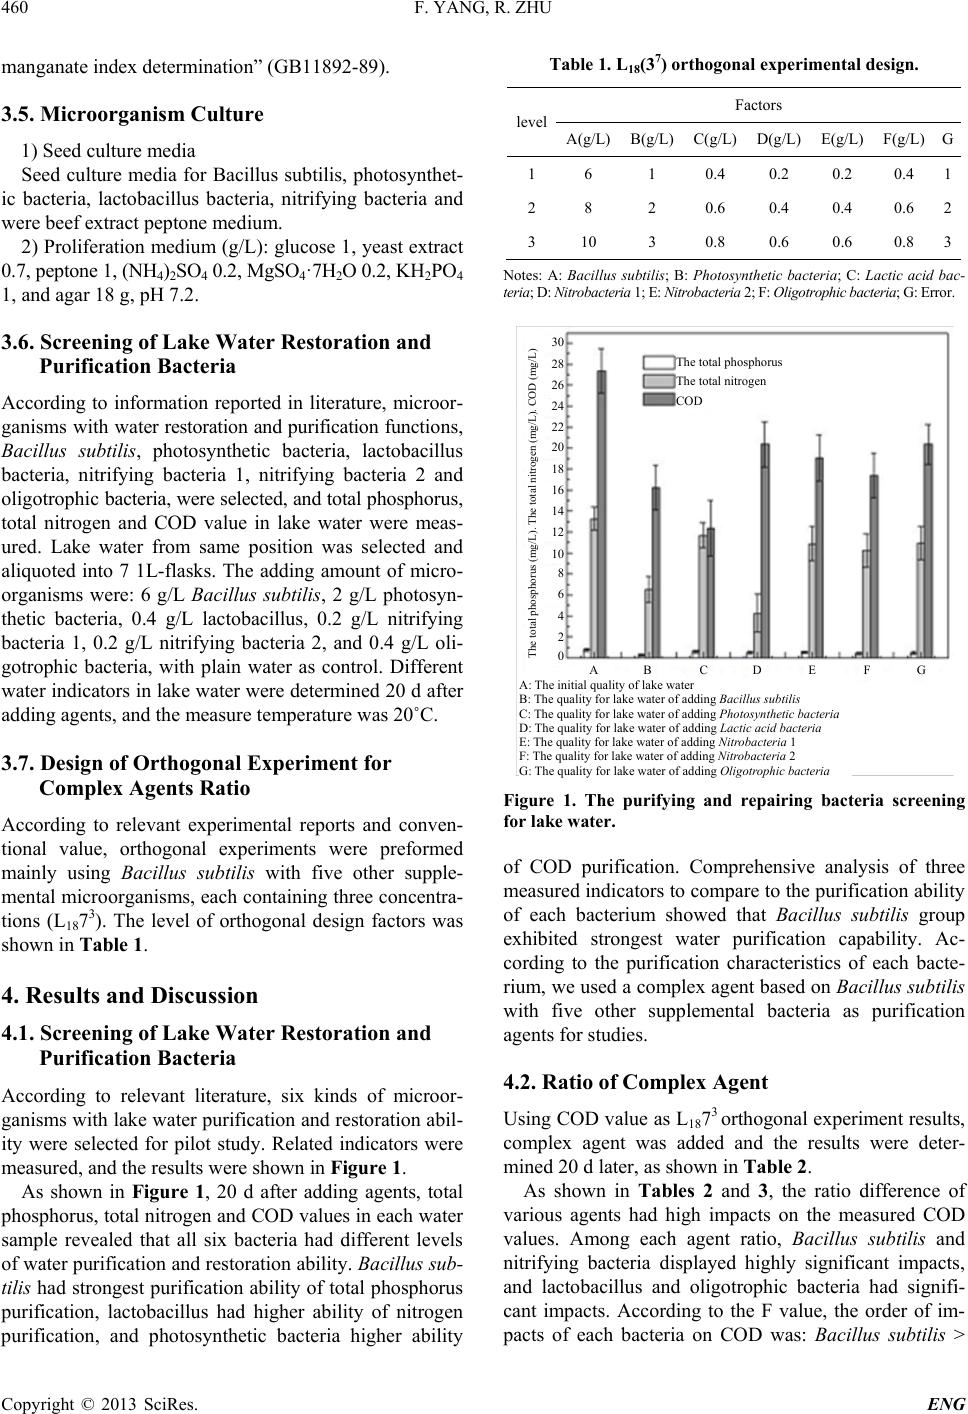 F. YANG, R. ZHU Copyright © 2013 SciRes. ENG 460 manganate index determination” (GB11892-89). 3.5. Microorganism Culture 1) Seed culture media Seed culture media for Bacillus subtilis, photosynthet- ic bacteria, lactobacillus bacteria, nitrifying bacteria and were beef extract peptone medium. 2) Proliferation mediu m (g/L): glucose 1, yeast extract 0.7, peptone 1, (NH4)2SO4 0.2, MgSO4·7H2O 0.2, KH2PO4 1, and agar 18 g, pH 7.2. 3.6. Screening of Lake Wat er Rest oration and Purification Bacteria According to information reported in literature, microor- ganisms with w ater restoration and purification functions, Bacillus subtilis, photosynthetic bacteria, lactobacillus bacteria, nitrifying bacteria 1, nitrifying bacteria 2 and oligotrophic bacteria, w ere sel ected, and total phosphorus, total nitrogen and COD value in lake water were meas- ured. Lake water from same position was selected and aliquoted into 7 1L-flasks. The adding amount of micro- organisms were: 6 g /L Bacillus subtilis, 2 g/L photosyn- thetic bacteria, 0.4 g/L lactobacillus, 0.2 g/L nitrifying bacteria 1, 0.2 g/L nitrifying bacteria 2, and 0.4 g/L oli- gotrophic bacteria, with plain water as control. Different water indicators in lake wa ter wer e determined 20 d after adding agents, a nd the measure temperature was 20˚C. 3.7. Design of Orthogonal Experiment for Complex Agent s Ratio According to relevant experimental reports and conven - tional value, orthogonal experiments were preformed mainly using Bacillus subtilis with five other supple- mental microorganisms, each containing three concentra- tions (L1873). The level of orthogonal design factors was shown in Table 1. 4. Results and Discussion 4.1. Screening of Lake Wat er Rest oration and Purification Bacteria According to relevant literature, six kinds of microor- ganisms with lake water purification and r estoration abil - ity were selected for pilot study. Related indicators were measured, and the re sults were shown in Figure 1. As shown in Figure 1, 20 d after adding agents, total phosphorus, total nitrogen and COD values in each water sample revealed that all six bacteria had different levels of water pur ification and restor ation ability. Bacillus s ub- tilis had strongest purificatio n ability of total phosphorus purification, lactobacillus had higher ability of nitrogen purification, and photosynthetic bacteria higher ability Table 1. L18(37) orthogonal experimental design. level Factors A(g/L) B(g/L) C(g/L) D(g/L) E(g/ L) F(g/L) G 1 6 1 0.4 0.2 0.2 0.4 1 2 8 2 0.6 0.4 0.4 0.6 2 3 10 3 0.8 0.6 0.6 0.8 3 Notes: A: Bacillus subtilis; B: Photosynthetic bacteria; C: Lactic acid bac- teria; D: Nitroba cte ria 1; E : Nitrobacteria 2; F: Oligotrophic bacteria; G: Error. The total phosphorus The total nitrogen COD The total phosphorus (mg/L). The total nitr ogen (mg/L). COD (mg/L) B C D E F G 0 2 4 6 8 10 12 14 16 18 20 22 24 26 28 30 A: The initial quality of lake water B: The quality for lake water of adding Bacillus subtilis C: The quality for lake water of adding Photosynthetic bacteria D: The quality for lake water of adding Lactic acid bacteria E: The quality for lake water of adding Nitrobacteria 1 F: The quality for lake water of adding Nitrobacteria 2 G: The quality for lake water of adding Oligotrophic bacteria A Figure 1. The purifying and repairing bacteria screening for lake water. of COD purification. Comprehensive analysis of three measured indicators to compare to the purification ability of each bacterium showed that Bacillus subtilis group exhibited strongest water purification capability. Ac- cording to the purification characteristics of each bacte- rium, we used a complex agent based on Bacillus subtilis with five other supplemental bacteria as purification agents for studies. 4.2. Ratio of Complex Agent Using COD value as L1873 orthogonal experiment results, complex agent was added and the results were deter- mined 20 d later, as shown in Table 2. As shown in Tables 2 and 3, the ratio difference of various agents had high impacts on the measured COD values. Among each agent ratio, Bacillus subtilis and nitrifying bacteria displayed highly significant impacts, and lactobacillus and oligotrophic bacteria had signifi- cant impacts. According to the F value, the order of im- pacts of each bacteria on COD was: Bacillus subtilis > 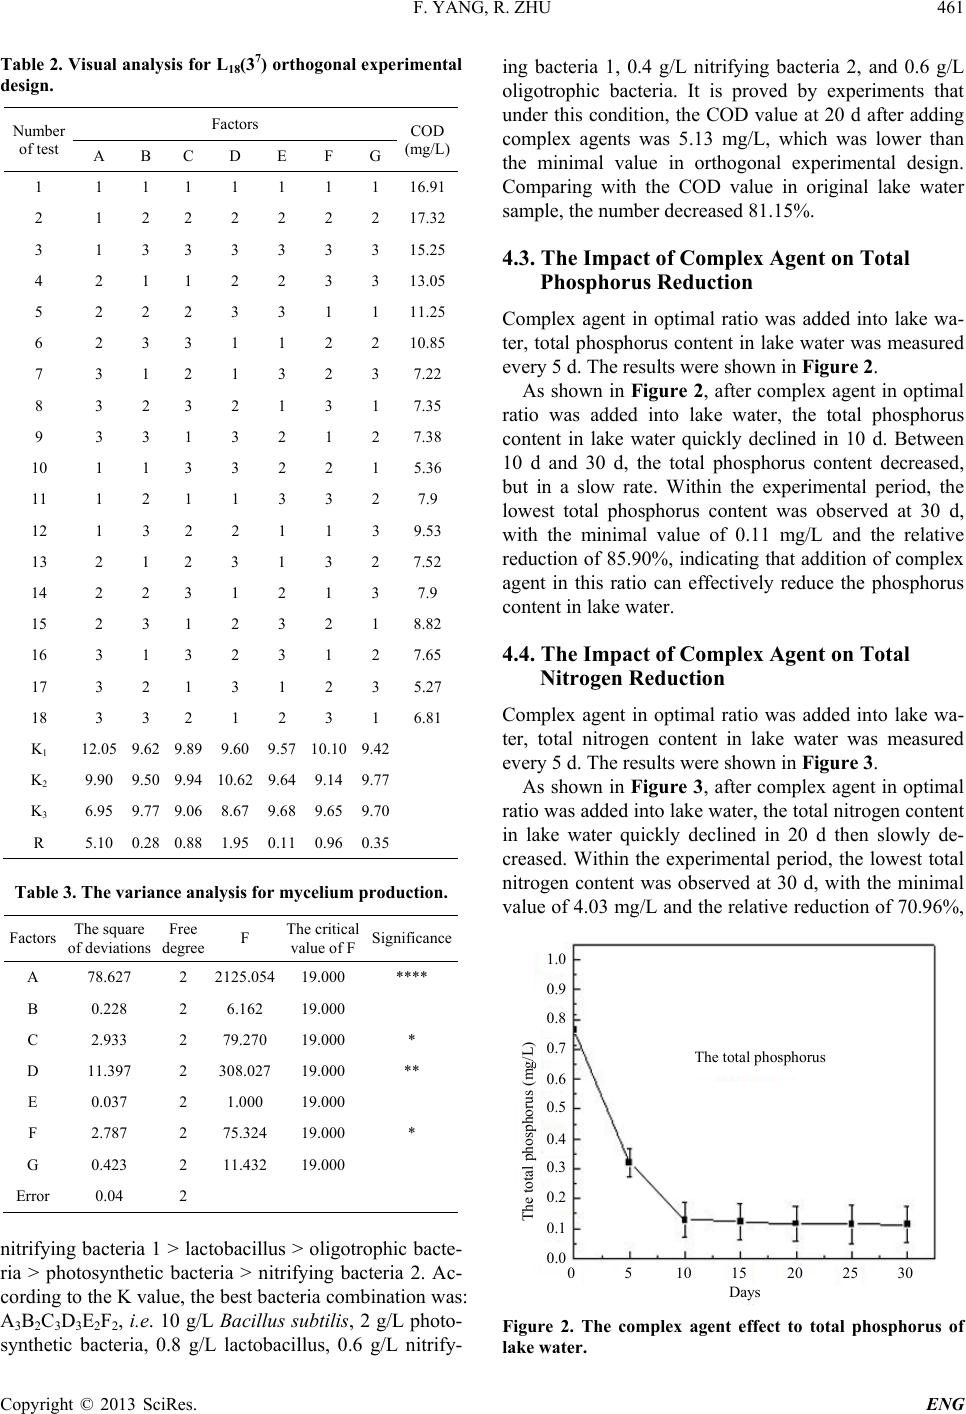 F. YANG, R. ZHU Copyright © 2013 SciRes. ENG 461 Table 2. Visual analysis for L18(37) orthogonal experimental design. Number of test Factors COD (mg/L) A B C D E F G 1 1 1 1 1 1 1 1 16.91 2 1 2 2 2 2 2 2 17.32 3 1 3 3 3 3 3 3 15.25 4 2 1 1 2 2 3 3 13.05 5 2 2 2 3 3 1 1 11.25 6 2 3 3 1 1 2 2 10.85 7 3 1 2 1 3 2 3 7.22 8 3 2 3 2 1 3 1 7.35 9 3 3 1 3 2 1 2 7.38 10 1 1 3 3 2 2 1 5.36 11 1 2 1 1 3 3 2 7.9 12 1 3 2 2 1 1 3 9.53 13 2 1 2 3 1 3 2 7.52 14 2 2 3 1 2 1 3 7.9 15 2 3 1 2 3 2 1 8.82 16 3 1 3 2 3 1 2 7.65 17 3 2 1 3 1 2 3 5.27 18 3 3 2 1 2 3 1 6.81 K1 12.05 9.62 9.89 9.60 9.57 10.10 9.42 K2 9.90 9.50 9.94 10.62 9.64 9.14 9.77 K3 6.95 9.77 9.06 8.67 9.68 9.65 9.70 R 5.10 0.28 0.88 1.95 0.11 0.96 0.35 Table 3. The variance analysis for mycelium production. Factors The square of deviations Free degree F The critical value of F Significance A 78.627 2 2125.054 19.000 **** B 0.228 2 6.162 19.000 C 2.933 2 79.270 19.000 * D 11.397 2 308.027 19.000 ** E 0.037 2 1.000 19.000 F 2.787 2 75.324 19.000 * G 0.423 2 11.432 19.000 Error 0.04 2 nitrifying bacteria 1 > lactobacillus > oligotrophic bacte- ria > photosynthetic bacteria > nitrifying bacteria 2. Ac- cording to the K value, the best bacteria combination was: A3B2C3D3E2F2, i.e. 10 g/L Bacillus subtilis, 2 g/L photo- synthetic bacteria, 0 .8 g/L lactobacillus, 0.6 g/L nitrify- ing bacteria 1, 0.4 g/L nitrifying bacteria 2, and 0.6 g/L oligotrophic bacteria. It is proved by experiments that under th is condition, the COD value at 20 d after adding complex agents was 5.13 mg/L, which was lower than the minimal value in orthogonal experimental design. Comparing with the COD value in original lake water sample, the number decreased 81.15%. 4.3. The Impact of Compl ex Agent on Total Phosphorus Reduction Complex agen t in optimal ratio was added into lake wa- ter, total phosphorus content in lake water was measured every 5 d. The results were shown in Fi gure 2. As shown in Figure 2, aft e r complex agent in optimal ratio was added into lake water, the total phosphorus content in lake water quickly declined in 10 d. Between 10 d and 30 d, the total phosphorus content decreased, but in a slow rate. Within the experimental period, the lowest total phosphorus content was observed at 30 d, with the minimal value of 0.11 mg/L and the relative reduction of 85.90%, indicating that addition of complex agent in this ratio can effectively reduce the phosphorus content in lake water. 4.4. The Impact of Complex Agent on Total Nitrogen Reduct ion Complex agent in optimal ratio was added into lake wa- ter, total nitrogen content in lake water was measured every 5 d. The results were shown in Figure 3. As shown in Figure 3, af ter co mplex agent in optimal ratio was add ed in to lake w ater , the total nitrogen content in lake water quickly declined in 20 d then slowly de- creased. Within the experimental period, the lowest total nitrogen content was observed at 30 d, with the minimal value of 4.03 mg/L and the relative reduction of 70.96%, The total phosphorus (mg/L) 0.0 0 The total phosphorus 5 10 15 20 25 30 Days 0.1 0.2 0.3 0.4 0.5 0.6 0.7 0.8 0.9 1.0 Figure 2. The complex agent effect to total phosphorus of lake water. 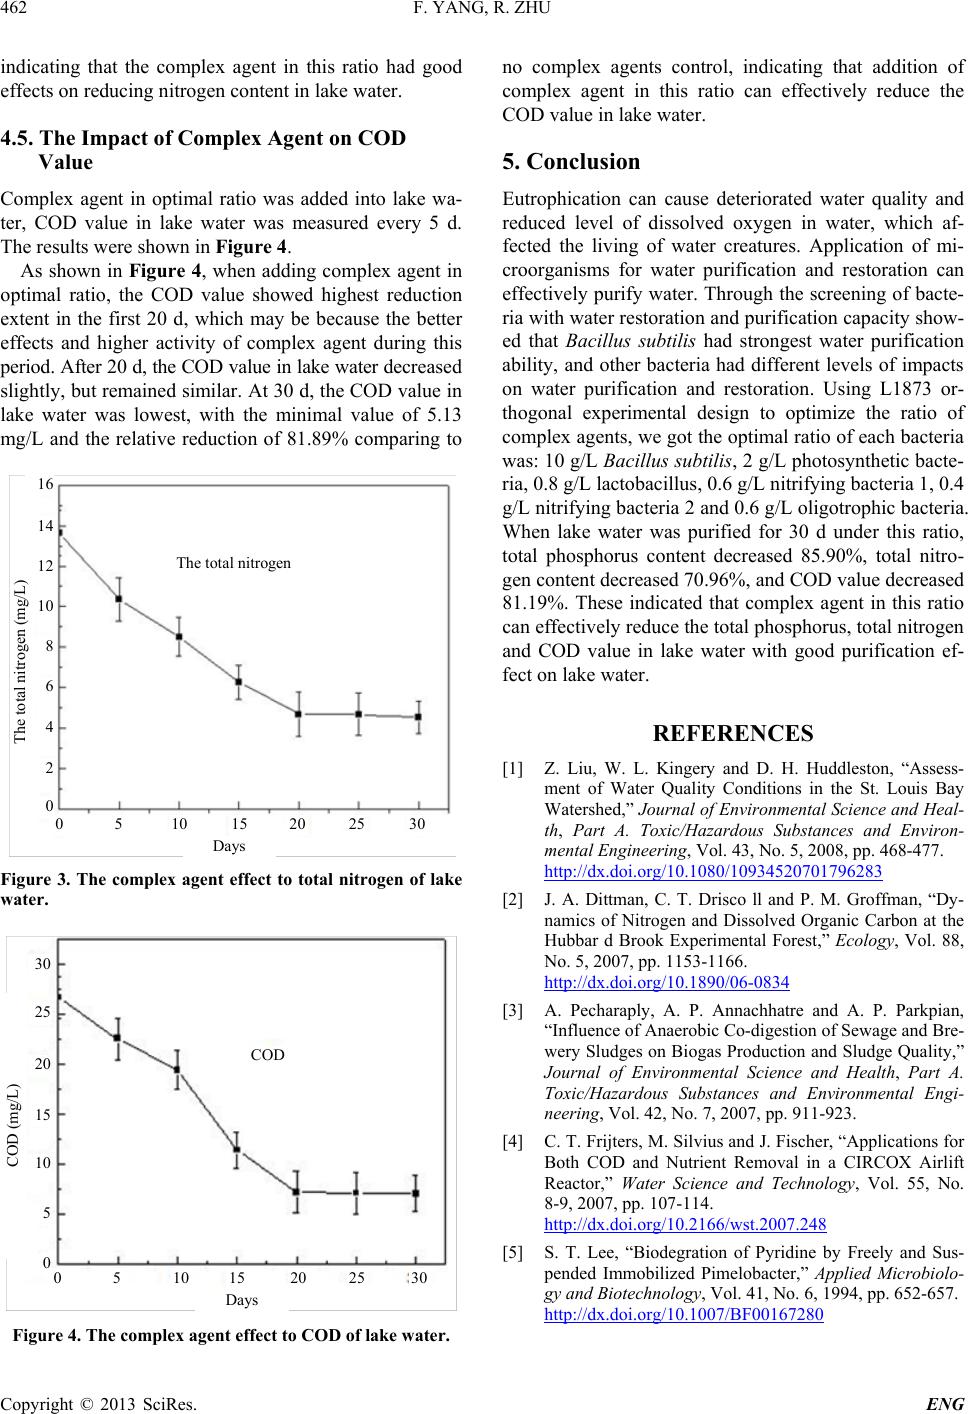 F. YANG, R. ZHU Copyright © 2013 SciRes. ENG 462 indicating that the complex agent in this ratio had good effects on reducing nitrogen content in lake water. 4.5. The Impact of Complex Agent on COD Value Complex agen t in optimal ratio was added into lake wa- ter, COD value in lake water was measured every 5 d. The results were shown in Figure 4. As shown in Figure 4, when adding complex agent in optimal ratio, the COD value showed highest reduction extent in the first 20 d, which may be because the better effects and higher activity of complex agent during this period. After 20 d, the COD valu e in lake water decreased slightly, but remained similar. A t 30 d, the COD value in lake wat er was lowest, with the minimal value of 5.13 mg/L and the relative reduction of 81.89% comparing to The total ni t rogen (mg/L) 0 0 The total nitrogen 5 10 15 20 25 30 Days 2 4 6 8 10 12 14 16 Figure 3. The complex agent effect to total nitrogen of lake water. COD (mg/L) 0 0 COD 5 10 15 20 25 30 Days 5 10 15 20 25 30 Figure 4. The complex agent effect to COD of lake water. no complex agents control, indicating that addition of complex agent in this ratio can effectively reduce the COD value in lake water. 5. Conclusion Eutrophication can cause deteriorated water quality and reduced level of dissolved oxygen in water, wh ich af- fected the living of water creatures. Application of mi- croorganisms for water purification and restoration can effectively purify water. Through the screening of bacte- ria with water restora tion and purification capacity show- ed that Bacillus subtilis had strongest water purification ability, and other bacteria had different levels of impacts on water purification and restoration. Using L1873 or- thogonal experimental design to optimize the ratio of complex agents, we got the optimal ratio of each bacteria was: 10 g/L Bacillus subtilis, 2 g/L photosynthetic bacte- ria, 0.8 g/L lactobacillus, 0.6 g/L nitrifying bacteria 1, 0.4 g/L nitrifying bacter ia 2 and 0.6 g/L oligotrophic b acteria. When lake water was purified for 30 d under this ratio, total phosphorus content decreased 85.90%, total nitro- gen content decreased 70.96%, and COD value decreased 81.19%. These indicated that complex agent in this ratio can effectively reduce the total phosphorus, total nitrogen and COD value in lake water with good purification ef- fect on lake wate r. REFERENCES [1] Z. Liu, W. L. Kingery and D. H. Huddleston, “Assess- ment of Water Quality Conditions in the St. Louis Bay Watershed,” Journal of Environmental Science and Heal- th, Part A. Toxic/Hazardous Substances and Environ- mental Engineering, Vol. 43, No. 5, 2008, pp. 468-477. http://dx.doi.org/10.1080/10934520701796283 [2] J. A. Dittman, C. T. Drisco ll and P. M. Groffman, “Dy- namics of Nitrogen and Dissolved Organic Carbon at the Hubbar d Brook Experimental Forest,” Ecology, Vol. 88, No. 5, 2007, pp. 1153-1166. http://dx.doi.org/10.1890/06-0834 [3] A. Pecharaply, A. P. Annachhatre and A. P. Parkpian, “Influence of Anaerobic Co-digestion of Sewage and Bre- wery Sludges on Biogas Production and Sludge Quality,” Journal of Environmental Science and Health, Part A. Toxic/Hazardous Substances and Environmental Engi- neering, Vol. 42, No. 7, 2007, pp. 911-923. [4] C. T. Frijters, M. Silvius and J. Fi scher, “Applications for Both COD and Nutrient Removal in a CIRCOX Airlift Reactor,” Water Science and Technology, Vol. 55, No. 8-9, 2007, pp. 107-114. http://dx.doi.org/10.2166/wst.2007.248 [5] S. T. Lee, “Biodegration of Pyridine by Freely and Sus- pended Immobilized Pimelobacter,” Applied Microbiolo- gy and Biotechnology, Vol. 41, No. 6, 1994, pp. 652-657. http://dx.doi.org/10.1007/BF00167280 |