

Paper Menu >>
Journal Menu >>
 Engineering, 2013, 5, 420-423 http://dx.doi.org/10.4236/eng.2013.510B086 Published Online October 2013 (http://www.scirp.org/journal/eng) Copyright © 2013 SciRes. ENG Charged Amino Acid Frequencies of Proteins over Macr oevolution ary T ime Scale Yu-Juan Zhang1*, Jian-Jun Li2, You-Jin Hao3, Bin Chen3 1College of Life Sciences, Chongqing Normal University, Chongqing, China 2Art and Sciences Division, Chengdu College University of Electronic Science and Technology of China, Chengdu, China 3College of Life Sciences, Chongqing Normal University, Chongqing, China Email: *yuj ua [email protected], [email protected], [email protected], [email protected] Received 2013 ABSTRACT Charged amino acids (AAs) are targets for selective forces in protein evolution. To fully explore the trend of charged AA frequencies evolution in macroevolutionary process from prokaryotes to eukaryotes, we extend the analysis of five charged AAs separately and total basic and acidic AAs in protein sequences of 158 prokaryotic and 63 eukaryotic pre- dicted proteomes and 456 clusters of orthologous groups (COGs). Also, we eliminate the biases that may caused by extreme organisms in both predicted proteomes and COGs analyses. More basic AAs, His, Lys and Glu were found in eukaryotic proteins compared with prokaryotic proteins by predicted proteomes analysis. By COG s analysis, we found that basic AAs and Lys frequencies are higher in eukaryotic orthologous proteins than their prokaryotic companions, while the trend of Arg frequency is the opposite. We discussed the agreements and disagreements of two analyses and gained a more credible trend of charged AAs evolution in macroevolutionary time scale. Keywords: Ch a rged Am i no Ac id; Evolution 1. Introduction Eukaryotes as a large complex have evolved from a pro- karyote-like predecessor [1,2]. The eukaryotic proteins are much more diverse than prokaryotic proteins. At- tempts have been made to study the evolution and diver- sity of eukaryotes at protein sequence and higher struc- tures [3], for example, homolog duplication, gaining or losing of domains [4], and so on. However, few atten- tions have been paid on the evolution of the amino acid (AA) frequency, especially for charged AAs, which play an important role in protein structure and protein-protein interactions. The charged AAs include acidic and basic AA. The acidic AAs are: Aspartic acid (Asp, D), Glutamic acid (Glu, E); basic AAs are: lysine (Lys, K), arginine (Arg, R), and histidine (His, H). Charged AAs play a critical role in protein-protein in teraction by creating salt bridg es and salt bridge networks, and introducing specificity in binding [5]. Depending on function and structure of a protein, charged AAs apparently can be important targets for selective forces in protein evolution [6]. We are interested of charged AA frequency evolution under the macroevolutionary time scale from prokaryotes to eukaryotes. How did they change through this process? Is there a global trend in charged AA frequency? A dis- cussion of “universal trend” of AA changes has been gi- ven by Jordan et al, in 15 taxa [7]. Their study didn’t exclude the bias may generated by protein sequences re- trieved from extreme organism, since life style and growth temperatures may affect the charged AA frequen- cy of organisms living in extreme environment [8], the “universal trend” they detected are mixed products made by ecosystem, macroevolution and so on, and then cloud our visions of true evolutionary story happened in ma- croevolutionary time scale. On the other hand, their study is not based on one-to-one comparison because the the data they used are whole geomes. In the present study we conducted the comprehensive investigation of charged AAs frequency on all available prokaryotic and eukaryotic predicte d proteomes. Also we computed the charged AA in cluster of orthologous group (COG), which including proteins in the same orthologous group. Orthologous proteins evolved from a common ancestral gene usually share the same structure and func- tion [9]. Statistic analysis performed for sets of ortholo- gous proteins can be considered to have no bias. Mean- while, to eliminate the biases may be caused by extreme organisms, only sequences retrieved from mesophilic or- ganism s were used. At the predicted proteomes level, our results showed *Corresponding a uthor.  Y.-J. ZHANG ET AL. Copyright © 2013 SciRes. ENG 421 eukaryotic proteins contain more total basic AAs, Lys and His, per protein than prokaryotic proteins. Compari- son at the COGs level indicated that orthologous proteins in eukaryotes have higher basic AAs and Lys than those of prokaryotes’ companions. Our study suggested that a trend of carrying more basic AAs and Lys on proteins from prokaryotes to eukaryotes. This study gives new in- sights into how charged AA frequencies have been changed over macroevolutionary time scale. 2. Materials and Methods 2.1. Sequence Retrieving and Analyzing 1) Predicted proteomes sequence 158 mesophilic prokaryotic and 63 eukaryotic predict- ed proteomes were retrieved from NCBI (ftp://ftp.ncbi.nih.gov/genomes) and Ensembl (http://www.ensembl.org). Mesophilic organisms were classified (organism lives between 50˚C and 15˚C) ac- cording to PGTdb (http://pgtdb.csie.ncu.edu.tw). 2) Clusters of Orthologous Grou ps COGs classification at the NCBI [10] w as used, which currently contain 4873 orthologous groups that are present in varying degrees in different species. According to PGTdb description, hyperthermophiles, thermophiles and psychrophiles sequences were excluded; only 456 COGs in both prokaryotes and eukaryotes (distributed in 44 mesophilic species) were used in our ana lysis 2.2. Atom Frequency Calculation The charged AA frequencies of a protein were calculated as: One sequence’s [*AA frequency] = [sum of *AA]/ L ; Where L is the sequence length, *represented 5 kinds charged AAs (Asp, His, Lys, Asp and Glu) and total acidic (Asp + Glu), basic AAs (Asp + His + Lys). One group’s charged AA frequency is the mean charged AA frequency of all protein sequences in this group. They were all calculated by special Perl scripts. 2.3. Statistical Tests The statistical calculations were performed by using SPSS version 13.0. For robustness and consistency we only considered significant differences at the probability level of p < 0.001. See detailed results in Tables 1 and 2. 3. Results 3.1. Charged AAs Frequenci es of Proteins in Predicted Proteomes We calculated the frequency of five kinds of charged AA separately, and total acidic, basic (Asp + His + Lys) in proteins of 158 prokaryotic and 63 eukaryotic predicted proteomes. The results were showed in Figure 1 and Table 1. The average frequency of basic AAs is 0.130 per AA throughout prokaryotic proteins, and 0.141 for eukaryotic proteins. Eukaryotic proteins have a higher frequency of total basic AAs than those of prokaryotes’ (Mann-Whit- ney Test, P < 0.001). Among basic AA, the frequency of His and Lys AA is high er in euk aryotes (0 .024, 0.062 for each) than in prokaryotes (0.021, 0.049 for each) (P < 0.001), but the frequency of Arg were not significantly different. The average acidic AAs frequency in prokaryotic pro- teins is not different with that in eukaryotic proteins (p > 0.1). The frequency of Glu is higher in eukaryotes (0.065) than in prokaryotes (0.062) with statistical support. For Asp, no significant difference was observed at the proba- bility level of p < 0.001. 3.2. Charged AAs Freque ncies of COGs The differences we found in charged AA frequency be- tween prokaryotic and eukaryotic predicted proteomes might due to the diverse origins of the protein sequences we used. Eukaryotic genomes have higher frequency of basic AAs, His, Lys and Glu because the new originated eukaryotic proteins have higher frequency of these AAs. While the old ones inherited from prokaryotes, may have no changes. To test this hypothesis, only proteins from the same orthologous group were furthe r analyzed. 456 sets of COG from 41 mesophilic prokaryotes and 3 eukaryotes were retrieved, and then charged AAs fre- Table 1. Statistical tests for Figure 1. [R] [H] [K] [D] [E] [Acid] [Basic] Mean*frequency of prokaryotic proteome 0.060 0.021 0.049 0.055 0.062 0.118 0.131 Mean*frequency of eukaryotic proteome 0.054 0.024 0.062 0.052 0.065 0.117 0.141 P value(Mann-Whitney Test) 0.012 2E−10 1E−6 0.006 4E−4 0.102 6E−15 Table 2. Statistical tests for Figure 2. [R] [H] [K] [D] [E] [Acid] [Basic] Mean*frequency of prokaryotic prot eome 0.056 0.023 0.055 0.055 0.065 0.120 0.134 Mean*frequency of eukaryotic proteome 0.048 0.023 0.070 0.054 0.064 0.118 0.141 P value (Mann-Whitney Test) 4E−21 0.642 5E−41 0.074 0.442 0.068 6E−7 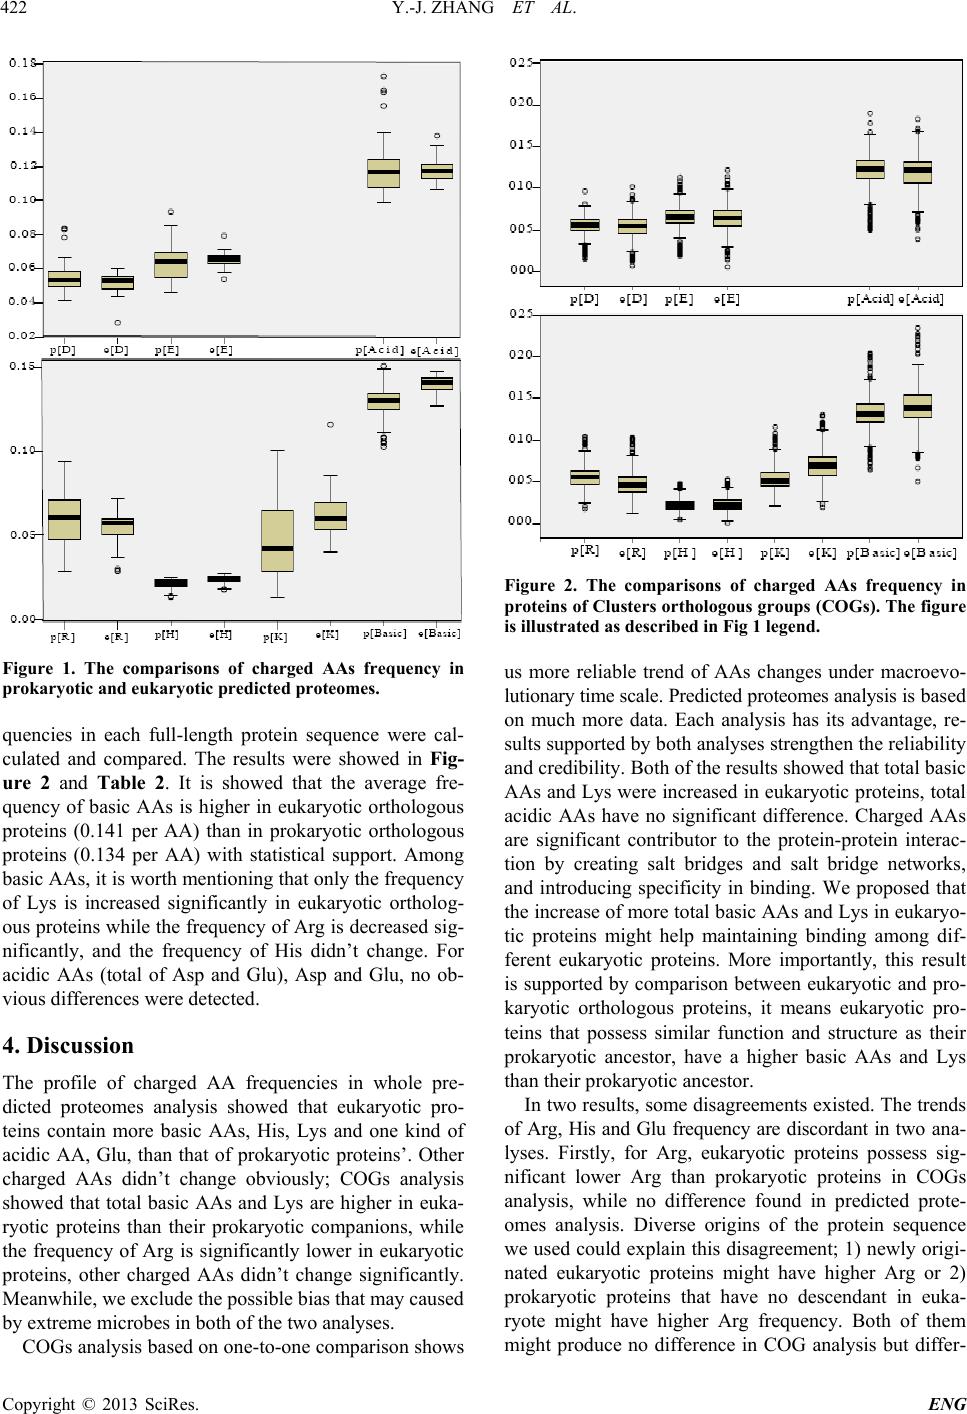 Y.-J. ZHANG ET AL. Copyright © 2013 SciRes. ENG 422 Figure 1. The comparisons of charged AAs frequency in prokaryotic and eukaryotic predicted proteomes. quencies in each full-length protein sequence were cal- culated and compared. The results were showed in Fig- ure 2 and Table 2. It is showed that the average fre- quency of basic AAs is higher in eukaryotic orthologous proteins (0.141 per AA) than in prokaryotic orthologous proteins (0.134 per AA) with statistical support. Among basic AAs, it is worth mentioning that only the frequency of Lys is increased significantly in eukaryotic ortholog- ous proteins while the frequency of Arg is decreased sig- nificantly, and the frequency of His didn’t change. For acidic AAs (total of Asp and Glu), Asp and Glu, no ob- vious differences were detected. 4. Discussion The profile of charged AA frequencies in whole pre- dicted proteomes analysis showed that eukaryotic pro- teins contain more basic AAs, His, Lys and one kind of acidic AA, Glu, than that of prokaryotic proteins’. Other charged AAs didn’t change obviously; COGs analysis showed that total basic AAs and Lys are higher in euka- ryotic proteins than their prokaryotic companions, while the frequency of Arg is significantly lower in eukaryotic proteins, other charged AAs didn’t change significantly. Meanwhile, we exclude the possible bias that may caused by extreme microbes in both of the two analyses. COGs analysis ba sed on one-to-one comparison shows Figure 2. The comparisons of charged AAs frequency in proteins of Clusters orthologous groups (COGs). The figure is illustrated as described in Fig 1 legend. us more reliable trend of AAs changes under macroevo- lutionary time scal e. Pred ict ed p ro teo mes analys is is based on much more data. Each analysis has its advantage, re- sults supported by both analyses streng then the reliability and credibility. Both of the results showed that total basic AAs and Lys were increased in eukaryotic proteins, total acidic AAs have no significant difference. Charged AAs are significant contributor to the protein-protein interac- tion by creating salt bridges and salt bridge networks, and introducing specificity in binding. We proposed that the increase of more total basic AAs and Lys in eukaryo- tic proteins might help maintaining binding among dif- ferent eukaryotic proteins. More importantly, this result is supported by comparison between eukaryotic and pro- karyotic orthologous proteins, it means eukaryotic pro- teins that possess similar function and structure as their prokaryotic ancestor, have a higher basic AAs and Lys than their prokaryotic ancestor. In two results, some disagreements existed. The trends of Arg, His and Glu frequency are discordant in two ana- lyses. Firstly, for Arg, eukaryotic proteins possess sig- nificant lower Arg than prokaryotic proteins in COGs analysis, while no difference found in predicted prote- omes analysis. Diverse origins of the protein sequence we u sed could explain this disagreement; 1) newly orig i- nated eukaryotic proteins might have higher Arg or 2) prokaryotic proteins that have no descendant in euka- ryote might have higher Arg frequency. Both of them might produce no difference in COG analysis but differ- 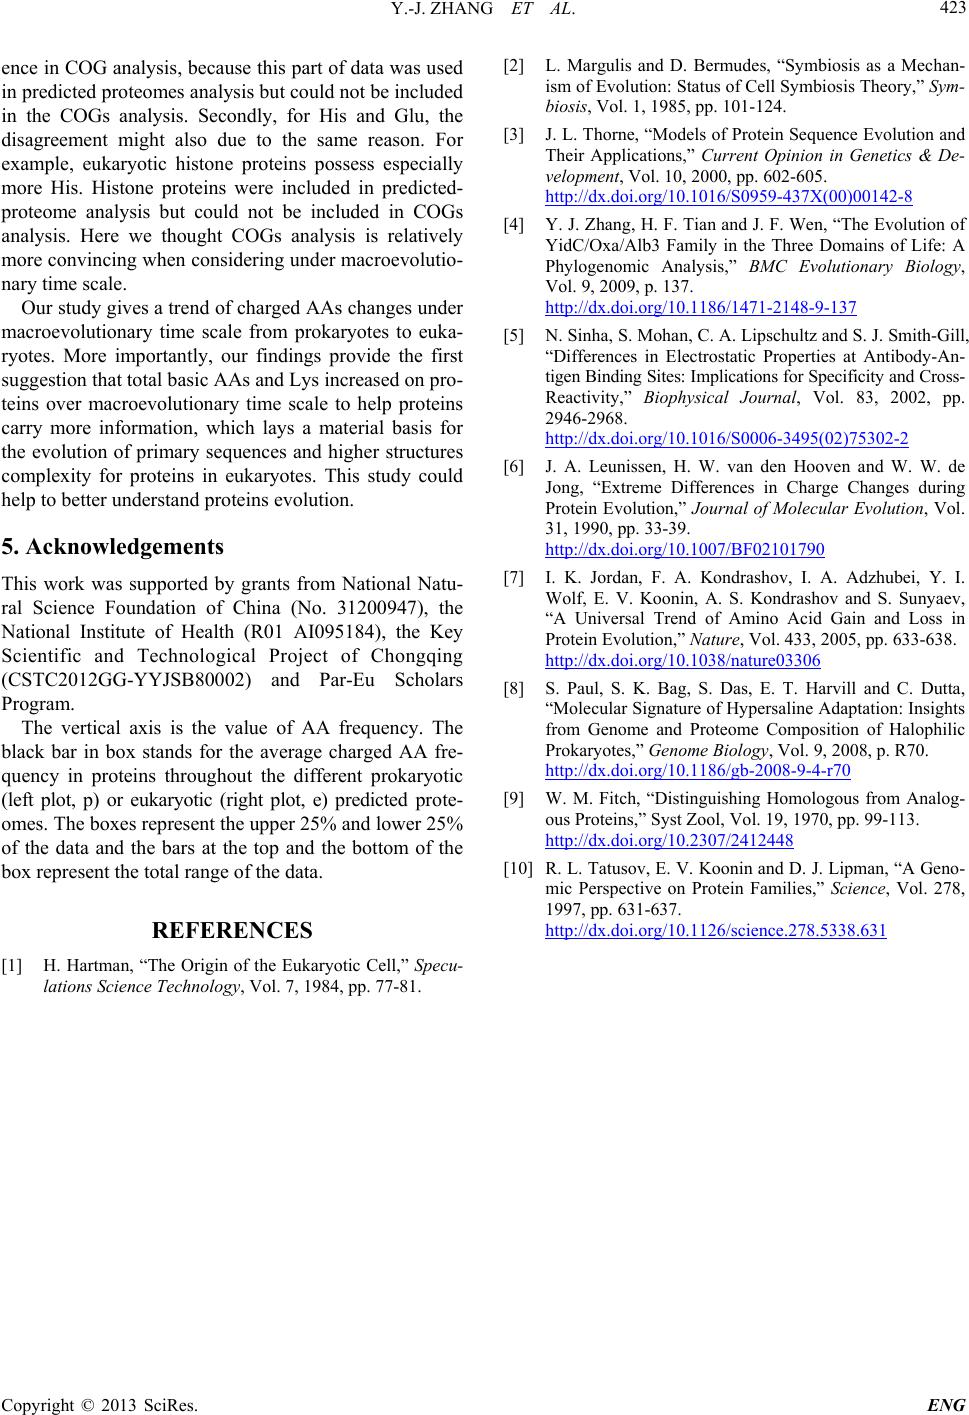 Y.-J. ZHANG ET AL. Copyright © 2013 SciRes. ENG 423 ence in COG analysis, because this part of data was used in predicted proteomes analysis but could not be included in the COGs analysis. Secondly, for His and Glu, the disagreement might also due to the same reason. For example, eukaryotic histone proteins possess especially more His. Histone proteins were included in predicted- proteome analysis but could not be included in COGs analysis. Here we thought COGs analysis is relatively more convincing when considering under macroevolutio- nary time scale. Our study gives a trend of charged AAs changes under macroevolutionary time scale from prokaryotes to euka- ryotes. More importantly, our findings provide the first suggestion that total basic AAs and Lys increased on pro- teins over macroevolutionary time scale to help proteins carry more information, which lays a material basis for the evolution of primary sequences and higher structures complexity for proteins in eukaryotes. This study could help to bet ter unde rs t a nd prote ins evolution. 5. Acknowledgements This work was supported by grants from National Natu- ral Science Foundation of China (No. 31200947), the National Institute of Health (R01 AI095184), the Key Scientific and Technological Project of Chongqing (CSTC2012GG-YYJSB80002) and Par-Eu Scholars Program. The vertical axis is the value of AA frequency. The black bar in box stands for the average charged AA fre- quency in proteins throughout the different prokaryotic (left plot, p) or eukaryotic (right plot, e) predicted prote- omes. The boxes rep resen t the upper 25 % and lower 25 % of the data and the bars at the top and the bottom of the box repres ent the total ran ge of the data. REFERENCES [1] H. Hartman, “The Origin of the Eukaryotic Cell,” Specu- lations Science Technology, Vol. 7, 1984, pp. 77-81. [2] L. Margulis and D. Bermudes, “Symbiosis as a Mechan- ism of Evolution: Status of Cell Symbi osis Theory,” Sym- biosis, Vol. 1, 1985, pp. 101-124. [3] J. L. Thorne, “Models of Protein Sequence Evolution and Their Applications,” Current Opinion in Genetics & De- velopment, Vol. 10, 2000, pp. 602-605. http://dx.doi.org/10.1016/S0959-437X(00)00142-8 [4] Y. J. Zhang, H. F. Tian and J. F. Wen, “The Evolution of YidC/Oxa/Alb3 Family in the Three Domains of Life: A Phylogenomic Analysis,” BMC Evolutionary Biology, Vol. 9, 2009, p. 137. http://dx.doi.org/10.1186/1471-2148-9-137 [5] N. Sinha, S. Mohan, C. A. Lipschultz and S. J. Smith-Gill, “Differences in Electrostatic Properties at Antibody-An- tigen Binding Sites: Implications for Specificity and Cross- Reactivity,” Biophysical Journal, Vol. 83, 2002, pp. 2946-2968. http://dx.doi.org/10.1016/S0006-3495(02)75302-2 [6] J. A. Leunissen, H. W. van den Hooven and W. W. de Jong, “Extreme Differences in Charge Changes during Protein Evolution,” Journal of Molecular Evolution, Vol. 31, 1990, pp. 33-39. http://dx.doi.org/10.1007/BF02101790 [7] I. K. Jordan, F. A. Kondrashov, I. A. Adzhubei, Y. I. Wolf, E. V. Koonin, A. S. Kondrashov and S. Sunyaev, “A Universal Trend of Amino Acid Gain and Loss in Protein Evolution,” Nature, Vol. 433, 2005, pp. 633-638. http://dx.doi.org/10.1038/nature03306 [8] S. Paul, S. K. Bag, S. Das, E. T. Harvill and C. Dutta, “Molecular Signature of Hypersaline Adaptation: Insights from Genome and Proteome Composition of Halophilic Prokaryotes,” Genome Biology, Vol. 9, 2008, p. R70. http://dx.doi.org/10.1186/gb-2008-9-4-r70 [9] W. M. Fitch, “Distinguishing Homologous from Analog- ous Proteins,” Syst Zool, Vol. 19, 1970, pp. 99-113. http://dx.doi.org/10.2307/2412448 [10] R. L. Tatusov, E. V. Koonin and D. J. Lipman , “A Geno- mic Perspective on Protein Families,” Science, Vol. 278, 1997, pp. 631-637. http://dx.doi.org/10.1126/science.278.5338.631 |