

Paper Menu >>
Journal Menu >>
 Engineering, 2013, 5, 396-399 http://dx.doi.org/10.4236/eng.2013.510B080 Published Online October 2013 (http://www.scirp.org/journal/eng) Copyright © 2013 SciRes. ENG The Wall Shear Stress of a Pulsatile Blood Flow in a Patient S pecific Stenotic Rig ht Coronary Artery Biyue Liu Department of Mathematics Monmouth University West Long Branch, NJ, USA Email: [email protected] Received 2013 ABSTRACT A computer simulation of the blood flow in a patient specific atherosclerotic right coronary artery is carried out to study the blood flow pattern and the wall shear stress (WSS) distribution in the artery. Both temporal and special distr ibution patterns of the WSS of the non-Newtonian blood flow are presented and the regions on the lumen surface where the WSS is constantly lower than 1 N/m2 are identified. Keywords: Wall Shear Stress; Stenotic Right Coronary Artery; Non-Newtonian 1. Introduction Atherosclerosis is the chief cause of death in the United States. It is a disease which involves complex interac- tions of many factors. It is widely believed that the wall shear stress (WSS) is one of the important local biome- chanical factors responsible for the initiation and the pro- gression of atherosclerosis [1-7]. A detailed hemodyna- mic evaluation of the spatial and temporal WSS distrib u- tions may give additional insight to understanding the progression of the disease and may have useful clinical value. In the past few decades, numerous clinical researches and computer simulations have been performed to study the flow phenomena in human atherosclerotic arteries and to investigate the correlation between the WSS and the intima-media thickness [1-10]. Caro et al. [1] sug- gested that the distribution of fatty streaking in human aorta might be coincident with the regions in which the shear rate at the arterial wall is locally reduced. Friedman et al. [2] and Nerem et al. [6] performed experiments that showed an accelerated occurrence of atherosclerosis in human subjects with a coronary geometry. Zarins et al. [7] and Ku et al. [4] estimated shear stress with laser- Doppler anemometry and found that intimal thickening bears an inverse relationship to both maximum shear stress and minimum shear stress. Gibson et al. [3] inves- tigated the relationship between the vessel wall shear stress and the r ate of atherosclerosis progression by means of quantitative angiography. They found a significant correlation between the low shear stress and an increased rate of atherosclerosis progression. Johnston et al. [10] compared models of Newtonian and Non-Newtonian flow in healthy right coronary arteries with no sign of athero- ma. Although the blood flow in stenotic arteries has been extensively studied, there is much to be done both in un- derstanding the disease process itself and also in under- standing the role of hemodynamics and the associated WSS as an influence factor on the initiation and the pro- gression of athe ros c l erosis . The objectives of the current work are to simulate the blood flow in a stenotic human right coronary artery and to investigate the spatial and temporal WSS distribution patterns during a cardiac cycle. 2. Mathematical Model This study assumes that the fluid is Laminar, Non-New- tonian, viscous and incompressible and the artery wall is rigid. These assumptions have been shown to be ade- quate for the pulsatile blo od flow simulation in th e artery models under physiological flow conditions by many investigators. The computational domain is a patient spe- cific atherosclerotic right coronary artery shown in Fig- ure 1(a), re-constructed based on the in vivo intravascu- lar ultrasound (IVUS) image of a patient [9]. The lumen cross section area fro m the inlet to the outlet is plotted in Figure 1(b), where the horizontal axis is the normalized axial length with inlet z = 0 and the outlet z = 1. The minimum lumen cross section area at the neck of the stenosis is 0.042 cm2. The maximum area of the cross section proximal to the stenosis is 0.130 cm2. The r educ- tion of the lumen area at the neck of stenosis is approx- imately 68%. It is a severely stenotic right coronary ar- tery segment. The time dependent three dimensional Navier Stokes 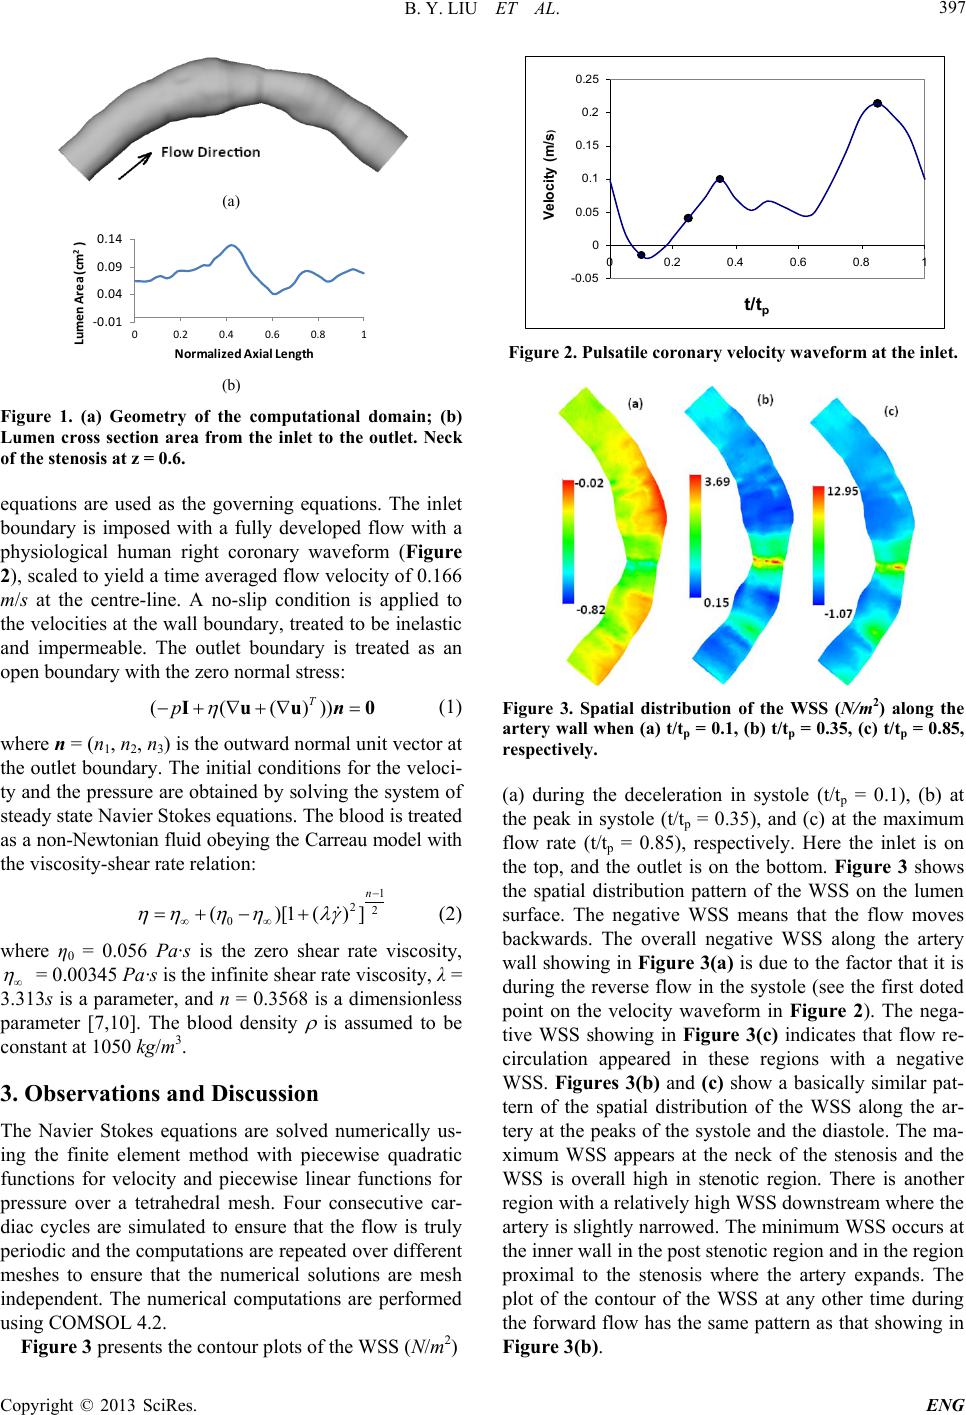 B. Y. LIU ET AL. Copyright © 2013 SciRes. ENG 397 (a) (b) Figure 1. (a) Geometry of the computational domain; (b) Lumen cross section area from the inlet to the outlet. Neck of the stenosis at z = 0.6. equations are used as the governing equations. The inlet boundary is imposed with a fully developed flow with a physiological human right coronary waveform (Figure 2), scaled to yield a time averaged flow velocity of 0.166 m/s at the centre-line. A no-slip condition is applied to the velocities at the wall boundary, treated to be inelastic and impermeable. The outlet boundary is treated as an open boundary with the zero normal stress: ((() )) T p η −+∇ +∇=I uu0n (1) where n = (n1, n2, n3) is the outward normal unit vector at the outlet boundary. The initial cond itions for the veloci- ty and the pressure are obtained by solving the system of steady state Navier Stokes equations. The blood is treated as a non-Newtonian fluid obeying the Carreau model with the viscosity-shear rate relation: 1 22 0 ()[1()] n η ηηηλγ − ∞∞ =+−+ (2) where η0 = 0.056 Pa∙s is the zero shear rate viscosity, η ∞ = 0.00345 Pa ·s is the infinite sh ear rate viscos ity, λ = 3.313s is a parameter, and n = 0.3568 is a dimensionless parameter [7,10]. The blood density ρ is assumed to be constant at 1050 kg/m3. 3. Observations and Discussion The Navier Stokes equations are solved numerically us- ing the finite element method with piecewise quadratic functions for velocity and piecewise linear functions for pressure over a tetrahedral mesh. Four consecutive car- diac cycles are simulated to ensure that the flow is truly periodic and the computations are repeated over different meshes to ensure that the numerical solutions are mesh independent. The numerical computations are performed using COMSOL 4.2. Figure 3 presents the contour plots of the WSS (N/m2) Figure 2. Pulsatile coronary velocity waveform at the inlet. Figure 3. Spatial distribution of the WSS (N/m2) along the artery wall when (a) t/ tp = 0.1, (b) t/tp = 0.35, (c) t/tp = 0.85, respectively. (a) during the deceleration in systole (t/tp = 0.1), (b) at the peak in systole (t/tp = 0.35), and (c) at the maximum flow rate (t/tp = 0.85), respectively. Here the inlet is on the top, and the outlet is on the bottom. Figure 3 shows the spatial distribution pattern of the WSS on the lumen surface. The negative WSS means that the flow moves backwards. The overall negative WSS along the artery wall showing in Figure 3(a) is due to the factor that it is during the reverse flow in the systole (see the first doted point on the velocity waveform in Figure 2). The nega- tive WSS showing in Figure 3(c) indicates that flow re- circulation appeared in these regions with a negative WSS. F ig ures 3(b) and (c) show a basically similar pat- tern of the spatial distribution of the WSS along the ar- tery at the peaks of the systole and the diastole. The ma- ximum WSS appears at the neck of the stenosis and the WSS is overall high in stenotic region. There is another region with a relatively high WSS downstream where the artery is slightly narrowed. The minimum WSS o ccurs at the inner wall in the post stenotic region and in the region proximal to the stenosis where the artery expands. The plot of the contour of the WSS at any other time during the forw ard flow has the same pattern as that showing in Figure 3(b). -0.01 0.04 0.09 0.14 00.2 0.4 0.6 0.81 Lumen Area (cm2) Normalized Axial Length -0.05 0 0.05 0.1 0.15 0.2 0.25 00.2 0.4 0.6 0.81 Velocity (m/s) t/t p 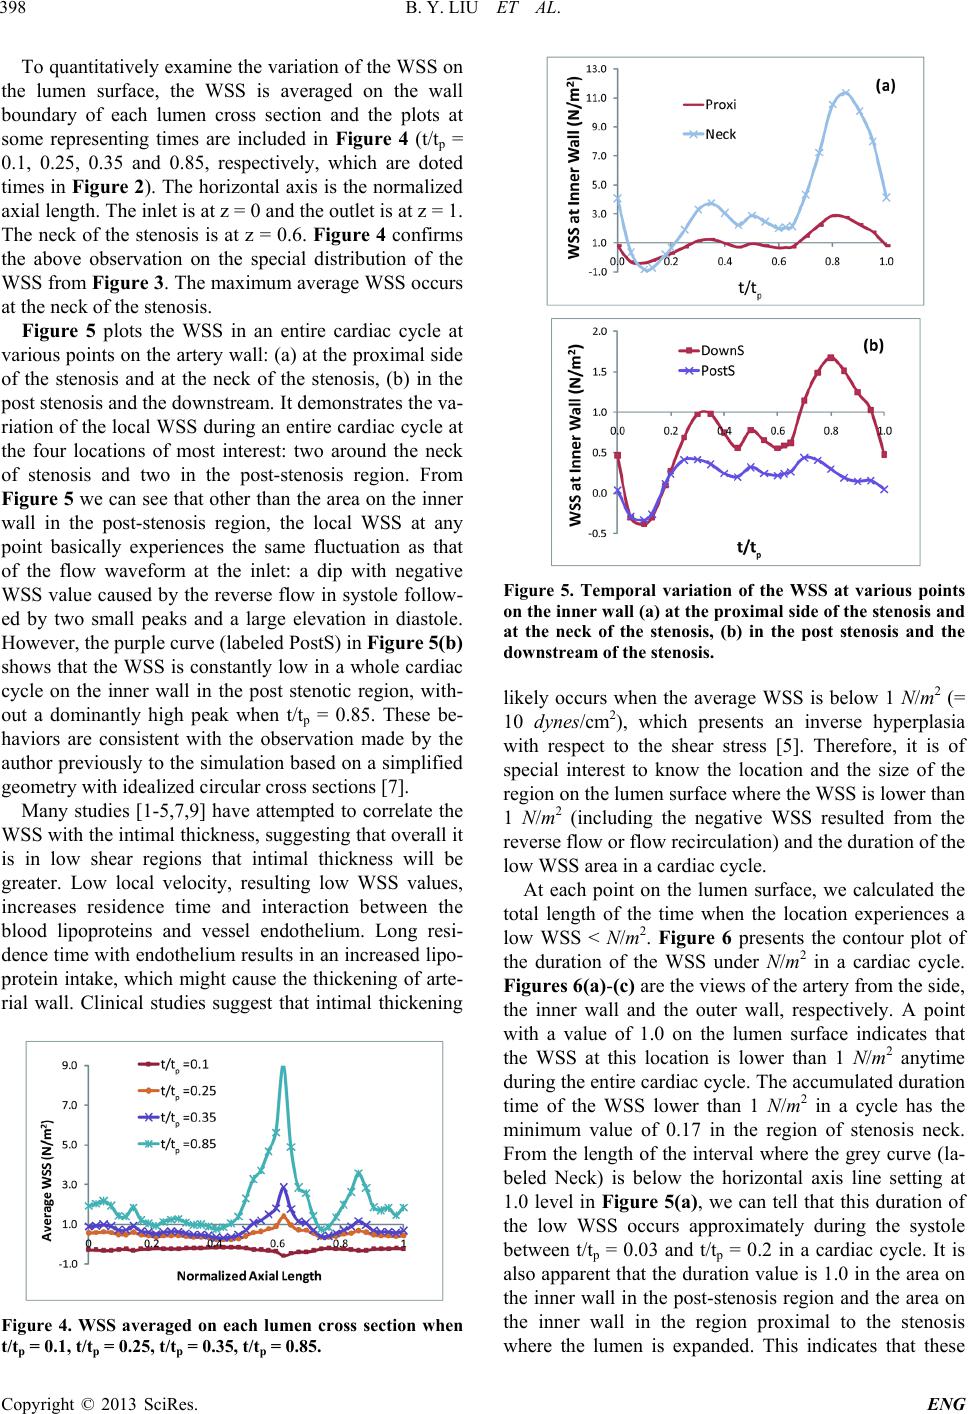 B. Y. LIU ET AL. Copyright © 2013 SciRes. ENG 398 To quantitatively examine the v ariation of the WSS on the lumen surface, the WSS is averaged on the wall boundary of each lumen cross section and the plots at some representing times are included in Figure 4 (t/tp = 0.1, 0.25, 0.35 and 0.85, respectively, which are doted times in Figure 2). The horizontal axis is the normalized axial length. The inlet is at z = 0 and the outlet is at z = 1. The neck of the stenosis is at z = 0.6. Figure 4 confirms the above observation on the special distribution of the WSS from Figure 3. The maximum average WSS occurs at the neck of the stenosis. Figure 5 plots the WSS in an entire cardiac cycle at various points on the ar tery wall: (a) at the proximal side of the stenosis and at the neck of the stenosis, (b) in the post stenosis and the downstream. It demonstrates the va- riation of the local WSS during an entire cardiac cycle at the four locations of most interest: two around the neck of stenosis and two in the post-stenosis region. From Figure 5 we can see that other than the area on the inner wall in the post-stenosis region, the local WSS at any point basically experiences the same fluctuation as that of the flow waveform at the inlet: a dip with negative WSS value caused by the reverse flow in systole follow- ed by two small peaks and a large elevation in diastole. However, the purple curve (labeled PostS) in Figure 5(b) shows that the WSS is constantly low in a whole cardiac cycle on the inner wall in the post stenotic region, with- out a dominantly high peak when t/tp = 0.85. These be- haviors are consistent with the observation made by the author previously to the simulation based on a simplified geometry with idealized circular cross sections [7]. Many studies [1-5,7,9] have attempted to correlate the WSS with the intimal thickness, suggesting that overall it is in low shear regions that intimal thickness will be greater. Low local velocity, resulting low WSS values, increases residence time and interaction between the blood lipoproteins and vessel endothelium. Long resi- dence time with endothe lium results in an increased lipo- protein intake, which might cause the thickening of arte- rial wall. Clinical studies suggest that intimal thickening Figure 4. WSS averaged on each lumen cross section when t/tp = 0.1, t/tp = 0.25, t/tp = 0.35, t/tp = 0.85. Figure 5. Temporal variation of the WSS at various points on the inner wall (a) at the proximal side of the stenosis and at the neck of the stenosis, (b) in the post stenosis and the downstream of the stenosis. likely occurs when the average WSS is below 1 N/m2 (= 10 dynes/cm2), which presents an inverse hyperplasia with respect to the shear stress [5]. Therefore, it is of special interest to know the location and the size of the region on the lumen surface where the WSS is lower than 1 N/m2 (including the negative WSS resulted from the reverse flow or flow recir culati on ) an d the duration of the low WSS area in a cardiac cycle. At each point on the lumen surface, we calculated the total length of the time when the location experiences a low WSS < N/m2. Figure 6 presents the contour plot of the duration of the WSS under N/m2 in a cardiac cycle. Figures 6(a)-(c) are the views of the artery from the side, the inner wall and the outer wall, respectively. A point with a value of 1.0 on the lumen surface indicates that the WSS at this location is lower than 1 N/m2 anytime during the entire cardiac cycle. The accumulated duration time of the WSS lower than 1 N/m2 in a cycle has the minimum value of 0.17 in the region of stenosis neck. From the length of the interval where the grey curve (la- beled Neck) is below the horizontal axis line setting at 1.0 level in Figure 5(a), we can tell that this duration of the low WSS occurs approximately during the systole between t/tp = 0.03 and t/tp = 0.2 in a cardiac cycle. It is also apparent that the duration value is 1.0 in the area on the inner wa ll in the post -stenosis region and the area on the inner wall in the region proximal to the stenosis where the lumen is expanded. This indicates that these  B. Y. LIU ET AL. Copyright © 2013 SciRes. ENG 399 Figure 6. The duration of the WSS under 1 N/m2 (a) the side view of the artery, (b) the inner wall of the artery, (c) the outer wall of the artery. areas experience a lower WSS during the whole cardiac cycle. The purple curve (labeled PostS) in Figure 5(b) also demonstrates this, where the whole curve is below the horizontal axis line setting at 1.0 level. Comparing Figures 6(b) with (c) we can see that the low WSS re- gions mostly occur on the inner wall of the stenotic right coronary artery. The WSS on the outer wall is relatively higher, which may prevent the deposition of the particles and the further intimal thickening along this side of the artery. 4. Conclusion In this work, a computer simulation of the blood flow in a patient specific stenotic right coronary artery has been performed to investigate the phasic variation and the spa- tial distribution pattern of the wall shear stress on the lumen surface. Based on the computational results pre- sented, we can see that the WSS distribution is highly non-uniform both temporally and spatially. The WSS ele- vates in the stenotic region, reaches the maximum at the neck of the stenosis, and drops sharply in the post-steno- sis region. The areas on the inner wall in the post-steno- sis region and in the region proximal to the stenosis are subject to a low WSS less than N/m2 during the entire cardiac cycle. 5. Acknowledgements This work was partially supported by a grant from the Simons Foundation (#210082 to Biyue Liu) and a sab- batic al gra nt f rom Monm o uth Uni ve rsi ty. The author thanks Dr. Dalin Tang for providing the stenotic right coronary artery data for re-constructing the computational domain. REFERENCES [1] C. G. Caro, J. M. Fitz-Gerald and R. C. Schroter, “Athe- roma and Arterial Wall Shear Observation, Correlation and Proposal of a Shear-Dependent Mass Transfer Me- chanism for Atherogenesis,” Proceedings of the Royal So- ciety B: Biological Sciences, Vol. 177, 1971, pp. 109-159. http://dx.doi.org/10.1098/rspb.1971.0019 [2] M. H. Friedman., G. M. Hutchins, C. B. Bargeron, O. J. Deters and F. F. Mark, “Correlation between Intimal Thickness and Fluid Shear in Human Arteries,” Atheros- clerosis, Vol. 39, 1981, pp. 425-436. http://dx.doi.org/10.1016/0021-9150(81)90027-7 [3] C. M. Gibson, L. Diaz, K. Kandarpa, F. M. Sacks, R. C. Pasternak, T. Sandor, et al. , “Rel a t ion of Ve ssel Wall Shear Stress to Atherosclerosis Progression in Human Coronary Arteries,” Arteriosc le rosis and Thrombos is, Vol. 13, 1993, pp. 310-315. http://dx.doi.org/10.1161/01.ATV.13.2.310 [4] D. N. Ku, D. P. Giddens, C. K. Zarins, et al, “Pulsatile Flow and Atherosclerosis in the Human Carotid Bifurca- tion: Positive Correlation between Plaque Location and Low and Oscillating Stress,” Arteriosclerosis, Vol. 5, 1985, pp. 292-302. [5] D. N. Ku, “Blood Flow in Arteries,” The Annual Review of Fluid Mechanics, Vol. 29, 1997, pp. 399-434. http://dx.doi.org/10.1146/annurev.fluid.29.1.399 [6] R. M. Nerem and M. J. Levesque, “The Case for Fluid Dynamics as a Localizing Factor in Atherogenesis,” In: G. Schettler, R. M. Nerem, H. Schimid-Schronbein, H. Mori and C. Diehm, Eds., Fluid Dynamics as a Localizing Fac- tor for Atherosclerosis, Springer-Verlag, Heidelberg, 1983, pp. 26-37. http://dx.doi.org/10.1007/978-3-642-69085-3_4 [7] C. K. Zarins, D. P. Giddens, B. K. Bharadvaj, V. S. Sotti- urai, R. F. Mabon and S. Glagov, “Carotid Bifurcation Atherosclerosis: Quantitative Correlation of Plaque Loca- lization with Flow Velocity Profiles and Wall Shear Stress,” Circulation Research, Vol. 53, 1983, pp. 502-514. http://dx.doi.org/10.1161/01.RES.53.4.502 [8] B. Liu and D. Tang, “Influence of Non-Newtonian Prop- erties of Blood on the Wall Shear Stress in Human Athe - rosclerotic Right Coronary Arteries,” Molecular & Cel- lular Biomechanics, Vol. 8, No. 1, 2011, pp. 73-90. [9] C. Yang, R. Bach, J. Zheng, I. El Naqa, P. K. Woodard, Z. Teng, K. Billiar and D. Tang, “In Vivo IVUS-Based 3D Fluid Structure Interaction Models with Cyclic Bending and Anisotropic Vessel Properties for Human Atheroscle- rotic Coronary Plaque Mechanical Analysis,” IEEE Tran- sactions on Biomedical Engineering, Vol. 56, No. 10, 2009, pp. 2420-2428. http://dx.doi.org/10.1109/TBME.2009.2025658 [10] B. M. Johnston, P. R. Johnston, S. Corney and D. Kilpa- trick, “Non-Newtonian Blood Flow in Human Right Co- ronary Arteries: Transient Simulations,” Journal of Bio- mechanism, Vol. 39, 2005, pp. 1116-1128. http://dx.doi.org/10.1016/j.jbiomech.2005.01.034 |