

Paper Menu >>
Journal Menu >>
 American Journal of Analytical Chemistry, 2013, 4, 739-743 Published Online December 2013 (http://www.scirp.org/journal/ajac) http://dx.doi.org/10.4236/ajac.2013.412089 Open Access AJAC Analysis of Selenium Content in Root and Tuber Plants in Central Nigeria Saidu Zarmai, Ishaq S. Eneji*, Rufus Sha’Ato Department of Chemistry, Centre for Agrochemical Technology, University of Agriculture, Makurdi, Nigeria Email: *[email protected] Received October 30, 2013; revised November 29, 2013; accepted December 3, 2013 Copyright © 2013 Saidu Zarmai et al. This is an open access article distributed under the Creative Commons Attribution License, which permits unrestricted use, distribution, and reproduction in any medium, provided the original work is properly cited. ABSTRACT Some common staple roots and tubers (cassava, yam, sweet potato and yellow yam) were analyzed for selenium content level using hydride generation—atomic absorption spectrophotometry (HG-ASS) technique. Results for duplicate analysis revealed that sweet potato has the highest mean selenium content (19.2 ± 5.20 μg/kg), followed by yellow yam (18.3 ± 6.97 μg/kg), then yam (13.6 ± 7.12 μg/kg) and cassava the least (13.0 ± 5.84 μg/kg). In comparing our results with the literature values, most of the results obtained in this work such as <1.00, 1.09, 1.91, 2.35 and 11.0 μg/kg were lower while a few others like 52.6, 54.2, 72.3 and 81.8 μg/kg were higher than literature values. The variations could be due to the type of species/variety, geographical location, total selenium concentration in the soil and its bioavailability. In view of the importance of Se to human health and considering the levels found in the staples investigated, we rec- ommend that sweet potato be popularized as a staple, much more than cassava as it is now the case in Central Nigeria. Keywords: Selenium; Content; Roots and Tubers; Central Nigeria; HG-AAS 1. Introduction Selenium (Se) is a naturally occurring metalloid element that is found in all natural materials on earth including rocks, soils, water, air, plant and animal tissues [1,2]. Selenium concentrations in most rock types are generally low. Sedimentary rocks contain more of the elements than igneous rocks; however, concentrations in most lime stones and sandstones rarely exceed 0.05 mg/kg. Se is often associated with the clay fraction in shales (0.06 mg/kg) than lime stones or sandstones. Some phosphatic rocks have very high concentrations up to 300 mg/kg [3]. Consequently, coals and other organic-rich deposits can be enriched in the element relative to other rock types, typically ranging from 1 to 20 mg/kg. However, values of over 600 mg/kg had been found in some black shales and exceptionally high concentrations of 600 mg/kg in Se rich coals were found in China [4]. Se is often found as a minor component of sulphide mineral deposits. Dis- tribution of Se in the geological environment is highly variable, reflecting the properties of different rock types [5]. In most cases, food forms the main source of selenium for humans because the concentrations of the element in water and air are generally low. The concentration of selenium in food stuffs depends primarily upon the sele- nium concentration of the soil on which the food was grown [6]. Brazilian nut contains 554 μg/kg selenium which is the richest staple food in the world. The forage crops containing less than 40 μg/kg selenium are gener- ally associated with deficiency in grazing animals [7]. Selenium concentration of most soils is very low 0.01 to 2 mg/kg but high concentration of up to 1200 mg/kg has been reported in some seleniferous areas [8]. The nutritional importance of selenium has been docu- mented. Its improved consumption may decrease cancer incidence and heart deterioration, arthritis, diabetis and goiter. It has also been reported that increased selenium intake enhances the immune systems of HIV/AIDS and avian flu sufferers. Its improved intake also enhances reproductive fertility in humans and animals [5]. Selenium toxicity (selenosis) is rare in humans, al- though cases have been reported. Selenium poisoning was reported in the United States who consumed a sup- plement that contained 182 times more selenium than stated on the label [9]. Its toxicity depends on concentra- tion and chemical form. Selenate and selenomethionine are among the most selenium toxic compounds whereas *Corresponding author. 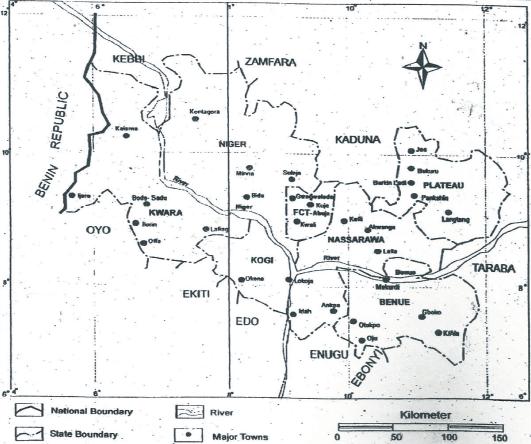 S. ZARMAI ET AL. 740 selenium sulphide is much less toxic due to its insolubil- ity. Selenite has been shown to be toxic at 5 mg/kg of dietary supplementation [10]. The most common symp- toms of selenosis patient include nausea, vomiting, hair loss, nails changes, irritability, fatigue, tooth decay, skin lession and peripheral neuropathy. The approximated safe lower and upper reference nu- trient intake daily allowances of selenium have been re- ported [7,11,12]. Root and tuber crops are staple foods which are the main sources of calories for an estimated 700 million poor people in Africa, Asia and Latin Amer- ica [10]. In Central Nigeria, there may be little or no in- formation available for selenium content of some com- mon roots and tubers. In this work, we therefore obtained cassava, yam, sweet potato and yellow yam samples from thirteen (13) major open markets in Central Nigeria and determined their selenium content. It is believed that these results would add to the data in the field of analyti- cal chemistry. 2. Materials and Methods Samples of cassava, yam, sweet potato and yellow yam were collected from six states in Central Nigeria namely: Niger (Minna and Bida); Nasarrawa (Laffia and Keffi); Benue (Gboko, Makurdi and Otukpo), Kogi (Idah and Lokoja); Kwara (Ilorin and Lafiagi) and Plateau (Jos), including the Federal Capital Territory, Abuja (see Fig- ure 1) in January, 2012. The samples were packed in well labeled polyethylene bags appropriately in respect of food types and area of collection. They were trans- ported to laboratory and washed thoroughly with distilled water to remove adhered soil particles and allowed to dry at ambient laboratory temperature. Each sample was fur- ther oven dried at 105˚C to constant weight for about 24 - 36 h. The Oven dried samples were crushed in a ceramic mortar and pestle; sieved with the mesh of aperture 2 mm and stored in moisture resistance plastic bottles according to standard method [13]. About 1 g of crushed sample was added to 30 mL cru- cible and covered with lid. Sample was dissolved in 10 mL of conc. HNO3 (70.5% - 96% AR). Sample was heated at 60˚C for 30 minutes on a hot plate, then al- lowed to be cooled. 3 mL of H2O2 (30%) was added to the sample. Digestion was continued at 120˚C for 1 h. After cooling the sample, it was diluted with deionized water and finally filtered. The filtrate was diluted to a total volume of 100 mL. The filtrates were stored in sam- ple bottles in refrigerator prior to sample analysis. The same procedure was repeated for other 51 samples. A blank sample was prepared to check the possible con- tamination. Selenium content was determined using hy- dride generator (GBC-HG-3000)—atomic absorption spec- trophotometer (GBC-Avanta). Determinations were in du- plicate. Statistical analysis was carried out using SYS- TAT 16.0 (SPSS, USA). 3. Results and Discussion In this research, a total of fifty-two (52) samples of root and tuber staples were obtained from open markets in Central Nigeria for selenium content investigation. Table 1 shows the results of roots and tubers statistical analysis expressed as number of samples (N), mean values with their standard errors, minimum and maximum values. Selenium content (μg/kg) obtained from cassava sam- Source: Longman School Atlas, 2003. Figure 1. Map of Central Nigeria showing major towns. Open Access AJAC 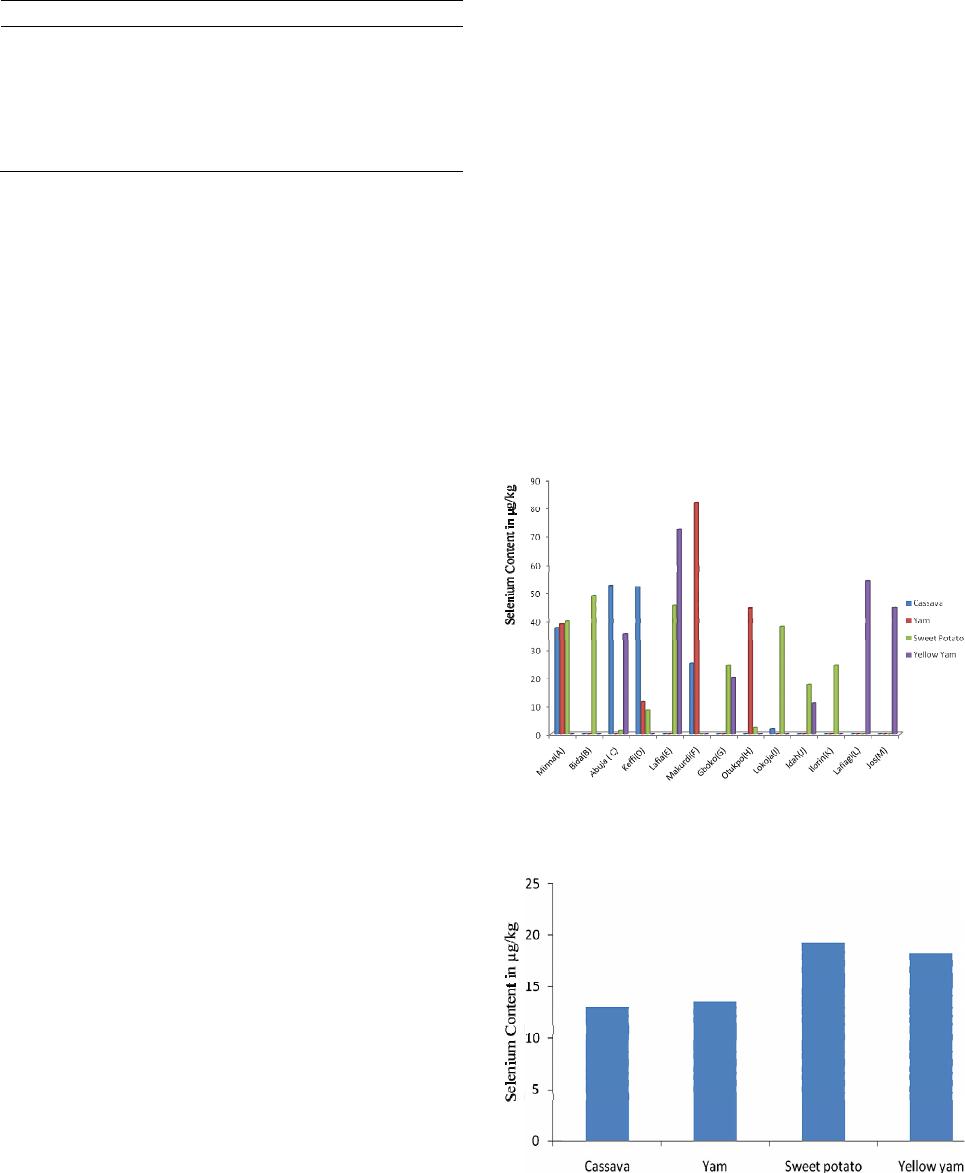 S. ZARMAI ET AL. 741 Table 1. Summary statistics of selenium content (μg/kg) of some common roots and tubers obtained from open mar- kets—Central Nigeria. Roots & tubers N Mean ± SD Minimum Maximum Cassava (Manihot ssp) 13 13.0 ± 5.84 0.01 52.6 Yam (Discorea spp) 13 13.6 ± 7.12 0.01 81.8 Sweet potato (Ipomea batatas) 13 19.2 ± 5.20 0.01 48.7 Yellow yam (Discorea cayensis) 13 18.3 ± 6.97 0.01 72.7 ples in Central Nigeria ranged from 0.01 - 52.6 μg/kg with Abuja sample having the highest (52.6 μg/kg) while Bida, Gboko, Otukpo, Idah, Ilorin, Lafiagi and Jos sam- ples having below the detection limit (<1.00 μg/kg) using hydride generation-atomic absorption spectrophotometer (HG-AAS) with the mean of 13.0 ± 5.84 μg/kg. Selenium content (μg/kg) of yam samples varied between 0.01 - 81.8 μg/kg with Makurdi sample containing the highest (81.8 μg/kg) while Bida, Abuja, Lafia, Gboko, Lokoja, Idah, Ilorin, Lafiagi and Jos samples having below detec- tion limit (<1.00 μg/kg) with the mean of 13.6 ± 7.12 μg/kg. Selenium content (μg/kg) obtained from sweet po- tato samples ranged between 0.01 - 48.7 μg/kg with Bida sample containing the highest (48.7 μg/kg) while Ma- kurdi, Lafiagi and Jos samples having below the detec- tion limit (<1.00 μg/kg) with the mean of 19.2 ± 5.20 μg/kg). Selenium content (μg/kg) obtained from yellow yam samples varied from 0.01 - 76.3 μg/kg with Lafia sample having the highest (76.3 μg/kg) while Minna, Bida, Keffi, Makurdi, Otukpo, Lokoja, and Ilorin sam- ples containing below the detection limit (<1.00 μg/kg) with the mean of 18.3 ± 6.97 μg/kg (Figure 2). Most of the values in this research work fell far bellow the ac- ceptable range of 40 - 450 μg/kg in staple foods specified by National Academy of Science [11] as safe lower and upper reference nutrient intake while few others fell within the range. Statistical analysis of variance (ANOVA) be- tween and within the data of roots and tubers (cassava, yam, sweet potato and yellow yam) showed that there was no significant difference (P > 0.05) in selenium con- tent (μg/kg) determined from these different staples in Central Nigeria. Multiple mean comparisons using Tukey Honest Significant Difference (HSD) test showed that there was no significant difference (P > 0.05) in selenium content (μg/kg) among cassava, yam, sweet potato and yellow yam. The results of this analysis are direct evi- dence that root and tuber staples are non-selenium accu- mulators [11]. Comparing the values obtained with literatures cited, it was observed that most of our results were lower while few others were higher than values reported for foods in the USA (white rice 12 μg/kg, brown rice 10 μg/kg, wal- nuts 5 μg/kg, cod 32 μg/kg, egg 14 μg/kg, bread 4 μg/kg, cheedar cheese 4 μg/kg, Tuna canned 63 μg/kg, Maca- roni 15 μg/kg) [6]. National Academy of Science [11] reported the range of staple foods 40 - 450 μg/kg. Abu- lude et al. [14] also reported high mean of selenium con- tent (cassava flour 10 ± 3.8 mg/kg, yam <2 ± 3.2 mg/kg, millet 5 ± 3.4 mg/kg, maize 5 ± 3.4 mg/kg, soybeans 5 ± 3.0 mg/kg) using Atomic Absorption Spectrophotome- try(AAS). The mean results (Figure 3) of root and tuber foods analysed in this work, revealed that sweet potato has the highest selenium content (19.2 ± 5.20 μg/kg), followed by yellow yam (18.3 ± 6.97 μg/kg), then yam (13.6 ± 7.12 μg/kg) and cassava the least (13.0 ± 5.84 μg/kg). The variations in the selenium contents of the root and tuber staples we selected and those in literatures may be due to the type of species, geographical location, total selenium concentration in the soil, bioavailability of the selenium in the soil and analytical methods used [6]. Differences in the results of this analysis could also be attributed to the presence or absence of anthropogenic activities on the soils such as application of fertilizers, pigment in glass and ceramic manufacture, antifungal Figure 2. Selenium content distribution in µg/kg of some common roots and tubers staples from different sampling areas—Central Nigeria. Figure 3. Mean selenium content (µg/kg) in root and tuber staples using HG-AAS. Open Access AJAC  S. ZARMAI ET AL. 742 agent in pharmaceuticals, fossil fuel combustion and light- sensitive photoconductor layer in photocopiers [4]. Con- sequently, as we consumed a varied diet obtained from many geographical locations, it is not likely that sele- nium deficiency in the soil in a few areas will cause sele- nium deficient in Central Nigerians’ diet. Individual in- takes will differ about the determined mean, depending on the amount of protein in the diet and in particular on the amount of selenium rich foods which are consumed [15]. There have been many documented maximum intakes of selenium. The National Academy of Science [11] re- ported 450 μgSe/day while selenium intake of 400 μgSe/ day has been recommended by WHO [12]. According to Food Standard Australia New Zealand (FSANZ) [16] quoted Australian RDI to be 85 μgSe/day and Nordic project [17] considered an intake of 280 - 350 μgSe/day. Comparison of our analytical results with the litera- tures, it was observed that good food sources of selenium were sweet potato and yellow yam. Yam and cassava contained some significant content of selenium and it is unlikely that selenium deficiency occurs in Central Nige- ria. The values obtained were far below those intakes referred to as the unsafe dose. 4. Conclusion Analysis performed by using HG-AAS technique for Se content indicated that few samples contained below the detection limit while most samples contained relatively large content of the element. The different levels of Se in these roots and tubers investigated could be due to spe- cies or variety differences, total Se concentration in the soil where they were grown, bioavailability of Se in the soil, and local anthropogenic activities; this requires fur- ther investigation to be more conclusive. However, since the mean selenium content in the four roots and tuber staples revealed that sweet potato contained the highest Se, followed by yellow yam, then yam and cassava the least, and considering the importance of Se nutrition to the health conditions of certain populations, it is recom- mended that sweet potato should be made to be a more popular staple rather than cassava, which is now the most popular one. 5. Acknowledgements The authors are highly grateful to the immediate family members for their support and encouragement. Our ap- preciations also go to the members of staff Fugro Nig. Ltd. Port-Harcourt for given us opportunity to use their laboratory for this research work. We are also grateful to the anonymous reviewers for their suggestions which brought our report to this level. REFERENCES [1] V. N. Gladyshev, D. E. Kryukov, G. V. Fomenko and D. L. Hatfield, “Identification of Trace Element—Contain- ing Proteins in Genomic Data Base,” Animals Review Nu- trition, Vol. 24, 2004, pp. 579-596. [2] Y. Chen, M. Hall, J. H. Graziano, V. Skvkovich, A. Van Green, F. Parvez and H. Ahsan, “A Prospective Study of Blood Selenium Levels and the Risk of Arsenic Related Premalignant Skin Lessions,” Cancer Epidemiology Bio- markers and Prevention, Vol. 16, 2007, pp. 207-213. http://dx.doi.org/10.1158/1055-9965.EPI-06-0581 [3] Institute of Medicine, Food and Nutrition Board (IMFNB), “Dietary Reference Intake for Vitamin C, Vitamin E, Se- lenium and Carotenoids,” National Academic Press, Wa- shington DC, 2000. [4] G. F. Combs, “Selenium in Global Food Systems,” Brit- ish Journal of Nutrition, Vol. 85, No. 5, 2001, pp. 517- 547. http://dx.doi.org/10.1079/BJN2000280 [5] “US National Library of Medicine (USNLM) and Na- tional Institutes of Health (NIH),” Medline Plus, 2009, pp. 3-10. [6] O. A. Levander, “The Global Selenium Agenda,” In: L. S. Huley, C. L. Keen, B. Lonnerdal and R. B. Rucker, Eds., Trace Elements in Man and Animals 6, Proceedings of the 6th International Symposium on Trace Elements in Man and Animals, Plenium Press Inc., New York, 2005, pp. 20-26. [7] L. Wu, “Selenium Accumulation and Uptake by Crop and Grassland Plant Species,” In: W. Franken Berger and R. Engberg, Eds., Environmental Chemistry of Selenium, Marcel Dekker, New York, 1998, pp. 657-686. [8] K. S. Dhillon and S. K. Dhillon, “Distribution and Man- agement of Seleniferous Soils,” Advances in Agronomy, Vol. 79, 2003, pp. 119-185. http://dx.doi.org/10.1016/S0065-2113(02)79003-2 [9] National Institute of Health (NIH), NIT Clinical Centre, Office of Dietary Supplements, “Use the Build in Search Function to Find Specific,” 2009, pp. 6-10. [10] Food and Agricultural Organization (FAO), “Prostart,” FAOSTAT, 2006, pp. 12-26. [11] National Academy of Science (NAS), “Dietary Reference Intakes for Vitamin C, Vitamin E, Selenium and Carote- noids,” Washington DC, 2000, pp. 63-65. [12] USEPA, “Recommendation on Maximum Intake Level of Selenium,” In: Selenium Paper Prepared for Considera- tion by Export Group on Vitamins and Minerals, EVM/ 99/171, 1994. [13] WHO/FAO/IAEA, “Trace Elements in Human Nutrition and Health,” World Health Organization, Geneva, 1996, pp. 6-10. [14] F. O. Abulude, M. O. Ogunkoya and T. A. Oroko, “Sele- nium in Nigeria Foods,” Federal College of Agriculture. Akure, 2006, pp. 1-8. [15] M. Rayman, “The Importance of Selenium to Human Health,” The Lancet, Vol. 356, No. 9225, 2008, pp. 233- 241. http://dx.doi.org/10.1016/S0140-6736(00)02490-9 [16] Food Standard Australia New Zealand (FSANZ), “Metals Open Access AJAC S. ZARMAI ET AL. Open Access AJAC 743 and Other Substance Selenium,” Total Diet Survey, Part B, 2002. [17] Nordic Group, “Risk Evaluation of Essential Trace Ele- ments. Essential versus Toxic Levels of Intake,” Nordic Council of Ministers, Nord, 1995. |