

Paper Menu >>
Journal Menu >>
 Journal of Cancer Therapy, 2013, 4, 33-43 Published Online December 2013 (http://www.scirp.org/journal/jct) http://dx.doi.org/10.4236/jct.2013.411A005 Open Access JCT 33 The Dosimetric Effects of Different Beam Energy on Physical Dose Distributions in IMRT Based on Analysis of Physical Indices Ismail Eldesoky1, Ehab M. Attalla1,2, Wael M. Elshemey3 1Children’s Cancer Hospital, Cairo, Egypt; 2National Cancer Institute, Cairo University, Cairo, Egypt; 3Department of Biophysics, Faculty of Science, Cairo University, Cairo, Egypt. Email: [email protected] Received November 15th, 2013; revised December 6th, 2013; accepted December 13th, 2013 Copyright © 2013 Ismail Eldesoky et al. This is an open access article distributed under the Creative Commons Attribution License, which permits unrestricted use, distribution, and reproduction in any medium, provided the original work is properly cited. ABSTRACT This work aimed at evaluating the effect of 6- and 10-MV photon energies on intensity-modulated radiation therapy (IMRT) treatment plan outcome in different selected diagnostic cases. For such purpose, 19 patients, with different types of non CNS solid tumers, were selected. Clinical step-and-shoot IMRT treatment plans were designed for delivery on a Siemens Oncor accelerator with 82 leafs; multi-leaf collimators (MLCs). To ensure that the similarity or difference among the plans is due to energy alone, the same optimization constraints were applied for both energy plans. All the parame- ters like beam angles, number of beams, were kept constant to achieve the same clinical objectives. The Comparative evaluation was based on dose-volumetric analysis of both energy IMRT plans. Both qualitative and quantitative meth- ods were used. Several physical indices for Planning Target Volume (PTV), the relevant Organs at Risk (OARs) as mean dose (Dmean), maximum dose (Dmax), 95% dose (D95), integral dose, total number of segments, and the number of MU were applied. Homogeneity index and conformation number were two other evaluation parameters that were considered in this study. Collectively, the use of 6 MV photons was dosimetrically comparable with 10 MV photons in terms of target coverage, homogeneity, conformity, and OAR savings. While 10-MV plans showed a significant reduc- tion in the number of MUs that varied between 4.2% and 16.6% (P-value = 0.0001) for the different cases compared to 6-MV. The percentage volumes of each patient receiving 2 Gy and 5 Gy were compared for the two energies. The gen- eral trend was that 6-MV plans had the highest percentage volume, (P-value = 0.0001, P-value = 0.006) respectively. 10-MV beams actually decreased the integral dose (from average 183.27 ± 152.38 Gy-Kg to 178.08 ± 147.71 Gy-Kg, P-value = 0.004) compared with 6-MV. In general, comparison of the above parameters showed statistically significant differences between 6-MV and 10-MV groups. Based on the present results, the 10-MV is the optimal energy for IMRT, regardless of the concerns about a potential risk of radiation-induced malignancies. It is recommended that the choice to treat at 10 MV be taken as a risk vs. benefit as the clinical significance remains to be determined on case by case basis. Keywords: 6- and 10-MV Photon Energies; Intensity-Modulated Radiation Therapy (IMRT); Dose-Volumetric Analysis 1. Introduction The goal of radiation therapy is to deliver a lethal amount of dose to target volumes while sparing the surrounding tissues. Intensity-modulated radiation therapy (IMRT) can deliver the conformal dose distributions by varying radiation intensities within each field according to the fluence maps optimized by a treatment planning system (TPS). IMRT is known to improve target coverage and provide better organ-at-risk (OAR) sparing in compari- son with 3D-conformal radiotherapy [1]. For deep-seated tumor treatment, particularly for lar- ger target volumes or larger size patients, using high en- ergy photon is more suitable than low energy photon because of its better penetrating power, skin sparing ef- fect, conformity on PTV, and less normal tissue doses. Benefits of low energy include the narrow penumbra which results in tighter dose distributions around a target, minimizing irradiation of nearby OARs, negligible neu- tron contamination, minimizing the head leakage, internal  The Dosimetric Effects of Different Beam Energy on Physical Dose Distributions in IMRT Based on Analysis of Physical Indices 34 scatter. However, there are indications provided by cer- tain investigations that the regions near beam entry re- ceive higher doses and generally a more complex plan containing a greater number of fields, beam segments, and MU are required when low energy is used. This in- creases treatment delivery times, integral doses. Adverse skin reactions are also a concern for low-energy treat- ment of deep-seated targets, particularly in large patients [2]. Higher energy tends to increase the risk of induction of secondary malignancies because there are greater leakage, treatment head scatter, patient scatter and particularly photo-neutron contribution [3]. Moreover, high energy beams increasingly diffused beam boundaries due to the long lateral range of secondary electrons [4]. But, there are some indications in a literature of providing better dose coverage to the tumour target, while also improving normal tissue sparing. However, IMRT is associated with an increase in the number of monitor units (MUs), treatment time, and amount of leakage relative to three-dimensional confor- mal radiation therapy (3DCRT), which has led to con- cerns about a potential increased risk of fatal second cancers [5]. It has been reported for 6-MV 3D-CRT and IMRT prostate treatments to vary by 0.6% - 1.5% and 1% - 3.0%, respectively. For 15-MV photons, the risk has been reported to be 3.4% [6]. Therefore, the choice of optimal energy is an issue of interest and the present study is concerned with introducing an experience with some indications that were chosen to represent common cases seen in the extracranial region. 2. Materials and Methods 2.1. Patient Population For this study, we retrospectively selected a cohort of 19 patients affected by different types of non CNS solid tumers cancer. A computed tomography (CT) simulation for each patient was acquired according to departmental protocol and all patient details were anonymised. All the patients’ image sets were chosen such that, there was not much variation in their anatomy. All the patients’ Anterior-Posterior (AP) and lateral dimensions were very close. The mean anterior-posterior (AP) sepa- ration of these patients was 25.6 cm and the mean lateral separation was 39.5 cm. The planning target volume var- ied from 69.65 to 2827.65 cc (Table 1). 2.2. Treatment Planning At our center, 6-MV and 10-MV treatments were deliv- ered on Siemens (Siemens Medical Solutions, Malvern, PA) ONCOR Expression linear accelerator with an 82 multi-leaf collimator (MLC). The clinical IMRT treat- Table 1. Showed the diagnosis, prescription dose, PTV vol- ume, patient volume for the investigated cases. Site Prescribed Dose (cGy) PTV Volume (CC) Patient Volume (cc) Prostate 7770 185.32 15587.72 Prostate 6000 132.21 11546.46 Prostate 7600 120.08 7133.1 Prostate 7600 86.43 9376.82 Prostate 7600 180.67 12012.73 Prostate 7812 215.44 12878.17 Prostate 7600 619.3 12687.04 Prostate 6000 179.17 22601.82 Pelvis 6000 141.23 10677.87 Abdopelvic Mass4500 69.65 1923.2 Abdomen 5040 682.64 4456.22 Abdomen 2160 168.06 3591.77 Supra Renal Gland2160 344 4714.47 Paraortic Mass 5000 1350.54 12123.49 Paravertebral Mass3600 303.7 7884.06 Lung 6000 572.24 11967.63 Lung 6300 382.8 16657.31 Mediastinal 3600 643.49 7611.67 Anal Canal 5040 2827.65 22573.05 ment plans were designed using the KonRad (MRC Sys- tems GmbH, Heidelberg, Germany) inverse planning soft- ware release 2.2.23. Dose is calculated using the Multi- kernel pencil beam algorithm and full three-dimensional ray-tracing with a grid size of 2 mm. All the patients were treated using 6-MV plans then for study purposes only, and according to hospital re- search protocol, 10-MV step and shoot IMRT plans were created retrospectively for each patient. To ensure that the similarity or difference between the plans is due to energy alone, the same optimization constraints was ap- plied for each energy planning and all other parameters like beam angles, number of beams, were kept constant. The IMRT plans were created using 7 - 11 coplanar and non-opposed fields selected to achieve the plan goals. Fields were selected so that all entrance and exit beams were spaced about the patient [7]. The clinical dose constraints used for these plans were in accordance with Radiation Therapy Oncology Group (RTOG) protocol. The three following objectives should be achieved: 1) target coverage (95% of the prescribed dose covered at least 95% of the PTV while the PTV volume receiving more than 107% of the prescription dose is limited to zero), 2) OAR sparing to the RTOG limits, 3) sparing of healthy tissue (the CT dataset patient Open Access JCT  The Dosimetric Effects of Different Beam Energy on Physical Dose Distributions in IMRT Based on Analysis of Physical Indices 35 volume minus the volume of the largest target) (Stein et al. 1997) [8]. We created additional structures in order to control the dose distribution during optimization. Typi- cally, these optimization-only structures were boolean combinations of targets and normal tissues. In most of the cases the optimization algorithm could not achieve all the demands at the same time, so only dose volume constraints were modified during the opti- mization process by either tightening or relaxing the dose-volume histograms (DVHs) to fit the patient-spe- cific differences in the structures of interest. This might cause biased results rather than fair comparisons. There- fore, the OAR dose-volume constraints only were modi- fied unless the PTV coverage and uniformity were chang- ed dramatically. The planning was done by a single phy- sicist and the clinical aspects were reviewed by a single oncologist. 2.3. Comparative Evaluation Dose-volumetric analysis of both energy IMRT plans was performed by both qualitative and quantitative methods. Target coverage was evaluated according to compare ma- ximum and means doses to PTV as well as several phy- sical indices (D98% (cGy), D95% (cGy), D5% (cGy), V95% (%) and V107% (%)) were calculated. Where Dn is the minimum dose delivered by n% of the PTV. Homogeneity of dose within PTV has been evaluated by using homogeneity in- dex (HI) as defined by 5% 95% HI DD where D5% and D95% represent the dose levels on the dose-volume histogram (DVH) curve corresponding to 5% and 95% of the target volume, respectively. The val- ues of HI close to unity indicate greater homogeneity. Conformity of high dose around the target has been evaluated by Conformation number (CN) as described by Van’t Riet et al. (1997) because it took into account irra- diation of the target volume and irradiation of healthy tissues [9]. This number was defined as follows: RIRI RI CNTVTV TVV where CN = conformation number, TVRI = target volume covered by the reference isodose, TV = target volume, and VRI = volume of the reference isodose and according to the ICRU the reference isodose used was isodose 95%. The dose-volume parameters for organ at risk were analyzed for each plan at 6 and 10 MV by comparing several physical indices. For rectum wall and bladder in prostate cases, Irradiated volumes that received at least 70, 66.6, 50, 40 and 20 Gy (V70 Gy, V66.6 Gy, V50 Gy, V40 Gy, V20 Gy), also the mean doses (Dmean) and D50% were cal- culated. Irradiated volumes receiving more than 50, 45, and 30 Gy (V50 Gy, V45 Gy, and V30 Gy) and Dmean, D50% to the femoral heads were calculated. While in lung cases, irradiated volumes receiving more than 5, 10, 20, and 30 Gy (V5 Gy, V10 Gy, V20 Gy and V30 Gy) also Dmean, D1% and D5% of the lung were calculated. In the rest of cases the mean doses were calculated for kidney and liver. In this work, the integral dose (ID) was calculated as the product of the mean dose in Gy for the external con- tour and the mass of the external contour in Kg [10]. For simplicity, the mass of the external contour was taken as the product of its volume and a tissue density of 1 g/cm3. The integral dose has been defined for n voxels by nn ii iii ii ID DmDV where Di, mi, Vi, ρi are the dose, mass, volume, and den- sity of voxel i. Statistical Analyses Analyses were performed by using a paired t-test to de- termine dose-volumetric differences for 6-MV vs. 10- MV, plans. Differences were considered statistically sig- nificant at p ≤ 0.05. 3. Results 3.1. Conformity and Homogeneity of the Target Figure 1 showed the DVH’s for both of the 6-MV and 10-MV treatment plans for some of the investigated cases. The 6 MV plans results were displayed as solid lines and the 10 MV plans results as dashed lines. In most of the cases both energy plans achieved similar PTV coverage. The target coverage parameters at 6 and 10 MV are indicated in (Table 2). Figures 2 and 3 pre- sented the homogeneity index and the dose-volume para- meters for the PTV such as D98%, D95% and D5%. A quantitative analysis was carried out to compare the results. There were no clear differences in the homoge- neity index among 6 MV, 10 MV (average 1.104 ± 0.021, 1.103 ± 0.023, p < 0.541). Most of the dose volume in- dices for the PTV are slightly better for the 6-MV treat- ment plans than for the 10-MV plans and it was statisti- cally significant at D5% (p < 0.026). Such a small dif- ference indicates that the low entrance dose from the high-energy beam is, in effect, compensated by the high exit dose. There were no differences on target conformity between the 6-MV treatment plan and the 10-MV plan (average 0.691 ± 0.088, 0.691 ± 0.087 for CN of 6-MV and 10-MV, p < 0.421) (Figure 4). 3.2. Sparing Organ at Risk 3.2.1. Dose to Rectum W all The rectal wall volumes of 6 MV plans that received 40 Gy (V40 Gy) were larger than those of 10 MV plans (av- erage 50.97% ± 18.09% vs. .85% ± 18.62%). The av- 49 Open Access JCT 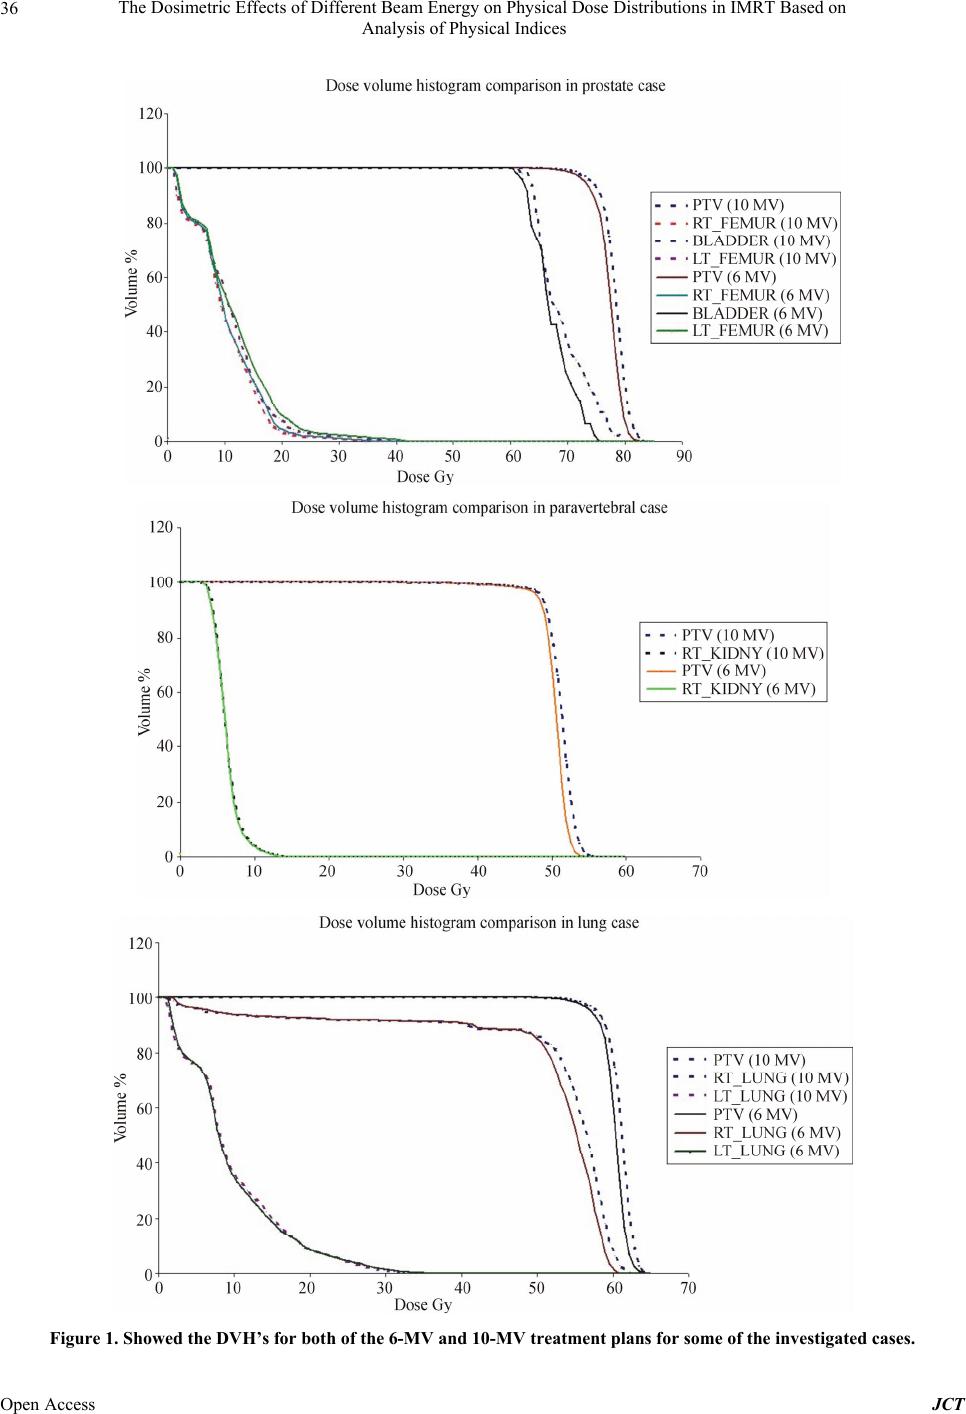 The Dosimetric Effects of Different Beam Energy on Physical Dose Distributions in IMRT Based on Analysis of Physical Indices Open Access JCT 36 Figure 1. Showed the DVH’s for both of the 6-MV and 10-MV treatment plans for some of the investigated cases. 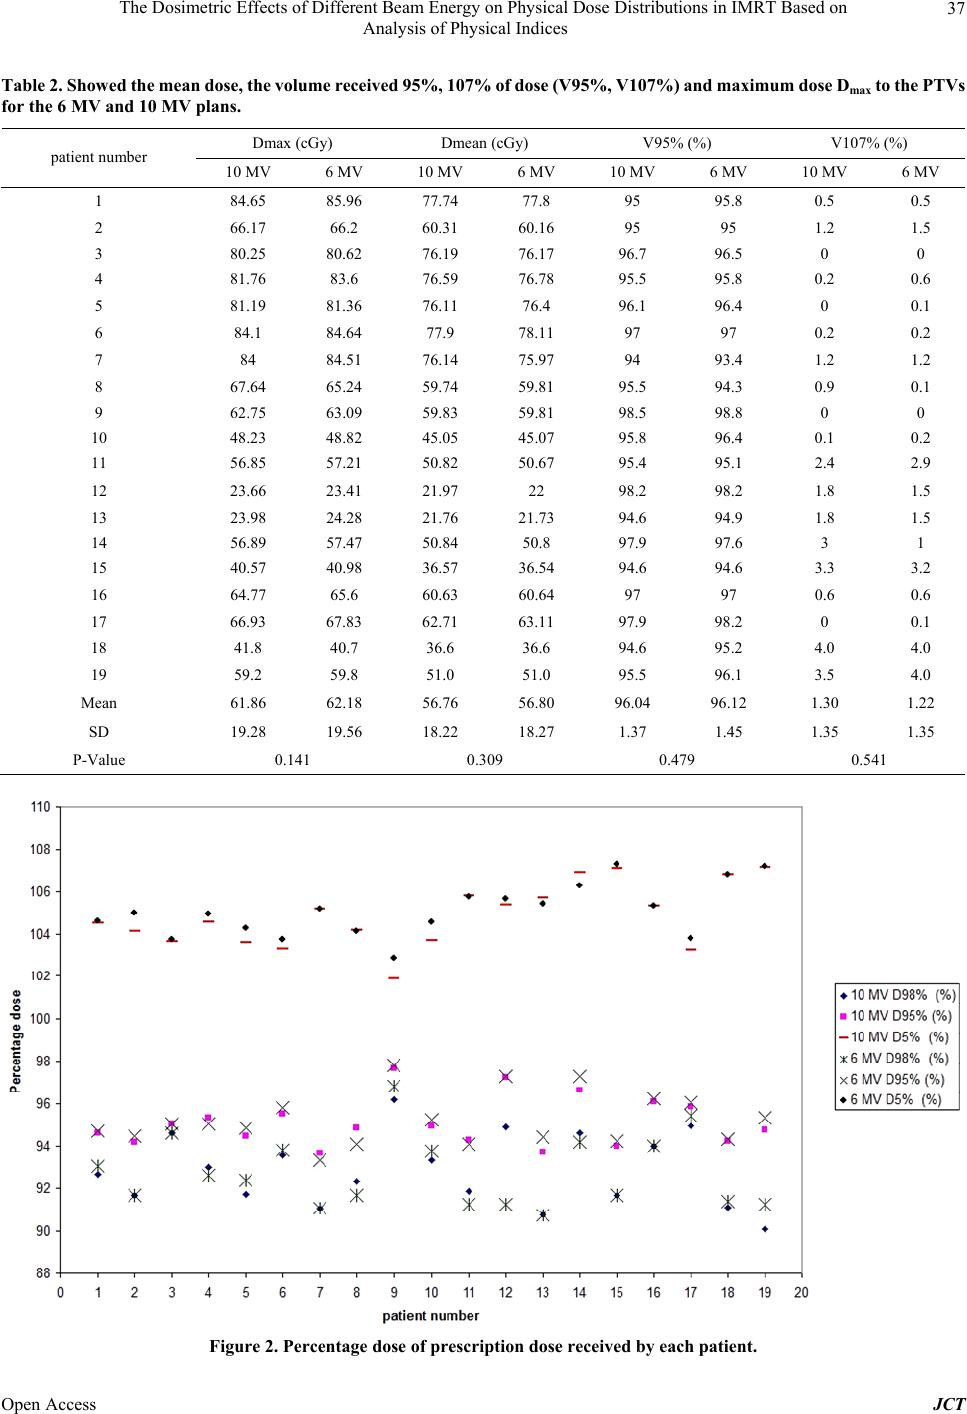 The Dosimetric Effects of Different Beam Energy on Physical Dose Distributions in IMRT Based on Analysis of Physical Indices 37 Table 2. Showed the mean dose, the volume received 95%, 107% of dose (V95%, V107%) and maximum dose Dmax to the PTVs for the 6 MV and 10 MV plans. Dmax (cGy) Dmean (cGy) V95% (%) V107% (%) patient number 10 MV 6 MV 10 MV 6 MV 10 MV 6 MV 10 MV 6 MV 1 84.65 85.96 77.74 77.8 95 95.8 0.5 0.5 2 66.17 66.2 60.31 60.16 95 95 1.2 1.5 3 80.25 80.62 76.19 76.17 96.7 96.5 0 0 4 81.76 83.6 76.59 76.78 95.5 95.8 0.2 0.6 5 81.19 81.36 76.11 76.4 96.1 96.4 0 0.1 6 84.1 84.64 77.9 78.11 97 97 0.2 0.2 7 84 84.51 76.14 75.97 94 93.4 1.2 1.2 8 67.64 65.24 59.74 59.81 95.5 94.3 0.9 0.1 9 62.75 63.09 59.83 59.81 98.5 98.8 0 0 10 48.23 48.82 45.05 45.07 95.8 96.4 0.1 0.2 11 56.85 57.21 50.82 50.67 95.4 95.1 2.4 2.9 12 23.66 23.41 21.97 22 98.2 98.2 1.8 1.5 13 23.98 24.28 21.76 21.73 94.6 94.9 1.8 1.5 14 56.89 57.47 50.84 50.8 97.9 97.6 3 1 15 40.57 40.98 36.57 36.54 94.6 94.6 3.3 3.2 16 64.77 65.6 60.63 60.64 97 97 0.6 0.6 17 66.93 67.83 62.71 63.11 97.9 98.2 0 0.1 18 41.8 40.7 36.6 36.6 94.6 95.2 4.0 4.0 19 59.2 59.8 51.0 51.0 95.5 96.1 3.5 4.0 Mean 61.86 62.18 56.76 56.80 96.04 96.12 1.30 1.22 SD 19.28 19.56 18.22 18.27 1.37 1.45 1.35 1.35 P-Value 0.141 0.309 0.479 0.541 Figure 2. Percentage dose of prescription dose received by each patient. Open Access JCT 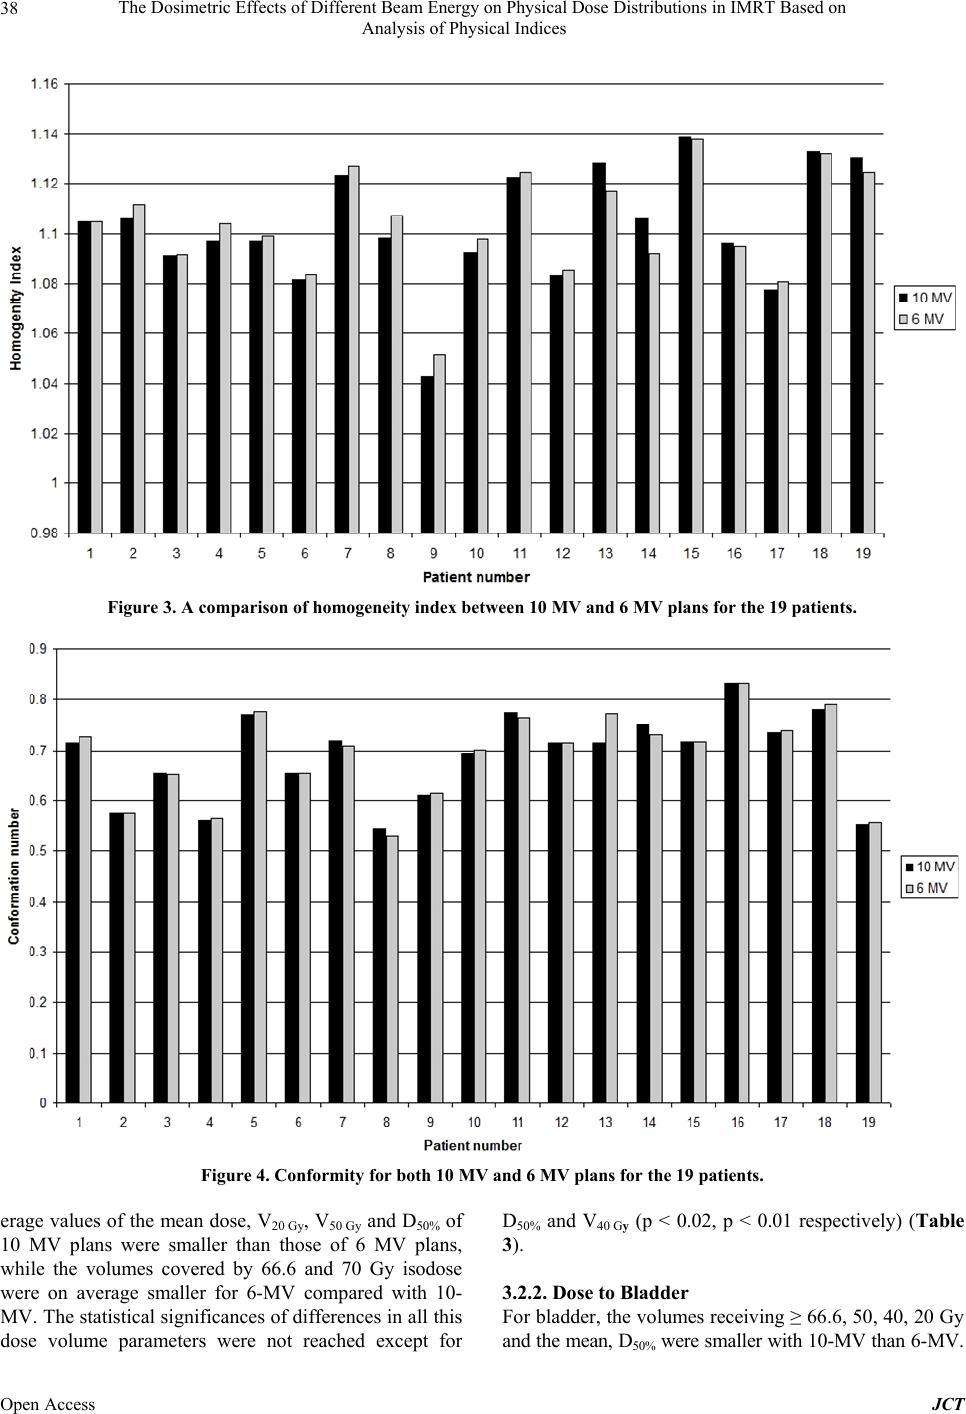 The Dosimetric Effects of Different Beam Energy on Physical Dose Distributions in IMRT Based on Analysis of Physical Indices Open Access JCT 38 Figure 3. A comparison of homogeneity index between 10 MV and 6 MV plans for the 19 patients. Figure 4. Conformity for both 10 MV and 6 MV plans for the 19 patients. erage values of the mean dose, V20 Gy, V50 Gy and D50% of 10 MV plans were smaller than those of 6 MV plans, while the volumes covered by 66.6 and 70 Gy isodose were on average smaller for 6-MV compared with 10- MV. The statistical significances of differences in all this dose volume parameters were not reached except for D50% and V40 Gy (p < 0.02, p < 0.01 respectively) (Table 3). 3.2.2. Dose to Blad de r For bladder, the volumes receiving ≥ 66.6, 50, 40, 20 Gy and the mean, D50% were sma ler with 10-MV than 6-MV. l 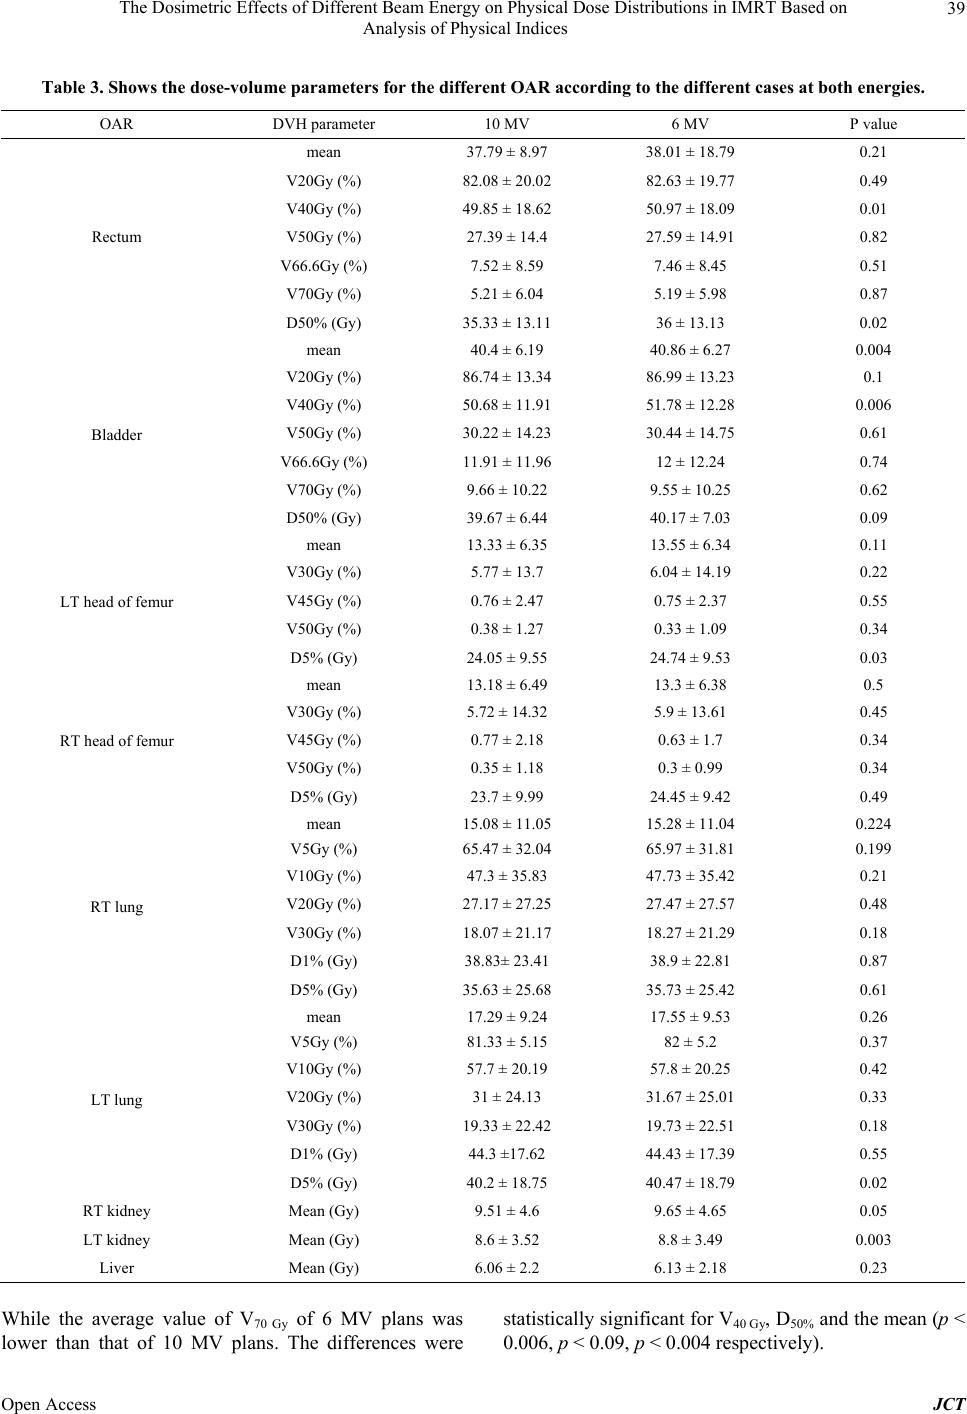 The Dosimetric Effects of Different Beam Energy on Physical Dose Distributions in IMRT Based on Analysis of Physical Indices 39 Table 3. Shows the dose-volume parameters for the different OAR according to the different cases at both energies. OAR DVH parameter 10 MV 6 MV P value mean 37.79 ± 8.97 38.01 ± 18.79 0.21 V20Gy (%) 82.08 ± 20.02 82.63 ± 19.77 0.49 V40Gy (%) 49.85 ± 18.62 50.97 ± 18.09 0.01 V50Gy (%) 27.39 ± 14.4 27.59 ± 14.91 0.82 V66.6Gy (%) 7.52 ± 8.59 7.46 ± 8.45 0.51 V70Gy (%) 5.21 ± 6.04 5.19 ± 5.98 0.87 Rectum D50% (Gy) 35.33 ± 13.11 36 ± 13.13 0.02 mean 40.4 ± 6.19 40.86 ± 6.27 0.004 V20Gy (%) 86.74 ± 13.34 86.99 ± 13.23 0.1 V40Gy (%) 50.68 ± 11.91 51.78 ± 12.28 0.006 V50Gy (%) 30.22 ± 14.23 30.44 ± 14.75 0.61 V66.6Gy (%) 11.91 ± 11.96 12 ± 12.24 0.74 V70Gy (%) 9.66 ± 10.22 9.55 ± 10.25 0.62 Bladder D50% (Gy) 39.67 ± 6.44 40.17 ± 7.03 0.09 mean 13.33 ± 6.35 13.55 ± 6.34 0.11 V30Gy (%) 5.77 ± 13.7 6.04 ± 14.19 0.22 V45Gy (%) 0.76 ± 2.47 0.75 ± 2.37 0.55 V50Gy (%) 0.38 ± 1.27 0.33 ± 1.09 0.34 LT head of femur D5% (Gy) 24.05 ± 9.55 24.74 ± 9.53 0.03 mean 13.18 ± 6.49 13.3 ± 6.38 0.5 V30Gy (%) 5.72 ± 14.32 5.9 ± 13.61 0.45 V45Gy (%) 0.77 ± 2.18 0.63 ± 1.7 0.34 V50Gy (%) 0.35 ± 1.18 0.3 ± 0.99 0.34 RT head of femur D5% (Gy) 23.7 ± 9.99 24.45 ± 9.42 0.49 mean 15.08 ± 11.05 15.28 ± 11.04 0.224 V5Gy (%) 65.47 ± 32.04 65.97 ± 31.81 0.199 V10Gy (%) 47.3 ± 35.83 47.73 ± 35.42 0.21 V20Gy (%) 27.17 ± 27.25 27.47 ± 27.57 0.48 V30Gy (%) 18.07 ± 21.17 18.27 ± 21.29 0.18 D1% (Gy) 38.83± 23.41 38.9 ± 22.81 0.87 RT lung D5% (Gy) 35.63 ± 25.68 35.73 ± 25.42 0.61 mean 17.29 ± 9.24 17.55 ± 9.53 0.26 V5Gy (%) 81.33 ± 5.15 82 ± 5.2 0.37 V10Gy (%) 57.7 ± 20.19 57.8 ± 20.25 0.42 V20Gy (%) 31 ± 24.13 31.67 ± 25.01 0.33 V30Gy (%) 19.33 ± 22.42 19.73 ± 22.51 0.18 D1% (Gy) 44.3 ±17.62 44.43 ± 17.39 0.55 LT lung D5% (Gy) 40.2 ± 18.75 40.47 ± 18.79 0.02 RT kidney Mean (Gy) 9.51 ± 4.6 9.65 ± 4.65 0.05 LT kidney Mean (Gy) 8.6 ± 3.52 8.8 ± 3.49 0.003 Liver Mean (Gy) 6.06 ± 2.2 6.13 ± 2.18 0.23 While the average value of V70 Gy of 6 MV plans was lower than that of 10 MV plans. The differences were statistically significant for V40 Gy, D50% and the mean (p < 0.006, p < 0.09, p < 0.004 respectively). Open Access JCT 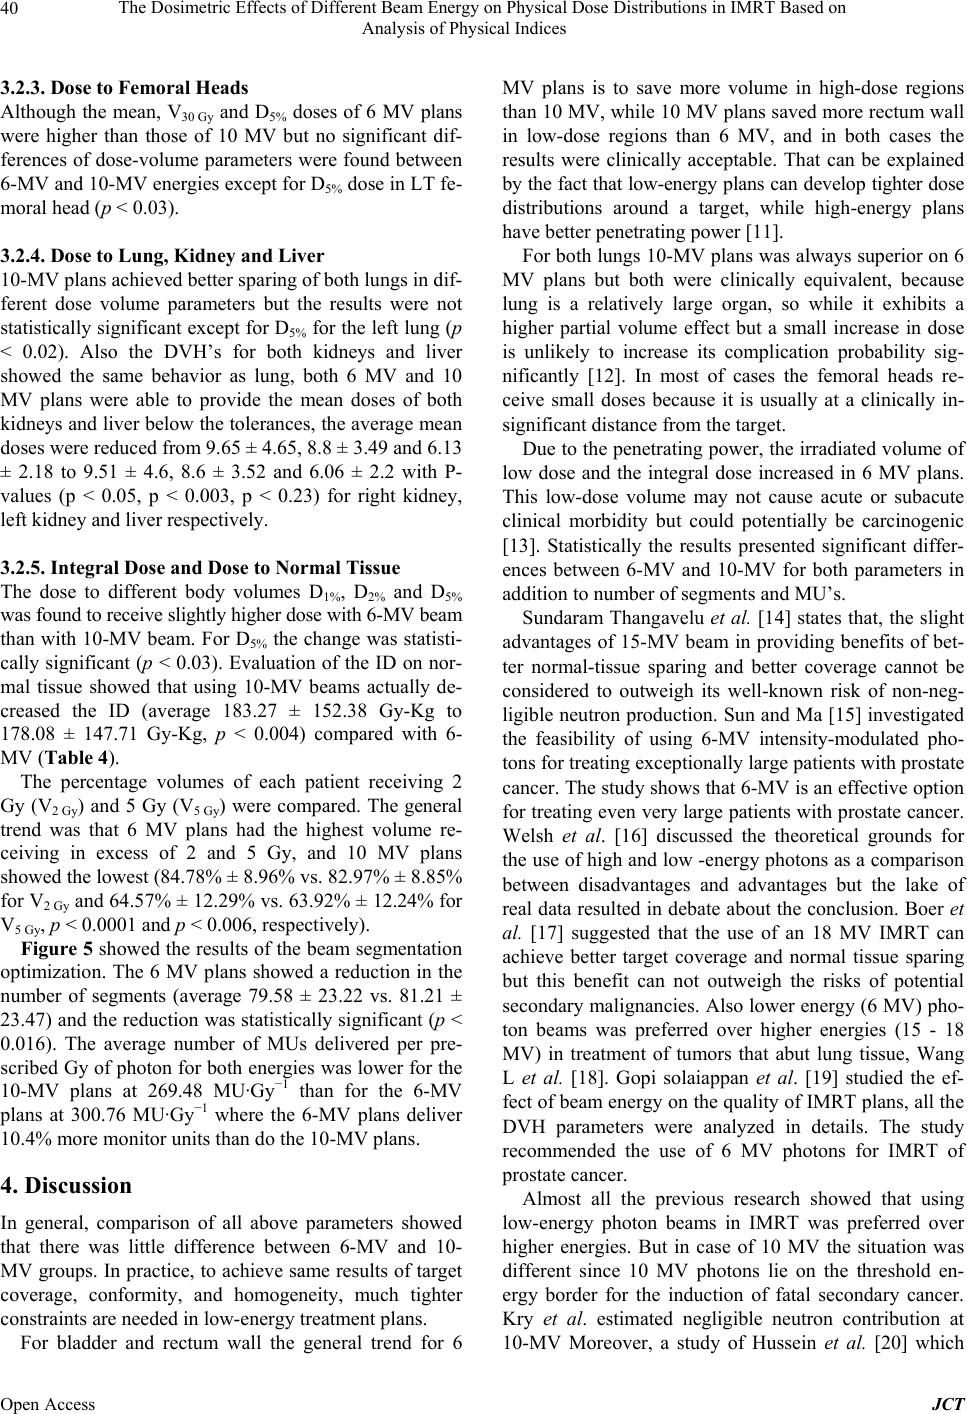 The Dosimetric Effects of Different Beam Energy on Physical Dose Distributions in IMRT Based on Analysis of Physical Indices 40 3.2.3. Dose to Femor al Heads Although the mean, V30 Gy and D5% doses of 6 MV plans were higher than those of 10 MV but no significant dif- ferences of dose-volume parameters were found between 6-MV and 10-MV energies except for D5% dose in LT fe- moral head (p < 0.03). 3.2.4. Dose to Lung, Kidney and Liver 10-MV plans achieved better sparing of both lungs in dif- ferent dose volume parameters but the results were not statistically significant except for D5% for the left lung (p < 0.02). Also the DVH’s for both kidneys and liver showed the same behavior as lung, both 6 MV and 10 MV plans were able to provide the mean doses of both kidneys and liver below the tolerances, the average mean doses were reduced from 9.65 ± 4.65, 8.8 ± 3.49 and 6.13 ± 2.18 to 9.51 ± 4.6, 8.6 ± 3.52 and 6.06 ± 2.2 with P- values (p < 0.05, p < 0.003, p < 0.23) for right kidney, left kidney and liver respectively. 3.2.5. Integral Dose and Dose to Normal Tissue The dose to different body volumes D1%, D2% and D5% was found to receive slightly higher dose with 6-MV beam than with 10-MV beam. For D5% the change was statisti- cally significant (p < 0.03). Evaluation of the ID on nor- mal tissue showed that using 10-MV beams actually de- creased the ID (average 183.27 ± 152.38 Gy-Kg to 178.08 ± 147.71 Gy-Kg, p < 0.004) compared with 6- MV (Table 4). The percentage volumes of each patient receiving 2 Gy (V2 Gy) and 5 Gy (V5 Gy) were compared. The general trend was that 6 MV plans had the highest volume re- ceiving in excess of 2 and 5 Gy, and 10 MV plans showed the lowest (84.78% ± 8.96% vs. 82.97% ± 8.85% for V2 Gy and 64.57% ± 12.29% vs. 63.92% ± 12.24% for V5 Gy, p < 0.0001 and p < 0.006, respectively). Figure 5 showed the results of the beam segmentation optimization. The 6 MV plans showed a reduction in the number of segments (average 79.58 ± 23.22 vs. 81.21 ± 23.47) and the reduction was statistically significant (p < 0.016). The average number of MUs delivered per pre- scribed Gy of photon for both energies was lower for the 10-MV plans at 269.48 MU·Gy−1 than for the 6-MV plans at 300.76 MU·Gy−1 where the 6-MV plans deliver 10.4% more monitor units than do the 10-MV plans. 4. Discussion In general, comparison of all above parameters showed that there was little difference between 6-MV and 10- MV groups. In practice, to achieve same results of target coverage, conformity, and homogeneity, much tighter constraints are needed in low-energy treatment plans. For bladder and rectum wall the general trend for 6 MV plans is to save more volume in high-dose regions than 10 MV, while 10 MV plans saved more rectum wall in low-dose regions than 6 MV, and in both cases the results were clinically acceptable. That can be explained by the fact that low-energy plans can develop tighter dose distributions around a target, while high-energy plans have better penetrating power [11]. For both lungs 10-MV plans was always superior on 6 MV plans but both were clinically equivalent, because lung is a relatively large organ, so while it exhibits a higher partial volume effect but a small increase in dose is unlikely to increase its complication probability sig- nificantly [12]. In most of cases the femoral heads re- ceive small doses because it is usually at a clinically in- significant distance from the target. Due to the penetrating power, the irradiated volume of low dose and the integral dose increased in 6 MV plans. This low-dose volume may not cause acute or subacute clinical morbidity but could potentially be carcinogenic [13]. Statistically the results presented significant differ- ences between 6-MV and 10-MV for both parameters in addition to number of segments and MU’s. Sundaram Thangavelu et al. [14] states that, the slight advantages of 15-MV beam in providing benefits of bet- ter normal-tissue sparing and better coverage cannot be considered to outweigh its well-known risk of non-neg- ligible neutron production. Sun and Ma [15] investigated the feasibility of using 6-MV intensity-modulated pho- tons for treating exceptionally large patients with prostate cancer. The study shows that 6-MV is an effective option for treating even very large patients with prostate cancer. Welsh et al. [16] discussed the theoretical grounds for the use of high and low -energy photons as a comparison between disadvantages and advantages but the lake of real data resulted in debate about the conclusion. Boer et al. [17] suggested that the use of an 18 MV IMRT can achieve better target coverage and normal tissue sparing but this benefit can not outweigh the risks of potential secondary malignancies. Also lower energy (6 MV) pho- ton beams was preferred over higher energies (15 - 18 MV) in treatment of tumors that abut lung tissue, Wang L et al. [18]. Gopi solaiappan et al. [19] studied the ef- fect of beam energy on the quality of IMRT plans, all the DVH parameters were analyzed in details. The study recommended the use of 6 MV photons for IMRT of prostate cancer. Almost all the previous research showed that using low-energy photon beams in IMRT was preferred over higher energies. But in case of 10 MV the situation was different since 10 MV photons lie on the threshold en- ergy border for the induction of fatal secondary cancer. Kry et al. estimated negligible neutron contribution at 10-MV Moreover, a study of Hussein et al. [20] which Open Access JCT 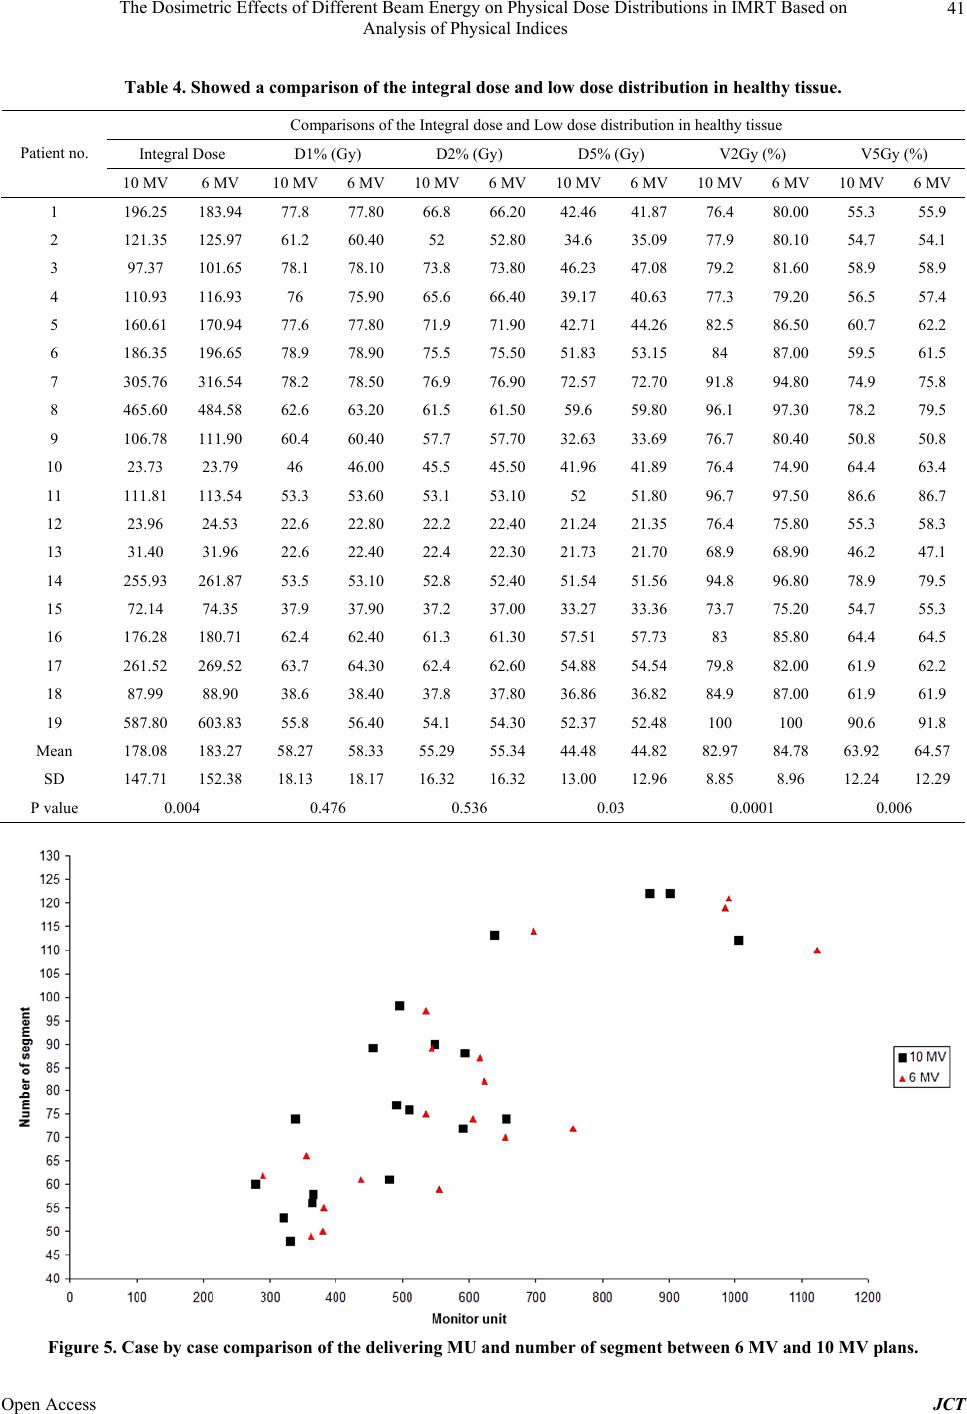 The Dosimetric Effects of Different Beam Energy on Physical Dose Distributions in IMRT Based on Analysis of Physical Indices Open Access JCT 41 Table 4. Showed a comparison of the integral dose and low dose distribution in healthy tissue. Comparisons of the Integral dose and Low dose distribution in healthy tissue Integral Dose D1% (Gy) D2% (Gy) D5% (Gy) V2Gy (%) V5Gy (%) Patient no. 10 MV 6 MV 10 MV 6 MV10 MV6 MV10 MV6 MV10 MV 6 MV 10 MV6 MV 1 196.25 183.94 77.8 77.80 66.8 66.2042.46 41.87 76.4 80.00 55.3 55.9 2 121.35 125.97 61.2 60.4052 52.80 34.6 35.09 77.9 80.10 54.7 54.1 3 97.37 101.65 78.1 78.10 73.8 73.8046.23 47.08 79.2 81.60 58.9 58.9 4 110.93 116.9376 75.90 65.6 66.4039.17 40.63 77.3 79.20 56.5 57.4 5 160.61 170.94 77.6 77.80 71.9 71.9042.71 44.26 82.5 86.50 60.7 62.2 6 186.35 196.65 78.9 78.90 75.5 75.5051.83 53.1584 87.00 59.5 61.5 7 305.76 316.54 78.2 78.50 76.9 76.9072.57 72.70 91.8 94.80 74.9 75.8 8 465.60 484.58 62.6 63.20 61.5 61.5059.6 59.80 96.1 97.30 78.2 79.5 9 106.78 111.90 60.4 60.40 57.7 57.7032.63 33.69 76.7 80.40 50.8 50.8 10 23.73 23.79 46 46.00 45.5 45.5041.96 41.89 76.4 74.90 64.4 63.4 11 111.81 113.54 53.3 53.60 53.1 53.1052 51.80 96.7 97.50 86.6 86.7 12 23.96 24.53 22.6 22.80 22.2 22.4021.24 21.35 76.4 75.80 55.3 58.3 13 31.40 31.96 22.6 22.40 22.4 22.3021.73 21.70 68.9 68.90 46.2 47.1 14 255.93 261.87 53.5 53.10 52.8 52.4051.54 51.56 94.8 96.80 78.9 79.5 15 72.14 74.35 37.9 37.90 37.2 37.0033.27 33.36 73.7 75.20 54.7 55.3 16 176.28 180.71 62.4 62.40 61.3 61.3057.51 57.7383 85.80 64.4 64.5 17 261.52 269.52 63.7 64.30 62.4 62.6054.88 54.54 79.8 82.00 61.9 62.2 18 87.99 88.90 38.6 38.40 37.8 37.8036.86 36.82 84.9 87.00 61.9 61.9 19 587.80 603.83 55.8 56.40 54.1 54.3052.37 52.48100 100 90.6 91.8 Mean 178.08 183.27 58.27 58.33 55.29 55.34 44.48 44.82 82.97 84.78 63.92 64.57 SD 147.71 152.38 18.13 18.17 16.32 16.32 13.00 12.968.85 8.96 12.24 12.29 P value 0.004 0.476 0.536 0.03 0.0001 0.006 Figure 5. Case by case comparison of the delivering MU and number of segment between 6 MV and 10 MV plans. 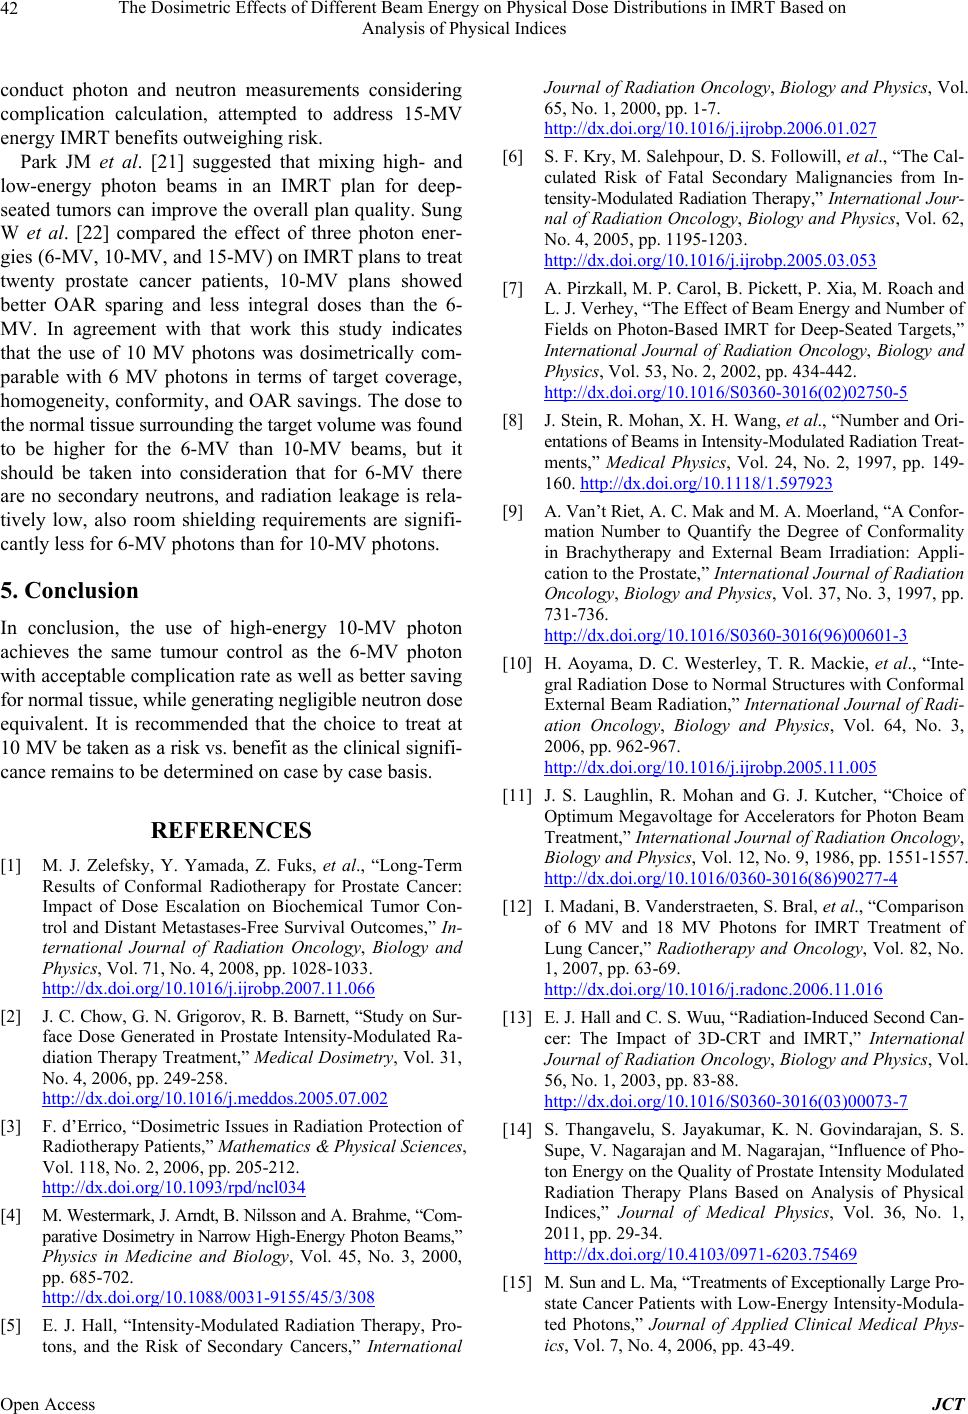 The Dosimetric Effects of Different Beam Energy on Physical Dose Distributions in IMRT Based on Analysis of Physical Indices 42 conduct photon and neutron measurements considering complication calculation, attempted to address 15-MV energy IMRT benefits outweighing risk. Park JM et al. [21] suggested that mixing high- and low-energy photon beams in an IMRT plan for deep- seated tumors can improve the overall plan quality. Sung W et al. [22] compared the effect of three photon ener- gies (6-MV, 10-MV, and 15-MV) on IMRT plans to treat twenty prostate cancer patients, 10-MV plans showed better OAR sparing and less integral doses than the 6- MV. In agreement with that work this study indicates that the use of 10 MV photons was dosimetrically com- parable with 6 MV photons in terms of target coverage, homogeneity, conformity, and OAR savings. The dose to the normal tissue surrounding the target volume was found to be higher for the 6-MV than 10-MV beams, but it should be taken into consideration that for 6-MV there are no secondary neutrons, and radiation leakage is rela- tively low, also room shielding requirements are signifi- cantly less for 6-MV photons than for 10-MV photons. 5. Conclusion In conclusion, the use of high-energy 10-MV photon achieves the same tumour control as the 6-MV photon with acceptable complication rate as well as better saving for normal tissue, while generating negligible neutron dose equivalent. It is recommended that the choice to treat at 10 MV be taken as a risk vs. benefit as the clinical signifi- cance remains to be determined on case by case basis. REFERENCES [1] M. J. Zelefsky, Y. Yamada, Z. Fuks, et al., “Long-Term Results of Conformal Radiotherapy for Prostate Cancer: Impact of Dose Escalation on Biochemical Tumor Con- trol and Distant Metastases-Free Survival Outcomes,” In- ternational Journal of Radiation Oncology, Biology and Physics, Vol. 71, No. 4, 2008, pp. 1028-1033. http://dx.doi.org/10.1016/j.ijrobp.2007.11.066 [2] J. C. Chow, G. N. Grigorov, R. B. Barnett, “Study on Sur- face Dose Generated in Prostate Intensity-Modulated Ra- diation Therapy Treatment,” Medical Dosimetry, Vol. 31, No. 4, 2006, pp. 249-258. http://dx.doi.org/10.1016/j.meddos.2005.07.002 [3] F. d’Errico, “Dosimetric Issues in Radiation Protection of Radiotherapy Patients,” Mathematics & Physical Sciences, Vol. 118, No. 2, 2006, pp. 205-212. http://dx.doi.org/10.1093/rpd/ncl034 [4] M. Westermark, J. Arndt, B. Nilsson and A. Brahme, “Com- parative Dosimetry in Narrow High-Energy Photon Beams,” Physics in Medicine and Biology, Vol. 45, No. 3, 2000, pp. 685-702. http://dx.doi.org/10.1088/0031-9155/45/3/308 [5] E. J. Hall, “Intensity-Modulated Radiation Therapy, Pro- tons, and the Risk of Secondary Cancers,” International Journal of Radiation Oncology, Biology and Physics, Vol. 65, No. 1, 2000, pp. 1-7. http://dx.doi.org/10.1016/j.ijrobp.2006.01.027 [6] S. F. Kry, M. Salehpour, D. S. Followill, et al., “The Cal- culated Risk of Fatal Secondary Malignancies from In- tensity-Modulated Radiation Therapy,” International Jour- nal of Radiation Oncology, Biology and Physics, Vol. 62, No. 4, 2005, pp. 1195-1203. http://dx.doi.org/10.1016/j.ijrobp.2005.03.053 [7] A. Pirzkall, M. P. Carol, B. Pickett, P. Xia, M. Roach and L. J. Verhey, “The Effect of Beam Energy and Number of Fields on Photon-Based IMRT for Deep-Seated Targets,” International Journal of Radiation Oncology, Biology and Physics, Vol. 53, No. 2, 2002, pp. 434-442. http://dx.doi.org/10.1016/S0360-3016(02)02750-5 [8] J. Stein, R. Mohan, X. H. Wang, et al., “Number and Ori- entations of Beams in Intensity-Modulated Radiation Treat- ments,” Medical Physics, Vol. 24, No. 2, 1997, pp. 149- 160. http://dx.doi.org/10.1118/1.597923 [9] A. Van’t Riet, A. C. Mak and M. A. Moerland, “A Confor- mation Number to Quantify the Degree of Conformality in Brachytherapy and External Beam Irradiation: Appli- cation to the Prostate,” International Journal of Radiation Oncology, Biology and Physics, Vol. 37, No. 3, 1997, pp. 731-736. http://dx.doi.org/10.1016/S0360-3016(96)00601-3 [10] H. Aoyama, D. C. Westerley, T. R. Mackie, et al., “Inte- gral Radiation Dose to Normal Structures with Conformal External Beam Radiation,” International Journal of Radi- ation Oncology, Biology and Physics, Vol. 64, No. 3, 2006, pp. 962-967. http://dx.doi.org/10.1016/j.ijrobp.2005.11.005 [11] J. S. Laughlin, R. Mohan and G. J. Kutcher, “Choice of Optimum Megavoltage for Accelerators for Photon Beam Treatment,” International Journal of Radiation Oncology, Biology and Physics, Vol. 12, No. 9, 1986, pp. 1551-1557. http://dx.doi.org/10.1016/0360-3016(86)90277-4 [12] I. Madani, B. Vanderstraeten, S. Bral, et al., “Comparison of 6 MV and 18 MV Photons for IMRT Treatment of Lung Cancer,” Radiotherapy and Oncology, Vol. 82, No. 1, 2007, pp. 63-69. http://dx.doi.org/10.1016/j.radonc.2006.11.016 [13] E. J. Hall and C. S. Wuu, “Radiation-Induced Second Can- cer: The Impact of 3D-CRT and IMRT,” International Journal of Radiation Oncology, Biology and Physics, Vol. 56, No. 1, 2003, pp. 83-88. http://dx.doi.org/10.1016/S0360-3016(03)00073-7 [14] S. Thangavelu, S. Jayakumar, K. N. Govindarajan, S. S. Supe, V. Nagarajan and M. Nagarajan, “Influence of Pho- ton Energy on the Quality of Prostate Intensity Modulated Radiation Therapy Plans Based on Analysis of Physical Indices,” Journal of Medical Physics, Vol. 36, No. 1, 2011, pp. 29-34. http://dx.doi.org/10.4103/0971-6203.75469 [15] M. Sun and L. Ma, “Treatments of Exceptionally Large Pro- state Cancer Patients with Low-Energy Intensity-Modula- ted Photons,” Journal of Applied Clinical Medical Phys- ics, Vol. 7, No. 4, 2006, pp. 43-49. Open Access JCT  The Dosimetric Effects of Different Beam Energy on Physical Dose Distributions in IMRT Based on Analysis of Physical Indices 43 [16] J. S. Welsh, T. R. Mackie and J. P. Limmer, “High-Ener- gy Photons in IMRT: Uncertainties and Risks for Ques- tionable Gain,” Technology in Cancer Research and Treat- ment, Vol. 6, No. 2, 2007, pp. 147-149. [17] S. F. D. Boer, Y. Kumek, W. Jaggernauth and M. B. Pod- gorsak, “The Effect of Beam Energy on the Quality of IMRT Plans for Prostate Conformal Radiotherapy,” Tech- nology in Cancer Research and Treatment, Vol. 6, No. 2, 2007, pp. 139-146. [18] L. Wang, E. Yorke, G. Desobrya and C. S. Chui, “Dosi- metric Advantage of Using 6 MV over 15 MV Photons in Conformal Therapy of Lung Cancer: Monte Carlo Studies in Patient Geometries,” Journal of Applied Clinical Me- dical Physics, Vol. 3, No. 1, pp. 51-59. http://dx.doi.org/10.1120/1.1432862 [19] G. Solaiappan, G. Singaravelu, A. Prakasarao, B. Rabbani and S. S. Supe, “Influence of Photon Beam Energy on IMRT Plan Quality for Radiotherapy of Prostate Cancer,” Reports of Practical Oncology and Radiotherapy, Vol. 14, No. 1, 2009, pp. 18-31. [20] M. Hussein, S. Aldridge, T. Guerrero Urbano and A. Ni- sbet, “The Effect of 6 and 15 MV on Intensity-Modulated Radiation Therapy Prostate Cancer Treatment: Plan Eva- luation, Tumour Control Probability and Normal Tissue Complication Probability Analysis, and the Theoretical Risk of Secondary Induced Malignancies,” British Jour- nal of Radiology, Vol. 85, 2012, pp. 423-432. http://dx.doi.org/10.1259/bjr/24514638 [21] J. M. Park, C. H. Choi, S. W. Ha and S. J. Ye, “The Dosi- metric Effect of Mixed-Energy IMRT Plans for Prostate Cancer,” Journal of Applied Clinical Medical Physics, Vol. 12, No. 4, 2011, p. 3563. [22] W. Sung, J. M. Park, C. H. Choi, S. W. Ha and S. J. Ye, “The Effect of Photon Energy on Intensity-Modulated Ra- diation Therapy (IMRT) Plans for Prostate Cancer,” Jour- nal of Radiation Oncology, Vol. 30, No. 1, 2012, pp. 27- 35. http://dx.doi.org/10.3857/roj.2012.30.1.27 Open Access JCT |