

Paper Menu >>
Journal Menu >>
 Open Journal of Social Sciences 2013. Vol.1, No.7, 1-5 Published Online December 2013 in SciRes (http://www.scirp.org/journal/jss) http://dx.doi.org/10.4236/jss.2013.17001 Open Access 1 An Econometric Analysis for the Behavior of the Bid-Ask Spread H. de la Fue nt e-Mella*, R. Campos-Espinoza, B. Silva-Palavecinos, D. Cademartori-Rosso Facultad de Ciencias Económicas y Administrativas, Pontificia Universidad Católica de Valparaíso, Escuela de Comercio, Valparaíso, Chile Email: *[email protected] Received July 2013 Information asymmetries are an important element in the functioning of capital markets. An indirect means of measuring information asymmetry is through the spread of stock prices. The purpose of this pa- per is to identify the explanatory variables and the determinants of the bid-ask spread and to quantify the influence that the actors involved in the brokering of publically offered securities may have over the spread. The methodology used to model the time series for each of the analyzed companies is based on a time series from each of the observed econometric multivariate processes. The analysis shows a signifi- cantly negative relationship between the spread and the market-maker size, calculated in terms of both the equity and the stock portfolio; likewise, activity is measured by observing the amount offered for pur- chase and/or sale. Keywords: Information Asymmetries; Econometric Modeling; Market Makers Introduction According to the economic theory associated with managing organizations, the separation of ownership and company lea- dership is common and does not automatically produce a cor- responding alignment of objectives between management and investors. This situation produces an agency dilemma, which according to the Theory of Firms (Jensen & Meckling, 1976), is strongly linked with asymmetries in corporate information. An indirect means of measuring the information asymmetry is the bid-ask spread of stock prices. A larger spread is asso- ciated with greater information asymmetry (Amihud & Men- delson, 1989; Coller & Yohn, 1997; Kim & Verrecchia, 1994; Bollen et al., 2004). The evidence suggests that the spread is smaller when there is more information available (Copeland & Galai, 1983; Glosten & Milgrom, 1985). Financial analysts draw greater spreads when they perceive that there is more information asymmetry (Kim & Verrecchia, 1994; Coller & Yhon, 1997). According to Venkatesh and Chiang (1986), ana- lysts tend to expand the spread when they think that the infor- mation advantage for informed traders has increased. The spread is of great interest to stockbrokers, agents, and regulators, as indicated by Huang and Stoll (1997). The pres- ence of traders with superior levels of information leads to a positive spread even when the trade is risk-neutral, and there is zero expected profit (Glosten & Milgrom, 1985). In other studies, the spread has been used to test for increased information asy- mmetry prior to the disclosure of such an event as the publica- tion of results or the delivery of dividends (Venkatesh & Chiang, 1986; Lesmond, 2005). Thus, in certain instances, the stock market is monopolistic (Benston & Hagerman, 1974) because it has few significant actors and high entry barriers for new competition. The evidence additionally suggests that un- systematic risk is linked to the spread (Amihud & Mendelson, 1989). Furthermore, even the type of intermediary matters, where the measurement of the spread is concerned. A vast amount of literature on the microstructure of the market addresses this theme from diverse points of view, such as the size of the in- termediary’s portfolio measured by personal assets, equity, and trading volume (Garman, 1976; Amihud & Mendelson, 1980; Ho & Stoll , 1980, 1981); thus, the size of the investment portfo- lio influences spread. In this sense, Hansch et al. (1998) indi- cate that the size of the stock list explains the volume of market transactions on the London Stock Exchange and the movement between the highest bid, the highest ask, and the spread has a high correlation with the changes in inventory. Furthermore, these researchers found that transactions among stockbrokers have a higher volume than do transactions that are open to the public. Moreover, Wahal (1997) showed that the changes in the spread of shares traded on the NASDAQ were larger (in magni- tude) than certain fixed market-makers. In another study on the components of the bid-ask, Lin et al. (1995) found that for larger traders, the cost of the transaction process was less when the size of the transaction was greater. Thus, under competitive conditions the bid-ask measure the cost of operations without delay (Demsetz, 1968). In this paper, the following hypotheses are made regarding the amount of influence that the size of the market-maker has over spread. Hypothesis 1: The size of the market-maker, measured in terms of equity, affects spread; thus, the greater the marker- maker’s equity, the smaller the spread. Hypothesis 2: The size of the market-maker, measured by their available stock port folio, affects the spread; thus, the greater the stock portfolio of the market-maker, the smaller the spread. Hypothesis 3: The level of the agent’s activity, measured by the amount offered for purchase and/or sale, affects the spread; thus, the greater the amount offered to buy and/or sell, t he small- *Corresponding author. 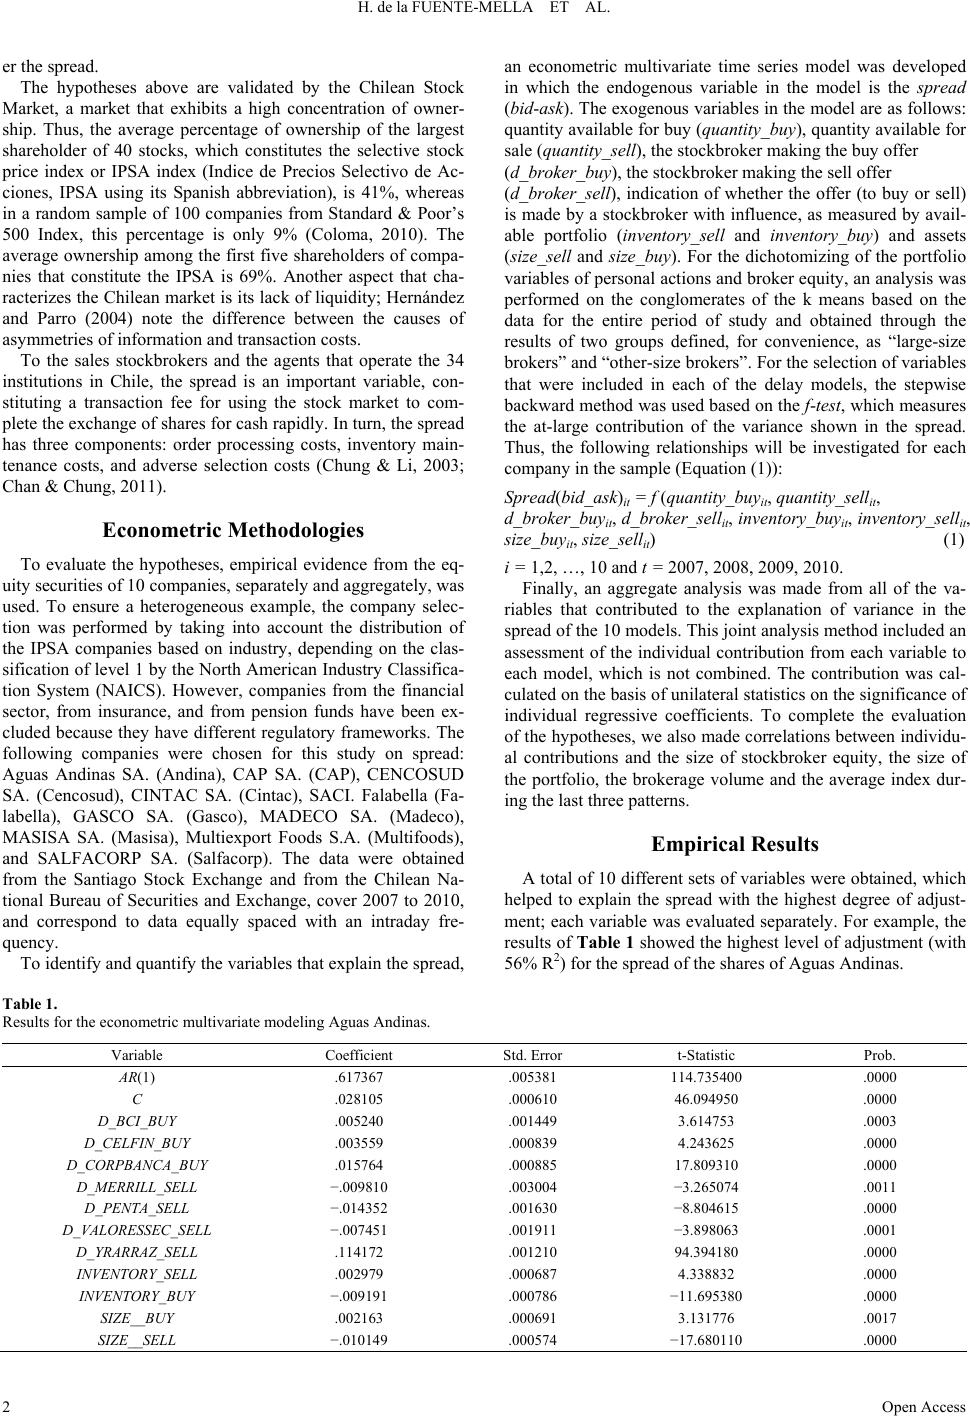 H. de la FUENTE-MELLA ET AL. Open Access 2 er the spread. The hypotheses above are validated by the Chilean Stock Market, a market that exhibits a high concentration of owner- ship. Thus, the average percentage of ownership of the largest shareholder of 40 stocks, which constitutes the selective stock price index or IPSA index (Indice de Precios Selectivo de Ac- ciones, IPSA using its Spanish abbreviation), is 41%, whereas in a random sample of 100 companies from Standard & Poor’s 500 Index, this percentage is only 9% (Coloma, 2010). The average ownership among the first five shareholders of compa- nies that constitute the IPSA is 69%. Another aspect that cha- racterizes the Chilean market is its lack of liquidity; Hernández and Parro (2004) note the difference between the causes of asymmet ries of information a nd transaction costs. To the sales stockbrokers and the agents that operate the 34 institutions in Chile, the spread is an important variable, con- stituting a transaction fee for using the stock market to com- plete the exchange of shares for cash rapidly. In turn, the spread has three components: order processing costs, inventory main- tenance costs, and adverse selection costs (Chung & Li, 2003; Chan & Chung, 2011). Econometric Methodologies To evaluate the hypotheses, empirical evidence from the eq- uity securities of 10 companies, separately and aggregately, was used. To ensure a heterogeneous example, the company selec- tion was performed by taking into account the distribution of the IPSA companies based on industry, depending on the clas- sification of level 1 by the North American Industry Classifica- tion System (NAICS). However, companies from the financial sector, from insurance, and from pension funds have been ex- cluded because they have different regulatory frameworks. The following companies were chosen for this study on spread: Aguas Andinas SA. (Andina), CAP SA. (CAP), CENCOSUD SA. (Cencosud), CINTAC SA. (Cintac), SACI. Falabella (Fa- labella), GASCO SA. (Gasco), MADECO SA. (Madeco), MASISA SA. (Masisa), Multiexport Foods S.A. (Multifoods), and SALFACORP SA. (Salfacorp). The data were obtained from the Santiago Stock Exchange and from the Chilean Na- tional Bureau of Securities and Exchange, cover 2007 to 2010, and correspond to data equally spaced with an intraday fre- quency. To identify and quantify the variables that explain the spread, an econometric multivariate time series model was developed in which the endogenous variable in the model is the spread (bid-ask). The exogenous variables in the model are as follows: quantity available for buy (quantity_buy), quantity available for sale (quantity_sell), the stockbroker making the buy offer (d_broker_buy), the stockbroker making the sell offer (d_broker_sell), indication of whether the offer (to buy or sell) is made by a stockbroker with influence, as measured by avail- able portfolio (inventory_sell and inventory_buy) and assets (size_sell and size_buy). For the dichotomizing of the portfolio variables of personal actions and broker equity, an analysis was performed on the conglomerates of the k means based on the data for the entire period of study and obtained through the results of two groups defined, for convenience, as “large-size brokers” and “other-size brokers”. For the selection of variables that were included in each of the delay models, the stepwise backward method was used based on the f-test, which measures the at-large contribution of the variance shown in the spread. Thus, the following relationships will be investigated for each company in the sample (Equation ( 1)): Spread(bid_ask)it = f (quantity_buyit, quantity_sellit, d_broker_buyit, d_broker_sellit, inventory_buyit, inventory_sellit, size_buyit, size_sellit) (1) i = 1,2, …, 10 and t = 2007, 2008, 2009, 2010. Finally, an aggregate analysis was made from all of the va- riables that contributed to the explanation of variance in the spread of the 10 models. This joint analysis method included an assessment of the individual contribution from each variable to each model, which is not combined. The contribution was cal- culated on the basis of unilateral statistics on the significance of individual regressive coefficients. To complete the evaluation of the hypotheses, we also made correlations between individu- al contributions and the size of stockbroker equity, the size of the portfolio, the brokerage volume and the average index dur- ing the last three patterns. Empirical Results A total of 10 different sets of variables were obtained, which helped to explain the spread with the highest degree of adjust- ment; each variable was evaluated separately. For example, the results of Table 1 showed the highest level of adjustment (with 56% R2) for the spread of the shares of Aguas Andinas. Table 1. Results for the econometric multivariate modeling Aguas Andinas. Variable Coefficien t Std. Error t-Statistic Prob. AR(1) .617367 .005381 114.735400 .0000 C .028105 .000610 46.094950 .0000 D_BCI_BUY .005240 .001449 3.614753 .0003 D_CELFIN_BUY .003559 .000839 4.243625 .0000 D_CORPBANCA_BUY .015764 .000885 17.809310 .0000 D_MERRILL_SELL −.009810 .003004 −3.265074 .0011 D_PENTA_SELL −.014352 .001630 −8.804615 .0000 D_VALORESSEC_SELL −.007451 .001911 −3.898063 .0001 D_YRARRAZ_SELL .114172 .001210 94.394180 .0000 INVENTORY_S ELL .002979 .000687 4.338832 .0000 INVENTORY_BUY −.009191 .000786 −11.695380 .0000 SIZE__BUY .002163 .000691 3.131776 .0017 SIZE__SELL −.010149 .000574 −17.680110 .0000 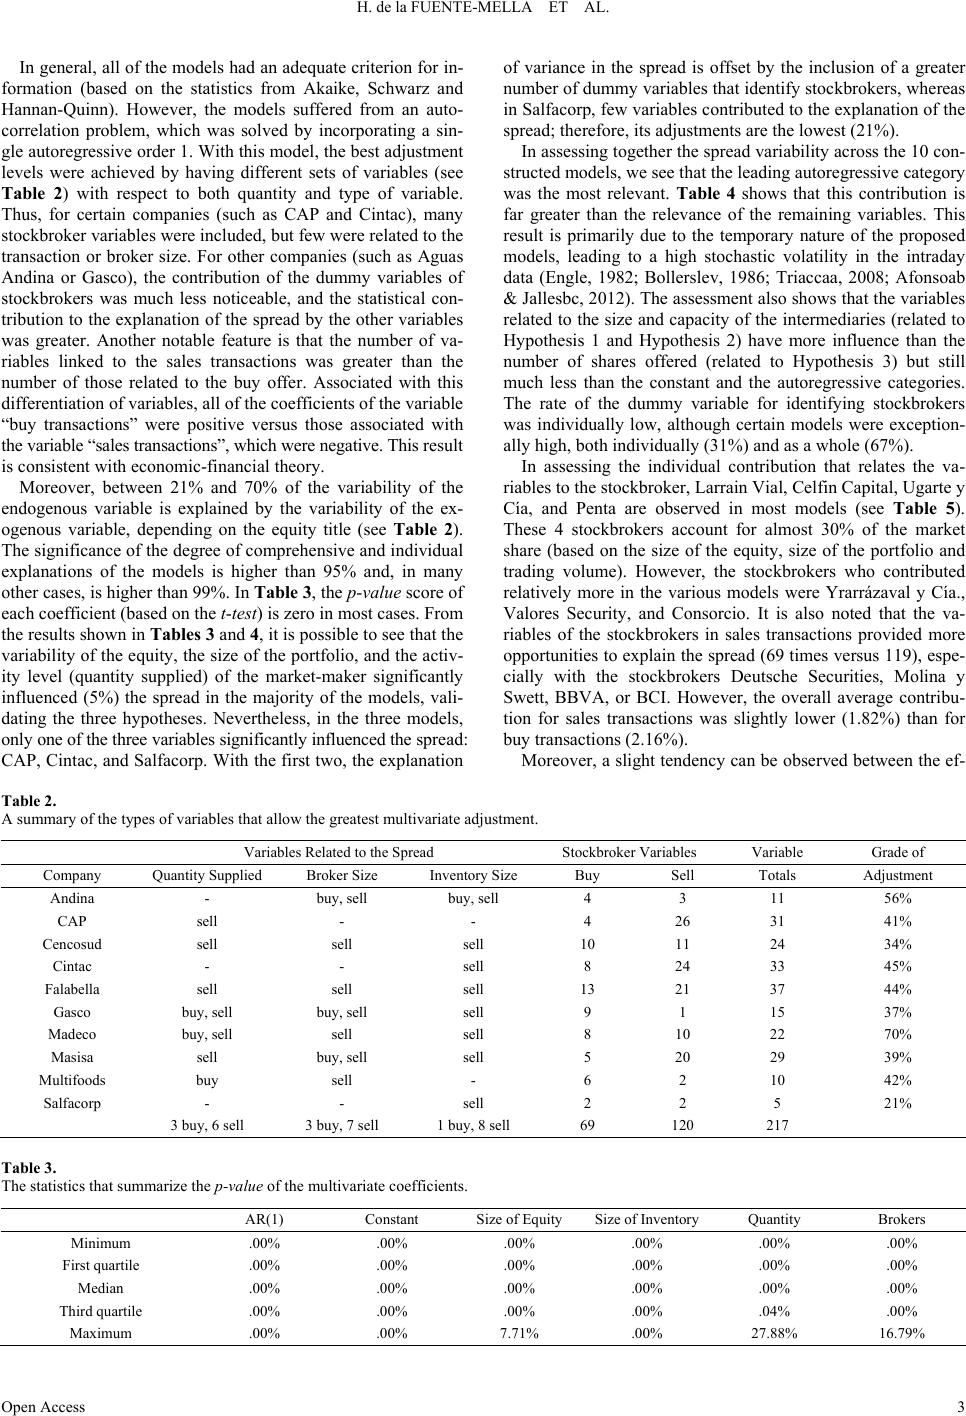 H. de la FUENTE-MELLA ET AL. Open Access 3 In general, all of the models had an adequate criterion for in- formation (based on the statistics from Akaike, Schwarz and Hannan-Quinn). However, the models suffered from an auto- correlation problem, which was solved by incorporating a sin- gle autoregressive order 1. With this model, the best adjustment levels were achieved by having different sets of variables (see Table 2) with respect to both quantity and type of variable. Thus, for certain companies (such as CAP and Cintac), many stockbroker variables were included, but few were related to the transaction or broker size. For other companies (such as Aguas Andina or Gasco), the contribution of the dummy variables of stockbrokers was much less noticeable, and the statistical con- tribution to the explanation of the spread by the other variables was greater. Another notable feature is that the number of va- riables linked to the sales transactions was greater than the number of those related to the buy offer. Associated with this differentiation of variables, all of the coefficients of the variable “buy transactions” were positive versus those associated with the variable “sales t ransact ions”, whi ch were n egative. This result is consistent with economic-financial theory. Moreover, between 21% and 70% of the variability of the endogenous variable is explained by the variability of the ex- ogenous variable, depending on the equity title (see Table 2). The significance of the degree of comprehensive and individual explanations of the models is higher than 95% and, in many other cases, is higher than 99%. In Table 3, the p-value score of each coefficient (based on the t-test) is zero in most cases. From the results shown in Tables 3 and 4, it is possible to see that the variability of the equity, the size of the portfolio, and the activ- ity level (quantity supplied) of the market-maker significantly influenced (5%) the spread in the majority of the models, vali- dating the three hypotheses. Nevertheless, in the three models, only one of the t hre e va ri abl es significantly influenced the spread: CAP, Cintac, and Salfacorp. With the first two, the explanation of variance in the spread is offset by the inclusion of a greater number of dummy variables that identify stockbrokers, whereas in Salfacorp, few variables contributed to the explanation of the spread; therefore, its adjustments are the lowest (21%). In assessing together the spread variability across the 10 con- structed models, we see that the leading autoregressive category was the most relevant. Table 4 shows that this contribution is far greater than the relevance of the remaining variables. This result is primarily due to the temporary nature of the proposed models, leading to a high stochastic volatility in the intraday data (Engle, 1982; Bollerslev, 1986; Triaccaa, 2008; Afonsoab & Jallesbc, 2012). The assessment also shows that the variables related to the size and capacity of the intermediaries (related to Hypothesis 1 and Hypothesis 2) have more influence than the number of shares offered (related to Hypothesis 3) but still much less than the constant and the autoregressive categories. The rate of the dummy variable for identifying stockbrokers was individually low, although certain models were exception- ally high, both individually (31%) and as a whole (67%). In assessing the individual contribution that relates the va- riables to the stockbroker, Larrain Vial, Celfin Capital, Ugarte y Cía, and Penta are observed in most models (see Table 5). These 4 stockbrokers account for almost 30% of the market share (based on the size of the equity, size of the portfolio and trading volume). However, the stockbrokers who contributed relatively more in the various models were Yrarrázaval y Cía., Valores Security, and Consorcio. It is also noted that the va- riables of the stockbrokers in sales transactions provided more opportunities to explain the spread (69 times versus 119), espe- cially with the stockbrokers Deutsche Securities, Molina y Swett, BBVA, or BCI. However, the overall average contribu- tion for sales transactions was slightly lower (1.82%) than for buy transactions (2.16%). Moreover, a slight tendency can be observed between the ef- Table 2. A summary of the types of variables that allow the greatest multivariate adjustment. Variables Related to the Spread Stockbroker Variables Variab le Grade of Company Quantity Supplied Broker Size Inventory Size Buy Sell Totals Adjustment Andina - buy, sell buy, sell 4 3 11 56% CAP sell - - 4 26 31 41% Cencosud sell sell sell 10 11 24 34% Cintac - - sell 8 24 33 45% Falabell a sell sell sell 13 21 37 44% Gasco buy, sell buy, sell sell 9 1 15 37% Madeco buy, sell sell sell 8 10 22 70% Masisa sell buy, sell sell 5 20 29 39% Multifoods buy sell - 6 2 10 42% Salfacorp - - sell 2 2 5 21% 3 buy, 6 sell 3 buy, 7 sell 1 buy, 8 sell 69 120 217 Table 3. The statistics that summarize the p-value of the multivariate coefficients. AR(1) Constant Size of Equity Size of Inventory Quantity Brokers Minimum .00% .00% .00% .00% .00% .00% First quartile .00% .00% .00% .00% .00% .00% Median .00% .00% .00% .00% .00% .00% Third quartile .00% .00% .00% .00% .04% .00% Maxi mu m .00% .00% 7.71% .00% 27.88% 16.79% 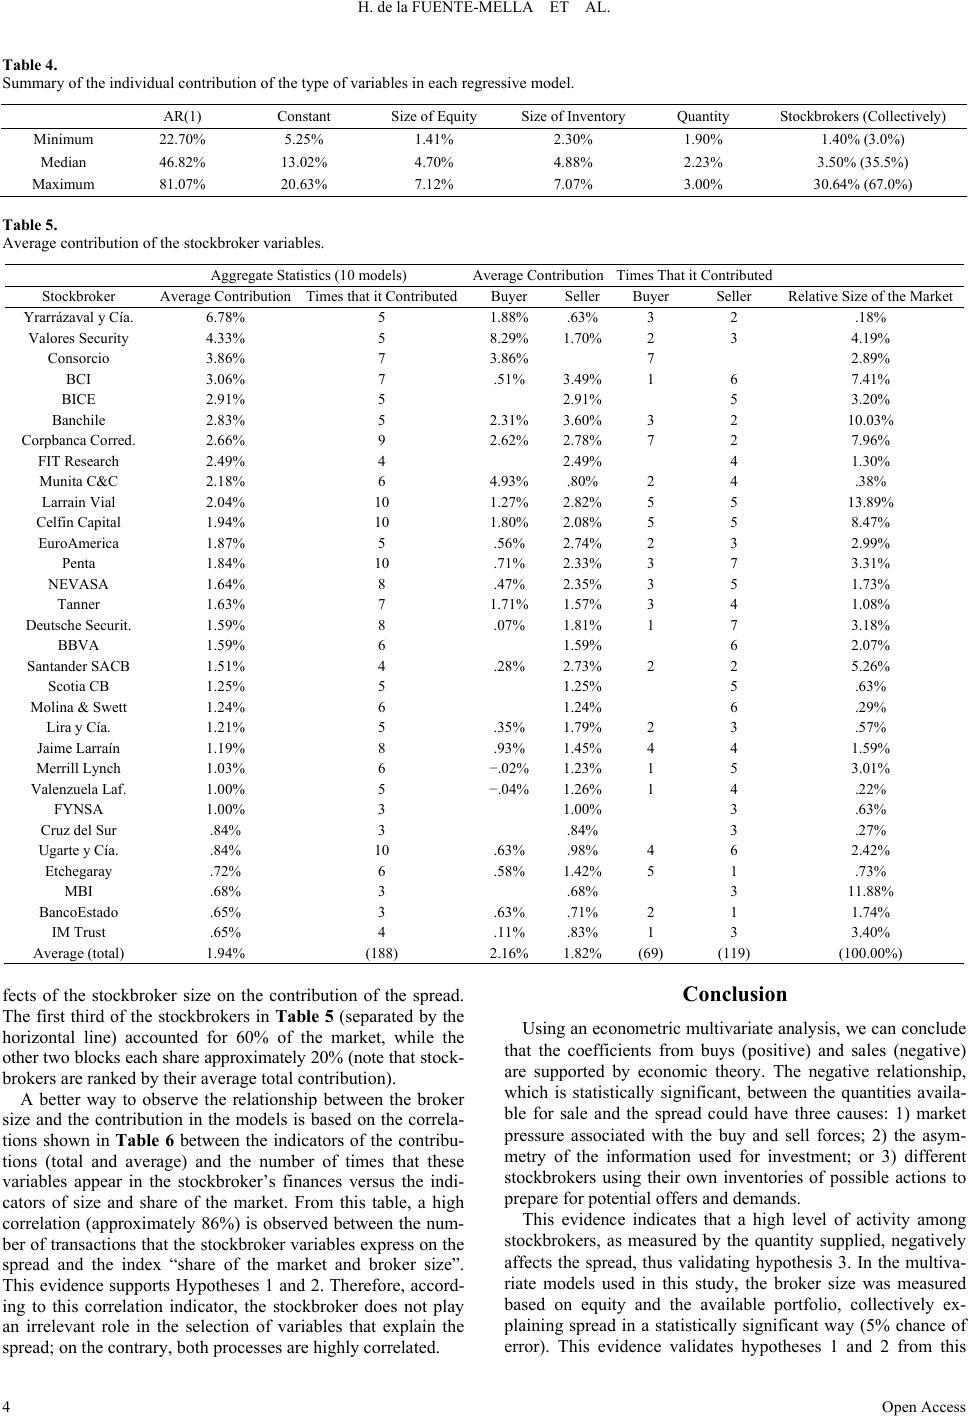 H. de la FUENTE-MELLA ET AL. Open Access 4 Table 4. Summary of the individual contribution of the type of variables in each regressive model. AR(1) Constant Size of Equity Size of Inventory Quantity Stockbroke rs (C ollectively ) Minimum 22.70% 5.25% 1.41% 2.30% 1.90% 1.40% (3.0%) Median 46.82% 13.02% 4.70% 4.88% 2.23% 3.50% (35.5%) Maxi mu m 81.07% 20.63% 7.12% 7.07% 3.00% 30.64% (67.0%) Table 5. Average contribution of the stockbroker variables. Aggregate St atistics (10 models) Average Contribution Times That it Contributed Stockbroker Average Contribution Times that it C ontri bute d Buyer Sell er Buyer Seller Relative Size of the Market Yrarrázaval y Cía. 6.78% 5 1.88% .63% 3 2 .18% Valores Security 4.33% 5 8.29% 1.70% 2 3 4.19% Consorcio 3.86% 7 3.86% 7 2.89% BCI 3.06% 7 .51% 3.49% 1 6 7.41% BICE 2.91% 5 2.91% 5 3.20% Banchile 2.83% 5 2.31% 3.60% 3 2 10.03% Corpbanca Corred. 2.66% 9 2.62% 2.78% 7 2 7.96% FIT Research 2.49% 4 2.49% 4 1.30% Munita C&C 2.18% 6 4.93% .80% 2 4 .38% Larrain Vial 2.04% 10 1.27% 2.82% 5 5 13.89% Celfin Capital 1.94% 10 1.80% 2.08% 5 5 8.47% EuroAmerica 1.87% 5 .56% 2.74% 2 3 2.99% Penta 1.84% 10 .71% 2.33% 3 7 3.31% NEVASA 1.64% 8 .47% 2.35% 3 5 1.73% Tanner 1.63% 7 1.71% 1.57% 3 4 1.08% Deutsche Securit. 1.59% 8 .07% 1.81% 1 7 3.18% BBVA 1.59% 6 1.59% 6 2.07% Santander SACB 1.51% 4 .28% 2.73% 2 2 5.26% Scotia CB 1.25% 5 1.25% 5 .63% Molina & Swett 1.24% 6 1.24% 6 .29% Lira y Cía. 1.21% 5 .35% 1.79% 2 3 .57% Jaime Larraín 1.19% 8 .93% 1.45% 4 4 1.59% Merrill Lynch 1.03% 6 −.02% 1.23% 1 5 3.01% Valenzuela Laf . 1.00% 5 −.04% 1.26% 1 4 .22% FYNSA 1.00% 3 1.00% 3 .63% Cruz del Sur .84% 3 .84% 3 .27% Ugarte y Cía. .84% 10 .63% .98% 4 6 2.42% Etchegaray .72% 6 .58% 1.42% 5 1 .73% MBI .68% 3 .68% 3 11.88% BancoEstado .65% 3 .63% .71% 2 1 1.74% IM Trust .65% 4 .11% .83% 1 3 3.40% Average (total) 1.94% (188) 2.16% 1.82% (69) (119) (100.00%) fects of the stockbroker size on the contribution of the spread. The first third of the stockbrokers in Table 5 (separated by the horizontal line) accounted for 60% of the market, while the other two blocks each share app roximately 20% (note that stock- brokers are ranked by their average total contribution). A better way to observe the relationship between the broker size and the contribution in the models is based on the correla- tions shown in Table 6 between the indicators of the contribu- tions (total and average) and the number of times that these variables appear in the stockbroker’s finances versus the indi- cators of size and share of the market. From this table, a high correlation (approximately 86%) is observed between the num- ber of transactions that the stockbroker variables express on the spread and the index “share of the market and broker size”. This evidence supports Hypotheses 1 and 2. Therefore, accord- ing to this correlation indicator, the stockbroker does not play an irrelevant role in the selection of variables that explain the spread; on the contrary, both processes are highly correlated. Conclusion Using an econometric multivariate analysis, we can conclude that the coefficients from buys (positive) and sales (negative) are supported by economic theory. The negative relationship, which is statistically significant, between the quantities availa- ble for sale and the spread could have three causes: 1) market pressure associated with the buy and sell forces; 2) the asym- metry of the information used for investment; or 3) different stockbrokers using their own inventories of possible actions to prepare for potential offers and demands. This evidence indicates that a high level of activity among stockbrokers, as measured by the quantity supplied, negatively affects the spread, thus validating hypothesis 3. In the multiva- riate models used in this study, the broker size was measured based on equity and the available portfolio, collectively ex- plaining spread in a statistically significant way (5% chance of error). This evidence validates hypotheses 1 and 2 from this 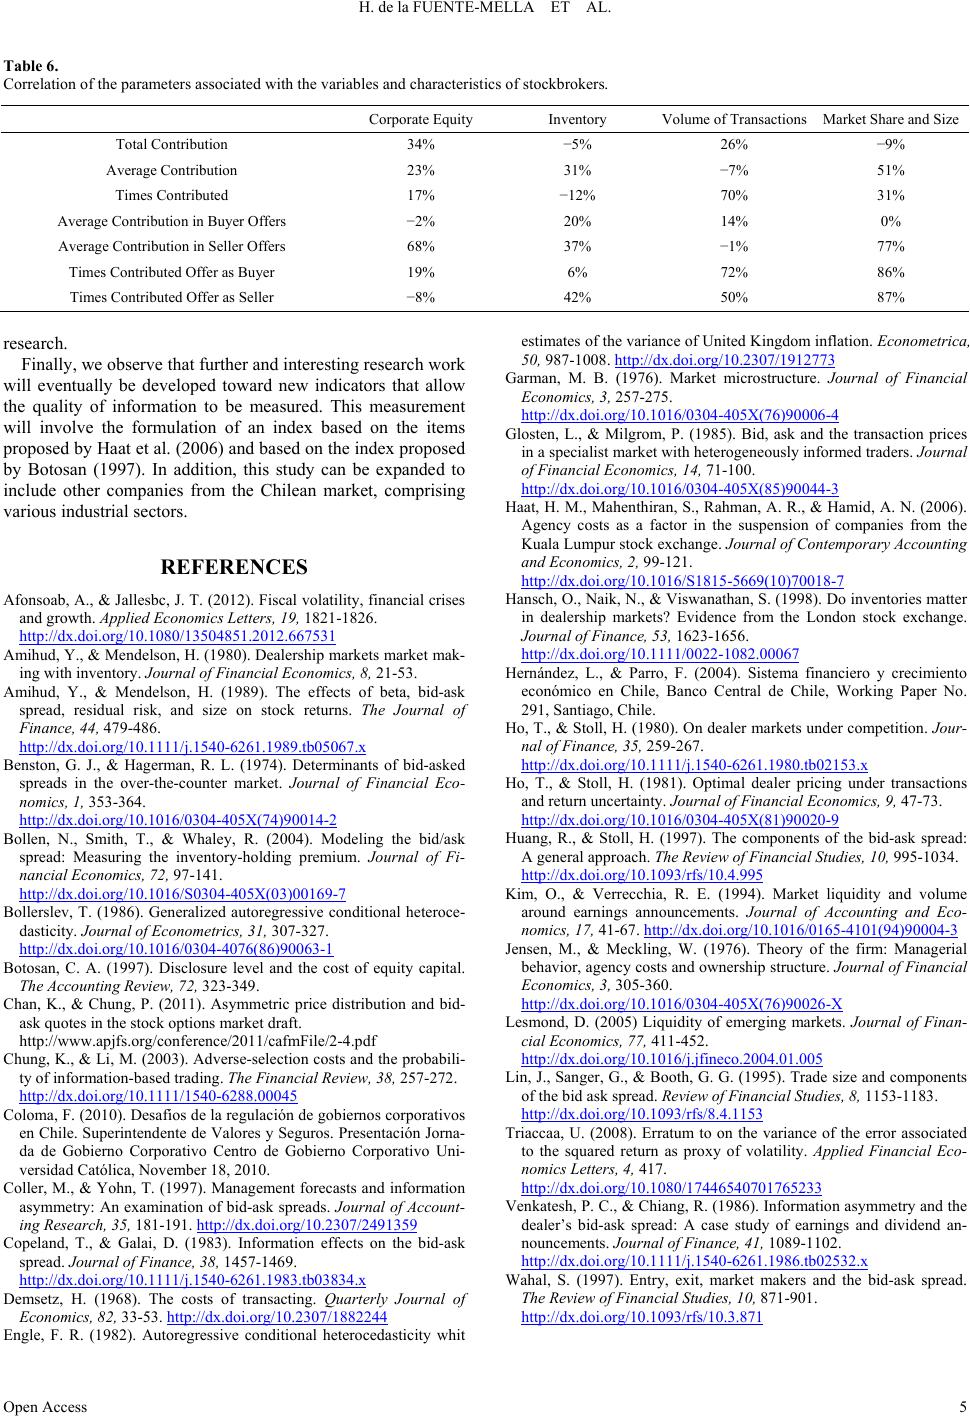 H. de la FUENTE-MELLA ET AL. Open Access 5 Table 6. Correlation of the parameters associated with the variables and characteristics of stockbrokers. Corporate Equity Inventor y Volume of Transactions Market Share and Size Total Contribution 34% −5% 26% −9% Average Contributi on 23% 31% −7% 51% Times Contributed 17% −12% 70% 31% Average Contributi on in Buyer O f fers −2% 20% 14% 0% Average Contributi on in Seller Off ers 68% 37% −1% 77% Times Contributed Offer as Buyer 19% 6% 72% 86% Times Contributed Offer as Seller −8% 42% 50% 87% research. Finally, we observe that further and interesting research work will eventually be developed toward new indicators that allow the quality of information to be measured. This measurement will involve the formulation of an index based on the items proposed by Haat et al. (2006) and based on the index proposed by Botosan (1997). In addition, this study can be expanded to include other companies from the Chilean market, comprising various industrial sectors. REFERENCES Afonsoab, A., & Jallesbc, J. T. (2012). Fiscal volatility, finan cial crises and growth. Applied Economics Letters, 19, 1821-1826. http://dx.doi.org/10.1080/13504851.2012.667531 Amihud, Y., & Mendelson, H. (1980). Dealership markets market mak- ing with inventory. Journal of Financial Economics, 8, 21-53. Amihud, Y., & Mendelson, H. (1989). The effects of beta, bid-ask spread, residual risk, and size on stock returns. The Journal of Finance, 44, 479-486. http://dx.doi.org/10.1111/j.1540-6261.1989.tb05067.x Benston, G. J., & Hagerman, R. L. (1974). Determinants of bid-asked spreads in the over-the-counter market. Journal of Financial Eco- nomics, 1, 353-364. http://dx.doi.org/10.1016/0304-405X(74)90014-2 Bollen, N., Smith, T., & Whaley, R. (2004). Modeling the bid/ask spread: Measuring the inventory-holding premium. Journal of Fi- nancial Economics, 72, 97-141. http://dx.doi.org/10.1016/S0304-405X(03)00169-7 Bollerslev, T. (1986). Generalized autoregressive conditional heteroce- dasticity. Journal of Econometrics, 31, 307-327. http://dx.doi.org/10.1016/0304-4076(86)90063-1 Botosan, C. A. (1997). Disclosure level and the cost of equity capital. The Accounting Review, 72, 323-349. Chan, K., & Chung, P. (2011). Asymmetric price distribution and bid- ask quotes in the stock options market draft. http://www.apjfs.org/conference/2011/cafmFile/2-4.pdf Chung, K., & Li, M. (2003). Adv erse-selection costs and th e probabili- ty of information-based trading. The Financial Review, 38, 257-272. http://dx.doi.org/10.1111/1540-6288.00045 Coloma, F. (2010). Desafíos de la regulación de gobiernos corporativos en Chile. Superintend ente de Valores y Seguros. P resentación Jorna- da de Gobierno Corporativo Centro de Gobierno Corporativo Uni- versidad Católica, Novem ber 18, 2010. Coller, M., & Yohn, T. (1997). Management forecasts and information asymmetry: An examination of bid-ask spreads. Journal of Account- ing Research, 35, 181-191. http://dx.doi.org/10.2307/2491359 Copeland, T., & Galai, D. (1983). Information effects on the bid-ask spread. Journal of Finance, 38, 1457-1469. http://dx.doi.org/10.1111/j.1540-6261.1983.tb03834.x Demsetz, H. (1968). The costs of transacting. Quarterly Journal of Economics, 82, 33-53. http://dx.doi.org/10.2307/1882244 Engle, F. R. (1982). Autoregressive conditional heterocedasticity whit estimates of the variance of United Kingdom inflation. Econometrica, 50, 987-1008. http://dx.doi.org/10.2307/1912773 Garman, M. B. (1976). Market microstructure. Journal of Financial Economics, 3, 257-275. http://dx.doi.org/10.1016/0304-405X(76)90006-4 Glosten, L., & Milgrom, P. (1985). Bid, ask and the transaction prices in a specialist mark et with h eterog eneously informed traders. Journal of Financial Economics, 14, 71-100. http://dx.doi.org/10.1016/0304-405X(85)90044-3 Haat, H. M., Mahenthiran, S., Rah man, A. R., & Hamid, A. N. (200 6). Agency costs as a factor in the suspension of companies from the Kuala Lumpur stock exchange. Journal of Contemporary Accounting and Economics, 2, 99-121. http://dx.doi.org/10.1016/S1815-5669(10)70018-7 Hansch, O., Naik, N., & Viswanathan , S. (1998). Do inven tories matter in dealership markets? Evidence from the London stock exchange. Journal of Finance, 53, 1623-1656. http://dx.doi.org/10.1111/0022-1082.00067 Hernández, L., & Parro, F. (2004). Sistema financiero y crecimiento económico en Chile, Banco Central de Chile, Working Paper No. 291, Santiago, Chile. Ho, T., & Stoll, H. (1980). On dealer markets under competition . Jour- nal of Finance, 35, 259-267. http://dx.doi.org/10.1111/j.1540-6261.1980.tb02153.x Ho, T., & Stoll, H. (1981). Optimal dealer pricing under transactions and return uncertainty. Journal of Financial Economics, 9, 47-73. http://dx.doi.org/10.1016/0304-405X(81)90020-9 Huang, R., & Stoll, H. (1997). The components of the bid-ask spread: A general approach. The Review of Financial Studies, 10, 995-1034. http://dx.doi.org/10.1093/rfs/10.4.995 Kim, O., & Verrecchia, R. E. (1994). Market liquidity and volume around earnings announcements. Journal of Accounting and Eco- nomics, 17, 41-67. http://dx.doi.org/10.1016/0165-4101(94)90004-3 Jensen, M., & Meckling, W. (1976). Theory of the firm: Managerial behavior, agency costs and ownership structure. Journal of Financial Economics, 3, 305-360. http://dx.doi.org/10.1016/0304-405X(76)90026-X Lesmond, D. (2005) Liquidity of emerging markets. Journal of Finan- cial Economics, 77, 411-452. http://dx.doi.org/10.1016/j.jfineco.2004.01.005 Lin, J., Sanger , G., & Booth, G. G. (1995). Trade size and components of the bid ask sprea d. Review of Financial Studies, 8, 1153-1183. http://dx.doi.org/10.1093/rfs/8.4.1153 Triaccaa, U. (2008). Erratum to on the variance of the error associated to the squared return as proxy of volatility. Applied Financial Eco- nomics Letters, 4, 417. http://dx.doi.org/10.1080/17446540701765233 Venkatesh, P. C., & Chiang, R. (1986). Information asymmetry and the dealer’s bid-ask spread: A case study of earnings and dividend an- nouncements. Journal of Finance, 41, 1089-1102. http://dx.doi.org/10.1111/j.1540-6261.1986.tb02532.x Wahal, S. (1997). Entry, exit, market makers and the bid-ask spread. The Review of Financial Studies, 10, 871-901. http://dx.doi.org/10.1093/rfs/10.3.871 |