

Paper Menu >>
Journal Menu >>
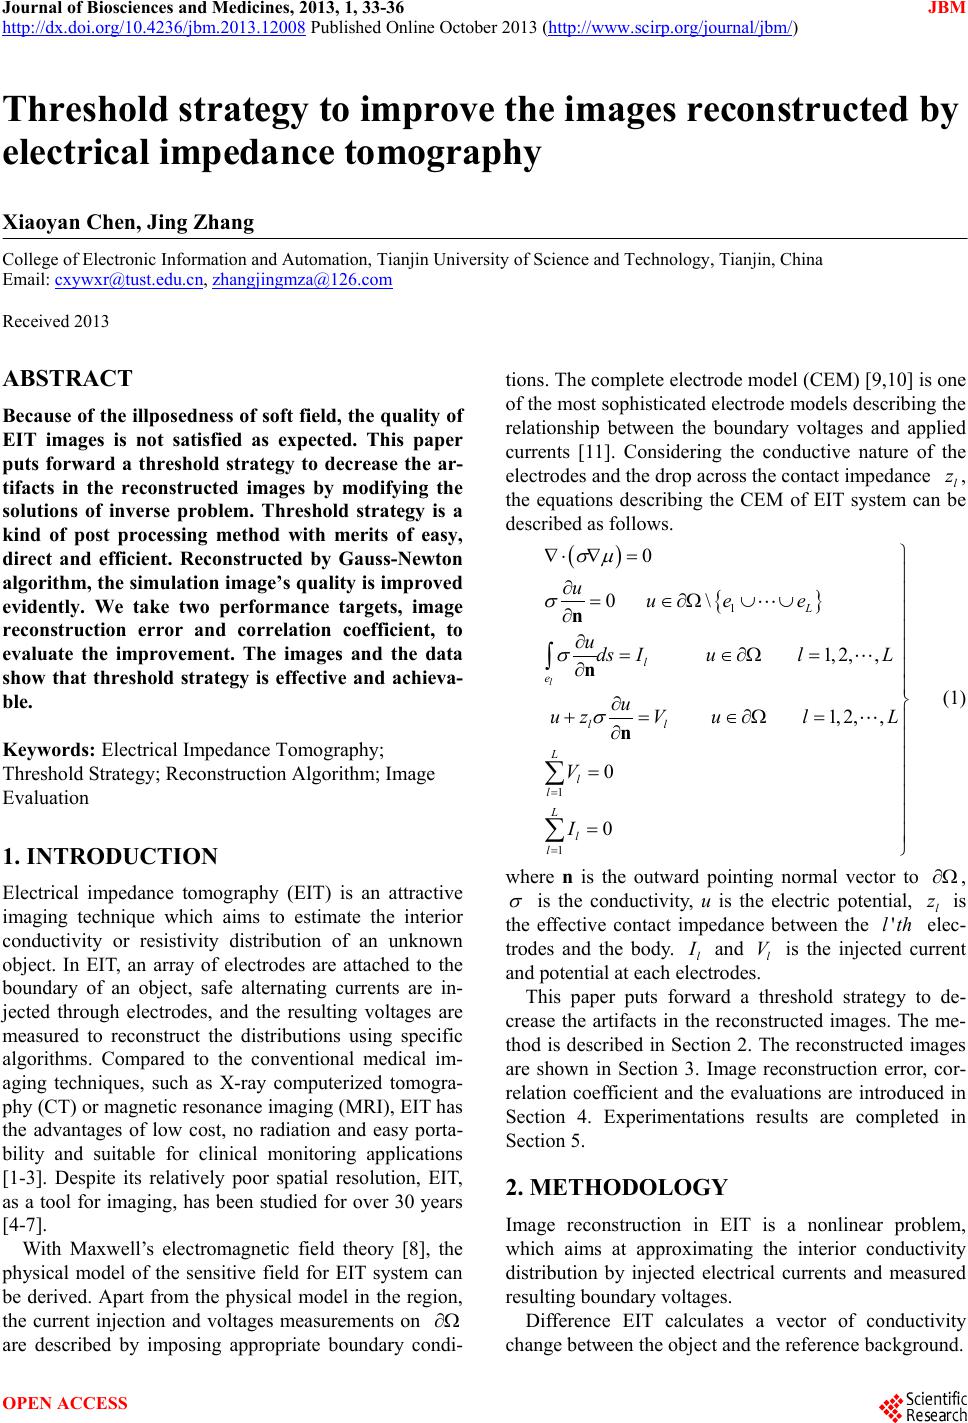 Journal of Biosciences and Medicines, 2013, 1, 33-36 JBM http://dx.doi.org/10.4236/jbm.2013.12008 Published Online October 2013 (http://www.scirp.org/journal/jbm/) OPEN ACCESS Threshold strategy to improve the images reconstructed by electrical impedance tomography Xiaoyan Chen, Jing Zhang College of Electronic Information and Automation, Tianjin University of Science and Technology, Tianjin, China Email: [email protected], [email protected] Received 2013 ABSTRACT Because of the illposedness of soft field, the q uality of EIT images is not satisfied as expected. This paper puts forward a threshold strategy to decrease the ar- tifacts in the reconstructed images by modifying the solutions of inverse problem. Threshold strategy is a kind of post processing method with merits of easy, direct and efficient. Reconstructed by Gauss-Newton algorithm, the simulation image’s quality is improv ed evidently. We take two performance targets, image reconstruction error and correlation coefficient, to evaluate the improvement. The images and the data show that threshold strategy is effective and achieva- ble. Keywords: Electrical Impedance Tomography; Threshold Strategy; Recons truction A lgor ithm; Image Evaluation 1. INTRODUCTION Electrical impedance tomography (EIT) is an attractive imaging technique which aims to estimate the interior conductivity or resistivity distribution of an unknown object. In EIT, an array of electrodes are attached to the boundary of an object, safe alternating currents are in- jected through electrodes, and the resulting voltages are measured to reconstruct the distributions using specific algorithms. Compared to the conventional medical im- aging techniques, such as X-ray computerized tomogra- phy (CT) or magnetic resonance imaging (MRI), EIT has the advantages of low cost, no radiation and easy porta- bility and suitable for clinical monitoring applications [1-3]. Despite its relatively poor spatial resolution, EIT, as a tool for imaging, has been studied for over 30 years [4-7]. With Maxwell’s electromagnetic field theory [8], the physical model of the sensitive field for EIT system can be derived. Apart from the physical model in the region, the current injection and voltages measurements on ∂Ω are described by imposing appropriate boundary condi- tions. The complete electrode model (CEM) [9,10] i s on e of the most sophisticated electrode models describing the relationship between the boundary voltages and applied currents [11]. Considering the conductive nature of the electrodes and the drop across the contact impedance l z , the equations describing the CEM of EIT system can be described as follows. ( ) { } 1 1 1 0 0 \ 1,2,, 1,2,, 0 0 l L l e ll L l l L l l uuee uds IulL u uzV ulL V I σµ σ σ σ = = ∇⋅ ∇= ∂ =∈ ∂Ω∪∪ ∂ ∂ =∈ ∂Ω= ∂ ∂ +=∈ ∂Ω= ∂ = = ∫ ∑ ∑ n n n (1) where n is the outward pointing normal vector to ∂Ω , σ is the conductivity, u is the electric potential, l z is the effective contact impedance between the 'l th elec- trodes and the body. l I and l V is the injected current and potential at each electrodes. This paper puts forward a threshold strategy to de- crease the artifacts in the reconstructed images. The me- thod is described in Section 2. The reconstructed images are shown in Section 3. Image reconstruction error, cor- relation coefficient and the evaluations are introduced in Section 4. Experimentations results are completed in Section 5. 2. METHODOLOGY Image reconstruction in EIT is a nonlinear problem, which aims at approximating the interior conductivity distribution by injected electrical currents and measured resulting boundary voltages. Difference EIT calculates a vector of conductivity change between the object and the reference background. 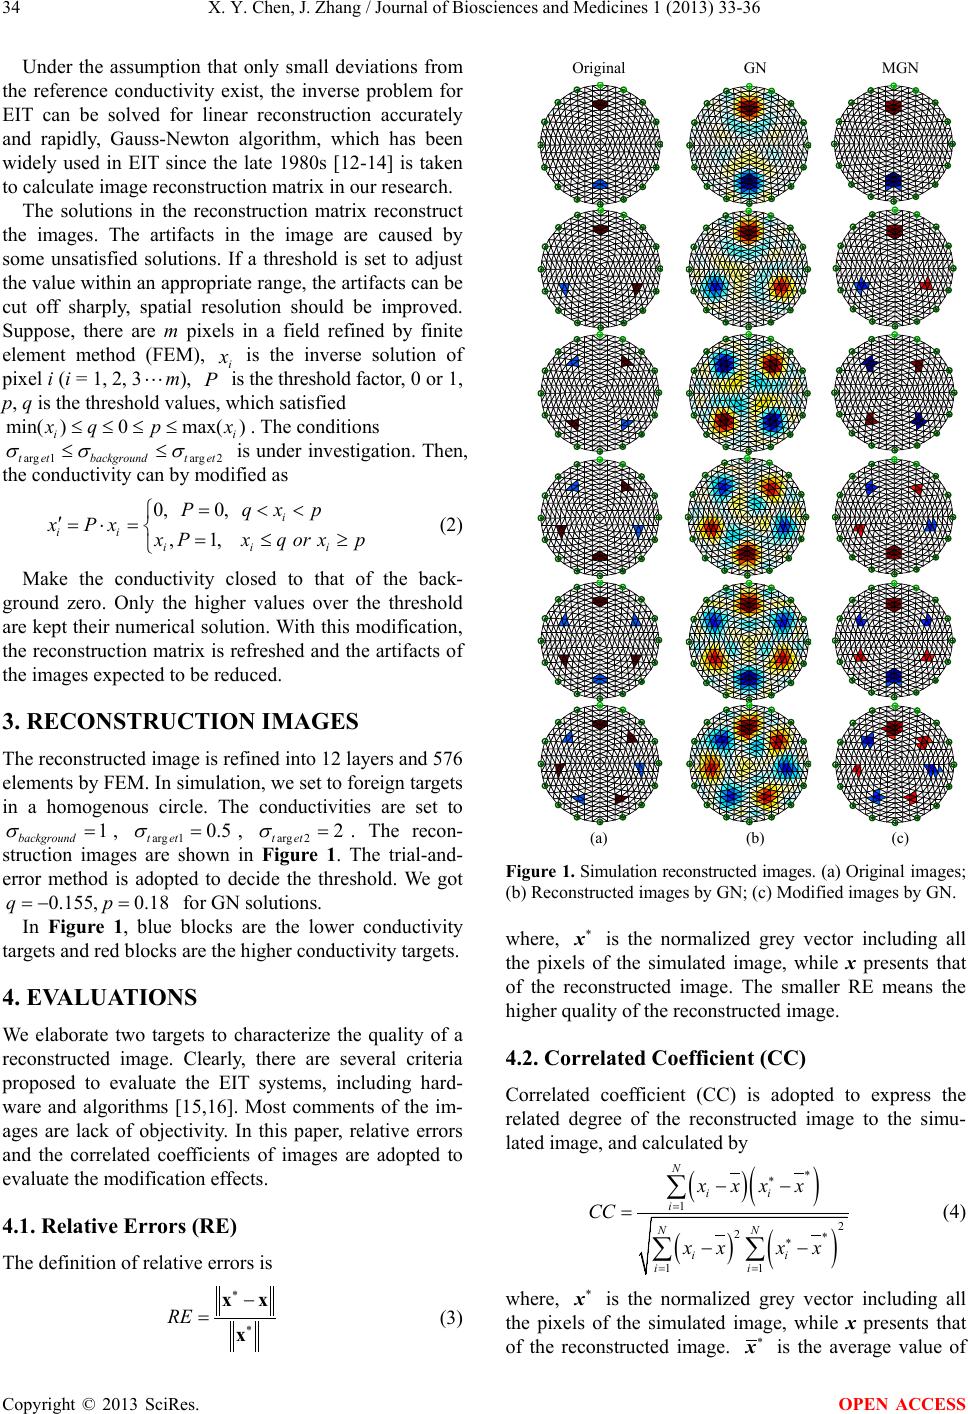 X. Y. Chen, J. Zhang / Journal of Biosciences and Medicines 1 (2013) 33-36 Copyright © 2013 SciRes. OPEN ACCESS 34 Under the assumption that only small deviations from the reference conductivity exist, the inverse problem for EIT can be solved for linear reconstruction accurately and rapidly, Gauss-Newton algorithm, which has been widely used in EIT since the late 1980s [12-14] is taken to calculate image reconstruction matrix in our research. The solutions in the reconstruction matrix reconstruct the images. The artifacts in the image are caused by some unsatisfied solutions. If a threshold is set to adjust the value within an appropriate range, the artifacts can be cut off sharply, spatial resolution should be improved. Suppose, there are m pixels in a field refined by finite element method (FEM), i x is the inverse solution of pixel i (i = 1, 2, 3 m), P is the threshold factor, 0 or 1, p, q is the threshold va l ue s, which s a t isfied min( )0max( ) ii xq px≤≤≤ ≤ . The conditions arg 1arg2t etbackgroundt et σσ σ ≤≤ is under investigation. Then, the conductivity can by modified as 0, 0, ,1, i ii i ii Pqx p x PxxPxq or xp = << ′=⋅= =≤≥ (2 ) Make the conductivity closed to that of the back- ground zero. Only the higher values over the threshold are kept their numerical s olution. With this modification, the reconstruction matrix is refreshed and the artifacts o f the images expected to be reduced. 3. RECONSTRUCTION IMAGES The reconstructed image is refined into 12 layers and 576 elements by FEM. In simulation, we set to foreign targets in a homogenous circle. The conductivities are set to 1 background σ = , arg 1 0.5 t et σ = , arg 2 2 t et σ = . The recon- struction images are shown in Figure 1. The trial-and- error method is adopted to decide the threshold. We got 0.155, 0.18qp=−= for GN solutions. In Figure 1, blue blocks are the lower conductivity targets and red blocks are the higher conductivity targets. 4. EVALUATI O NS We elaborate two targets to characterize the quality of a reconstructed image. Clearly, there are several criteria proposed to evaluate the EIT systems, including hard- ware and algorithms [15,16]. Most comments of the im- ages are lack of objectivity. In this paper, relative errors and the correlated coefficients of images are adopted to evaluate the modification effects. 4.1. Relative Errors (RE) The defi ni tion of relative errors is RE ∗ ∗ − =xx x (3) Original GN MGN (a) (b) (c) Figure 1. Simulation reconstruct ed images. (a ) Original images; (b) Reconstructed images by GN; (c) Modified images by GN . where, ∗ x is the normalized grey vector including all the pixels of the simulated image, while x presents that of the reconstructed image. The smaller RE means the higher quality of the reconstructed image. 4.2. Correlated Coefficient (CC) Correlated coefficient (CC) is adopted to express the related degree of the reconstructed image to the simu- lated image, and calculated by ( ) () ( ) () 1 2 2 11 N ii i NN ii ii x xxx CC xx xx ∗ ∗ = ∗ ∗ = = −− = −− ∑ ∑∑ (4) where, ∗ x is the normalized grey vector including all the pixels of the simulated image, while x presents that of the reconstructed image. ∗ x is the average value of 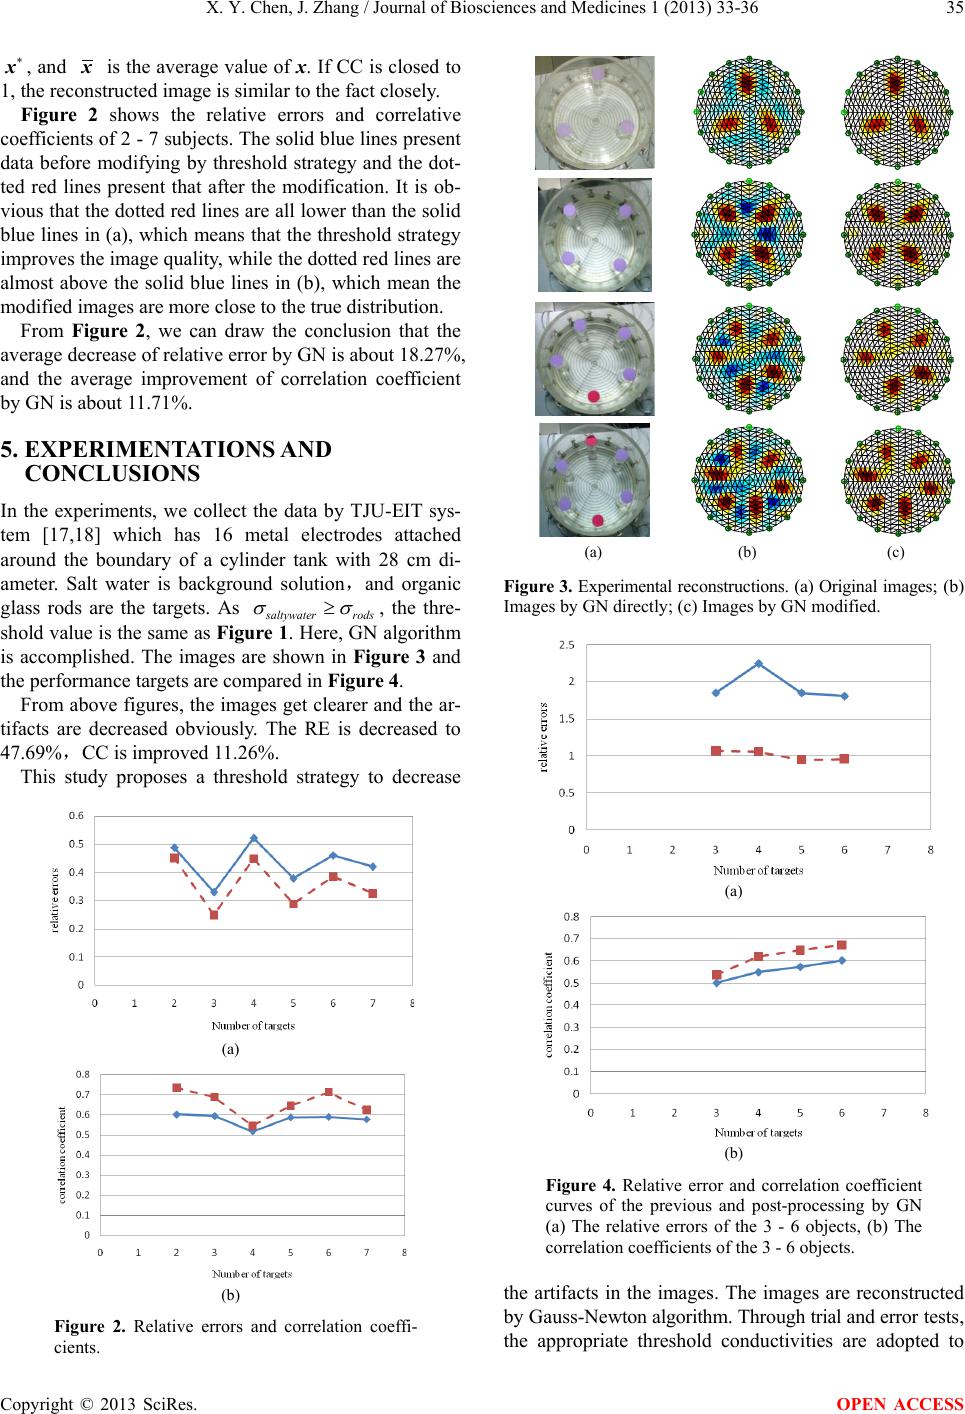 X. Y. Chen, J. Zhang / Journal of Biosciences and Medicines 1 (2013) 33-36 Copyright © 2013 SciRes. OPEN ACCESS 35 ∗ x , and x is the average value of x. If CC is closed to 1, the reconstructed image is similar to the fact closely. Figure 2 shows the relative errors and correlative coefficients of 2 - 7 subjects. The solid blue lines present data before modifying by threshold strategy and the dot- ted red lines present that after the modification. It is ob- vious that the dotted red lines are all lower than the solid blue lines in (a), which means that the thresho ld strategy improves the image quality, while the dotted red lines are almost above the solid blue lines in (b), which mean the modified images are more close to the true distribution. From Figure 2, we can draw the conclusion that the average decrease of relative error by GN is about 18.27%, and the average improvement of correlation coefficient by GN is about 11.71%. 5. EXPERIMENT A TIONS AND CONCLUSIO NS In the experiments, we collect the data by TJU-EIT sys- tem [17,18] which has 16 metal electrodes attached around the boundary of a cylinder tank with 28 cm di- ameter. Salt water is background solution,and organic glass rods are the targets. As saltywater rods σσ ≥ , the thre- shold value is the same as Fi gu re 1 . Here, GN algorithm is accomplished. The images are shown in Figure 3 and the performance targets are compared in Figure 4. From above figures, the images get clearer and the ar- tifacts are decreased obviously. The RE is decreased to 47.69%,CC is improved 11.26%. This study proposes a threshold strategy to decrease (a) (b) Figure 2. Relative errors and correlation coeffi- cients. (a) (b) (c) Figure 3. Experimental re constructions. (a) Ori ginal images; (b) Images by GN dire ctly; (c) Images by GN modified. (a) (b) Figure 4. Relative error and correlation coefficient curves of the previous and post-processing by GN (a) The relative errors of the 3 - 6 objects, (b) The correlation coefficients of the 3 - 6 objects. the artifacts in the images. The images are reconstructed by Gauss-Newton algorithm. Through trial and error tests, the appropriate threshold conductivities are adopted to  X. Y. Chen, J. Zhang / Journal of Biosciences and Medicines 1 (2013) 33-36 Copyright © 2013 SciRes. OPEN ACCESS 36 modify the reconstructed matrix, and the modified im- ages are achieved and evaluated through the relative er- ror and correlation coefficient, respectively. Simulation and experimental results show that the artifacts are re- duced and the images are improved significantly, which prove that the proposed approach makes significant con- tribution in improving EIT images. 6. ACKNOWLEDGEMENTS This work is supported by Natural Science Foundation of China (GN: 50937005) and the Natural Science Foundation of Tianjin Municipal Science and Technology Commission (GN: 08JCYBJC03500). The authors wish to ex press thei r sp ec ial gratitu de to P rof esso r Chaoshi Ren, Chinese Academy o f Medical Science and Peking Un ion Medical Col- lege Institute of Biomedical Engineering for his sincerest academic advises on this paper. REFERENCES [1] Brown, B.H., Primhak, R. A., Smallwood, R.H., Milnes, P., Narracott, A.J. and Jackson, M.J. (2002) Neonatal lungs-maturational changes in lung resisitivity spectra. Journal of Medical and Biological Engineering, 40, pp. 506-511. http://dx.doi.org/10.1007/BF02345447 [2] Kerrouche, N., McLeod, C.N. and Lionheart, W.R.B. (2001) Time series of EIT chest images using singular value decomposition and Fourier transform. Physiologi- cal Measurement, 22, 147-158. http://dx.doi.org/10.1088/0967-3334/22/1/318 [3] Kulkarni, R., Kao, T.J., Boverman, G. , Isaacson, D., Saulnier, G.J. and Newell, J.C. (2009) A two-layered forward model of tissue for electrical impedance tomo- graphy. Physiological Measurement, 30, 19-34. http://dx.doi.org/10.1088/0967-3334/30/6/S02 [4] Newell, J.C., Gisser, D.G. and Isaacson, D. (1988) An electric current tomography. IEEE Transactions on Bio- medical Engineering, 35, 828-833. http://dx.doi.org/10.1109/10.7289 [5] Morucci, J.P. and Marsili, P.M. (1996) Bioelectrical im- pedance techniques in medicine Part III: Impedance im- aging. Critical Reviews in Biomedical Engineering, 24, 599-654. [6] Hanke, M. and Bruhl, M. (2003) Recent progress in elec- trical impedance tomography. Inverse Problems, 19, 65- 90. http://dx.doi.org/10.1088/0266-5611/19/6/055 [7] Holder, D.S. (2004) Electrical impedance tomography methods: history and applications. Institute of Physics Pub, Bristol, 1-65. [8] Ida, N. and Bastos, J. P.A. (1997) Electromagnetics and calculation of fields. 2nd Edition, Springer-Verlag Inc., New York. http://dx.doi.org/10.1007/978-1-4612-0661-3 [9] Polydorides, N. (2002) Image reconstruction algorithms for soft-field tomography. PhD Thesis, UMIST. [10] Vauhkonen, P.J., Vauhkonen, M., Savolainen, T. and Kaipio, J. P. (1999) Three dimensional electrical imped- ance tomography based on the complete electrode model. IEEE Transactions on Biomedical Engineering, 46, 1150- 1160. http://dx.doi.org/10.1109/10.784147 [11] Somersalo, E., Cheney, M. and Isaacson, D. (1992) Exis- tence and uniqueness for electrode models for electric current computed tomography. SIAM Journal on Applied Mathematics, 52, 1023-1040. [12] Dan, F. and Hagan, F.M.T. (1997) Gauss-Newton appro- ximation to Bayesian learning. International Conference on Neural Networks, 3, 1930-1935. [13] Bernhard, B., et al. (2003) Direct estimation of Cole para- meters in multifrequency EIT using a regularized Gauss- Newton method. Physiological Measurement, 24, 437. http://dx.doi.org/10.1088/0967-3334/24/2/355 [14] Andy, A., John, H.A. and Richard, B. (2009) GREIT: A unified approach to 2D linear EIT reconstruction of lung images. Physiological Measurement, 30, 35-55. http://dx.doi.org/10.1088/0967-3334/30/6/S03 [15] Tanguay, L.F., Gagnon, H. and Guardo, R. (2007) Com- parison of applied and induced current electrical imped- ance tomography. IEEE Transactions on Biomedical En- gineering, 54, 1643-1649. http://dx.doi.org/10.1109/TBME.2007.892930 [16] Ryan, H., Alex, H. and Ke ith, D.P. (2004) Design and implementation of a high frequency electrical impedance tomography system. Physiological Measurement, 25, 379- 390. http://dx.doi.org/10.1088/0967-3334/25/1/041 [17] Chen, X.Y., Wang, H. X., et al. (2008) Lung ventilation imaging with prior information by Electrical Impedance Tomography. IEEE IMTC, 1531-1537. [18] Chen, X.Y., Wang, H.X., et al. (2009) Lung ventilation functional monitoring based on Electrical Impedance To- mography. Transactions of Tianjin University, 15, 7-12. |